MAG7 Powers Market; Breadth Wanes, But Still Bullish; QQQ Two Standard Deviation Move
Key Takeaways
- MAG7 stocks power SPY and QQQ.
- MAGS surges to new highs after a flag breakout.
- NDX breadth wanes, but remains bullish.
- QQQ becomes overbought and stays overbought.
While there are concerns with broad market breadth and performance outside of the tech sector, the bull market is not over until QQQ sings. In fact, even a correction is unlikely as long as QQQ and Nasdaq 100 breadth remain strong.
Today's report starts with the influence of the MAG7 stocks and the new high in MAGS. We then turn to the leading uptrend in QQQ and two key Nasdaq 100 breadth indicators. Despite a bullish environment, there are concerns because QQQ is trading two standard deviations above the 200-day SMA.
MAG7 Stocks Power SPY and QQQ
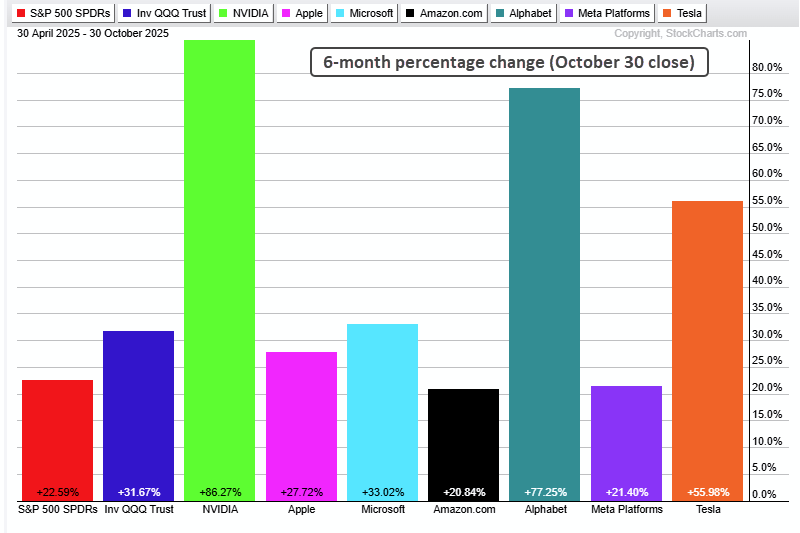
QQQ and key mega caps in the Nasdaq 100 are the primary driving force in the market right now. The MAG7 stocks account for a whopping 38.5% of the S&P 500. On average, these seven stocks are up 46% the last six months (May 1 to October 30). The PerfChart below shows six month performance for SPY, QQQ, and these seven stocks. NVIDIA (+86.27%), Alphabet (+77.25%), and Tesla (+55.98%) are leading the charge. Like it or not, the MAG7 stocks are part of the S&P 500 and there is a bull market somewhere. Our job is to focus on what is working!
MAGS Surges to New Highs
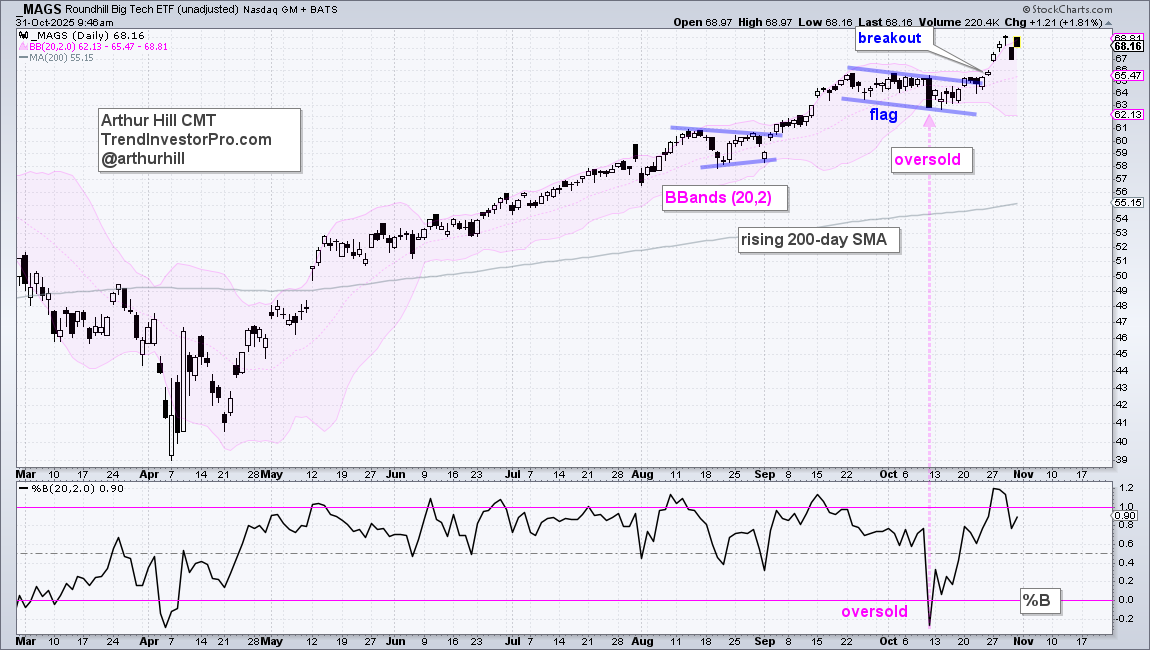
The next chart shows the Mag7 ETF (MAGS) with an oversold reading in mid-October, a bull flag, and a breakout on October 24th. This setup was featured in the Friday Chart Fix on October 17th. MAGS hit new highs this week and remains in a strong uptrend. This ETF was one of several we identified with short-term bullish continuation patterns in mid-October.
Recent reports and videos at TrendInvestorPro:
- Oversold setups for gold, a gold stock and the Gold Miners ETF.
- Copper and industrial metals ignore precious metals with move higher.
- Bullish setups for a copper/gold miner and a software/semiconductor stock.
- Tech ETFs continue to lead with follow-through on flag/pennant breakouts.
- Click here to take a trial and gain full access.
QQQ Trend and Breadth are Bullish
The weight of the evidence is bullish for QQQ and Nasdaq 100 breadth. First and foremost, QQQ is in a leading uptrend because it hit new highs this week and is well above the rising 200-day SMA. You do not need to be a rocket scientist to figure out that this trend is up, and strong.
Even though mega-caps dominate QQQ, Nasdaq 100 breadth also favors the bulls. The middle window shows the percentage of NDX stocks above their 200-day SMA. This indicator is currently at 56%, which means most stocks are in long-term uptrends. Admittedly, 44% are in long-term downtrends, which is a sizable portion. However, the cup is half full right now and the present conditions matter most.
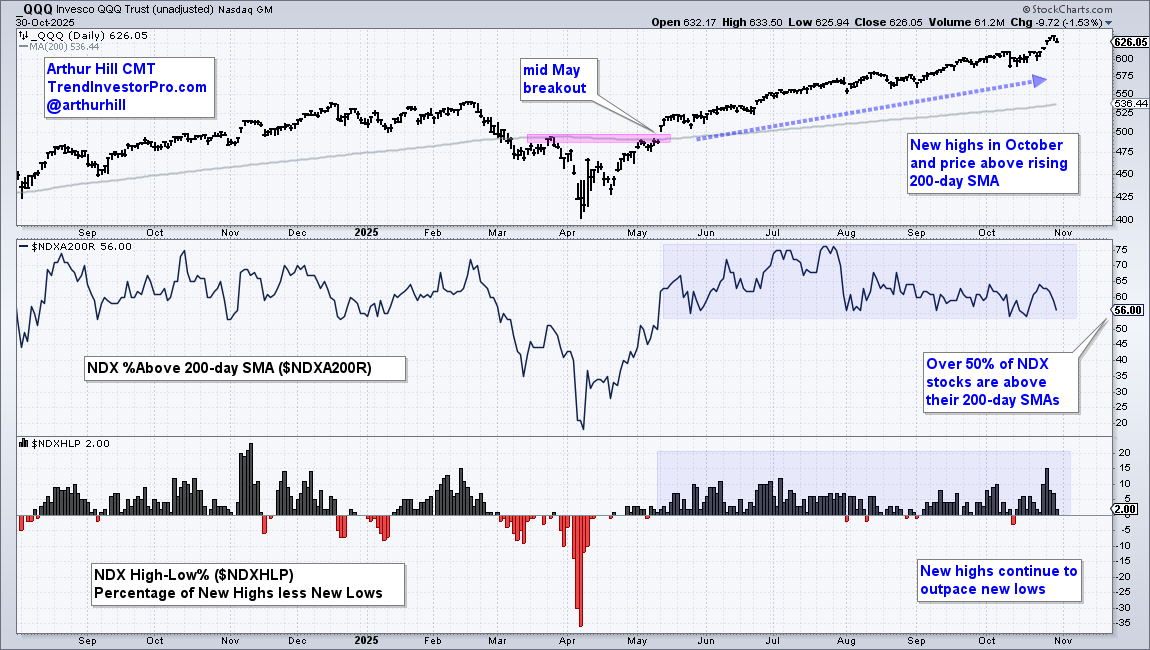
The lower window shows NDX High-Low Percent, which is the percentage of stocks making new highs less the percentage making new lows. This indicator hit +15% on Monday, its highest reading since the uptrend began (mid May). This indicator turned slightly negative a few times since August, but the new highs are outpacing new lows overall. No problems here. This breadth model is part of the Market Regime page at TrendInvestorPro.
QQQ Becomes Overbought and Stays Overbought
Stocks and ETFs can become overbought and remain overbought during strong uptrends. We are seeing this play out in QQQ as it moves above the upper Bollinger Band (200,2). On the chart below, the middle line is the 200-day SMA and the Bands are two standard deviations above/below this key moving average. QQQ closed above the upper Bollinger Band on Tuesday and Wednesday. Since August, QQQ closed above the upper Bollinger Band on August 12/13, September 22, and October 28/29. This is a classic case of becoming overbought and remaining overbought during a strong uptrend.
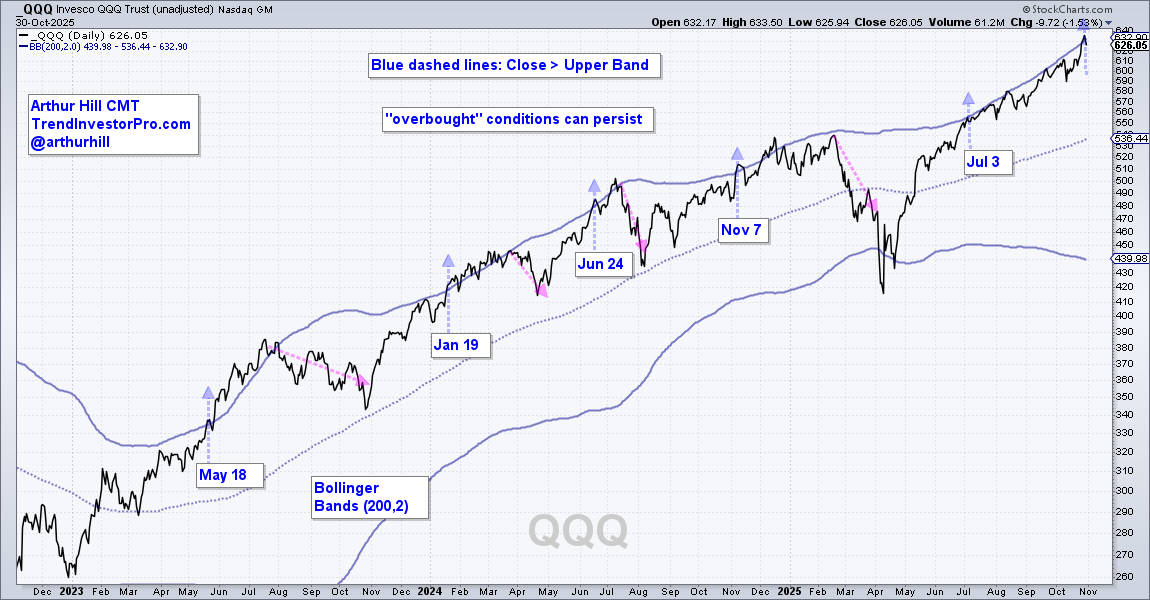
The blue arrows show when QQQ initially crossed above the upper Bollinger Band and the dates. Typically, QQQ extends higher after the initial cross and does not correct until 1–4 months later (pink arrow lines). The current run is exceptional because QQQ crossed the upper Bollinger Band on July 3rd and extended higher the last four months. Clearly, this advance is getting long in tooth and ripe for a correction. But when?
Because overbought conditions can persist, chartists need an indicator to signal a momentum shift to the downside. Such a shift can foreshadow a pullback or even an extended correction, such as those in August–October 2023 and January–March 2025. NDX breadth is also bullish, so chartists must set key levels to identify a shift from bull market to bear market. In a follow-up report, we show an indicator to quantify momentum shifts in QQQ and the key levels for the breadth indicators. This report is available to TrendInvestorPro subscribers.
See TrendInvestorPro for more chart analysis and videos.


