The Market’s Stuck in Neutral: What Could Break the Standstill?

Key Takeaways
- The major stock market indexes saw plenty of movement, but ended the week mostly flat.
- Market breadth and sentiment indicators suggest caution as stocks move through a short-term consolidation.
- Uncertainty around Fed rate-cut expectations could be causing uncertainty among investors.
If you took a little vacation this week, you didn’t miss too much in terms of where the major indexes ended up. There was a lot of back and forth action but, now that the dust has settled, here’s the weekly performance of the indexes:
- Dow Jones Industrial Average ($INDU): 47,147.48 (+0.34%)
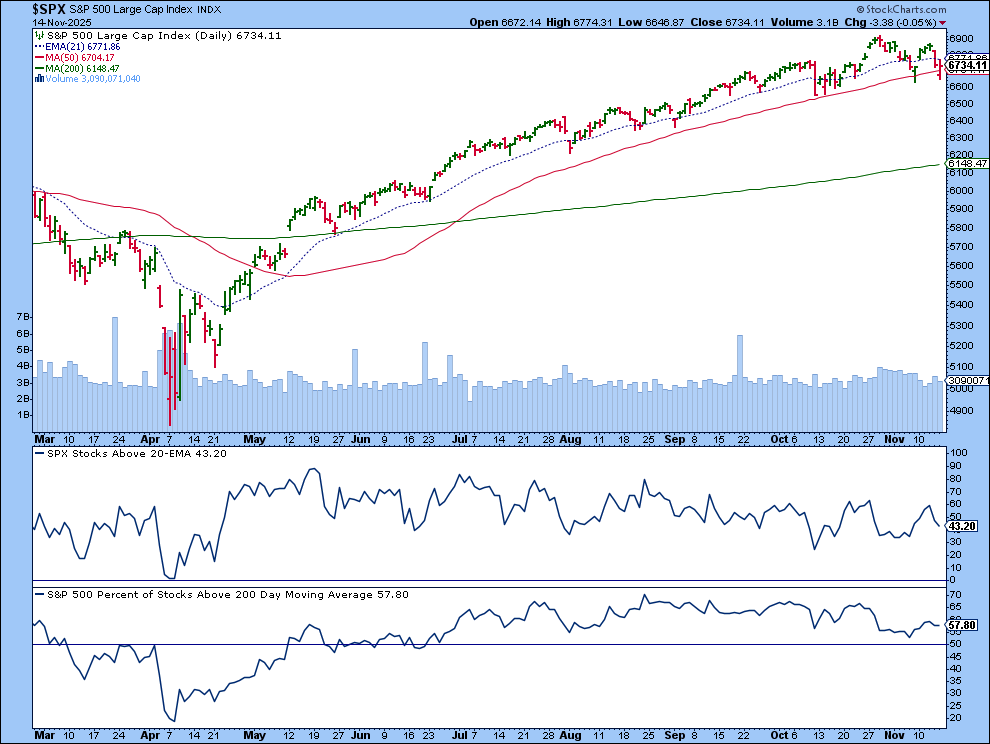
- S&P 500 ($SPX): 6,734.11 (+0.08%)
- Nasdaq Composite ($COMPQ): 22,900.59 (-0.45%)
Though there may have been some dip-buying going on, profit-taking stepped in towards the end of the day. This is typical heading into a weekend. What really matters now is which direction the market decides to take on Monday or the rest of next week.
Is the Market Catching Its Breath?
The broader indexes are showing signs of consolidation. The Nasdaq and S&P 500 have slipped into a pattern of lower highs and lower lows, while the Dow, even after it sold off, is still holding on to its trend of higher highs and higher lows pattern.
Market breadth isn’t showing anything too alarming, either. The two breadth indicators in the S&P 500 chart below show that the percentage of S&P 500 stocks trading above their 20-day Exponential Moving Average (EMA) registered above 40 after Thursday’s selloff. In addition, more than half of the S&P 500 stocks are trading above their 200-day SMA. These are far from “panic” readings.
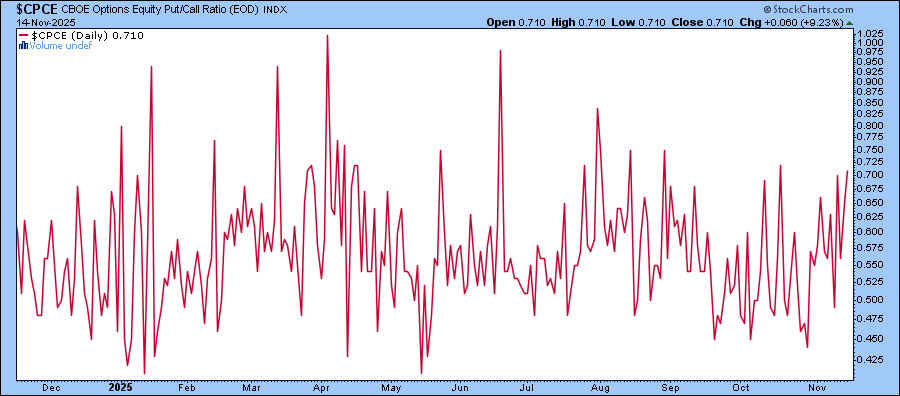
The Cboe Options Equity Put/Call Ratio ($CPCE) tells a similar story. Yes, there are more puts than calls, but not enough to suggest investors are panicking.
What’s Mr. Market Waiting For?
At times, the market acts like someone standing at a crossroads. It’s not ready to commit until it gets a little more information.
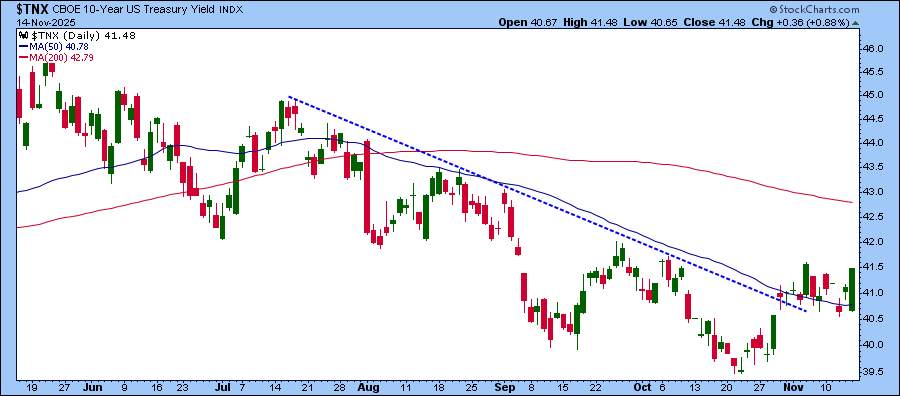
A big shift happened in expectations for a December interest rate cut. Just last week, the probability was above 90%, but now that probability has fallen to below 50%. This seems to be weighing on investors’ confidence.
The 10-year Treasury yield has broken out of its downtrend. It’s also moving sideways, but Friday’s upside move was noticeable.
Looking Ahead
We’re in a bit of “no-man’s land” now, with the bulls waiting for more clarity before fully stepping in.
Next week brings NVIDIA earnings, a flurry of Fed speeches, and the FOMC meeting minutes. If investors are anxious about what the Fed will do next, this could be the week that either reassures them or adds more worry.
Disclaimer: This blog is for educational purposes only and should not be construed as financial advice. The ideas and strategies should never be used without first assessing your own personal and financial situation, or without consulting a financial professional.


