Are Japanese Equities Topping Out? If so, Will US Equities be Far Behind?
- Japanese Equities May be on the Verge of a Major Breakdown.
- Yen Close to an Unexpected Upside breakout?
- Nikkei has led Every US Stock Market Peak Since 1990.
Normally Martin Pring's Market Roundup, the PMR, will give you a short-term synopsis of the US equity and bond markets as well as the dollar, gold and major commodity indexes. However, I think the technical position for Japanese equities has reached a potential breakdown point with the currency possibly set to move higher. If this suspicion proves correct then this could feed back into the US and other global markets in an adverse way. Next time I'll focus on the usual markets but for now let's take a look at the longer-term aspects of the Japanese situation
Since late 2012 the Japanese economy has been enjoying the benefits from the reflationary policies of Shinzo Abe, otherwise known as Abenomics. As a consequence, the equity market exploded to the upside in 2013 and the Japanese yen imploded on the downside. However, Chart 1 shows that the effect, whilst dynamic was relatively short lived and the Nikkei saw the bulk of its gains attained by May of 2013. Chart 1 also shows that the Index is pretty close to completing a top. In actual fact, if you jiggle the line on a less conservative basis it would be possible to come up with a completed one.
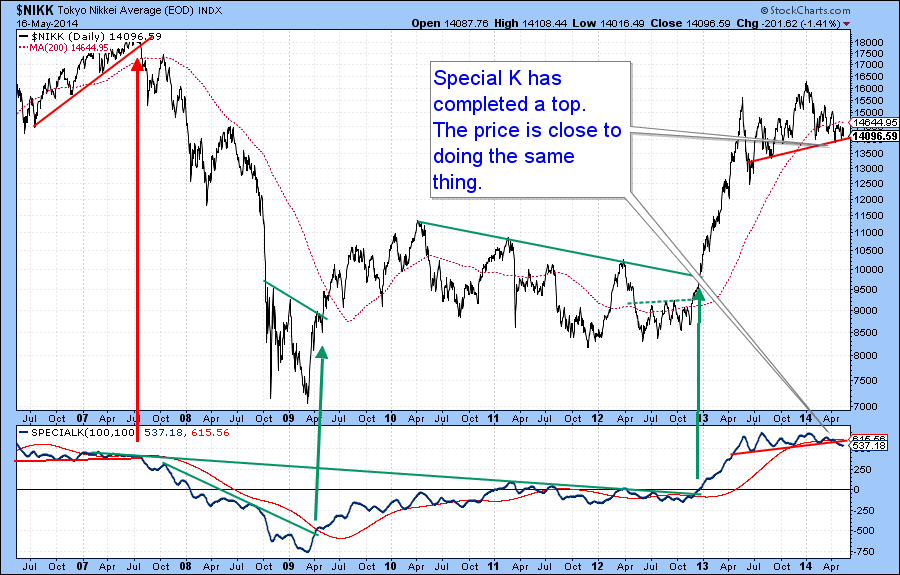
Chart 1
The indicator in the lower panel is my Special K (SPK), a new edition to the StockCharts tool kit. You can read about it here. Essentially, it’s a long-term momentum indicator constructed from short, intermediate and long-term momentum. The idea behind its design is to reflect primary bull and bear markets. In most cases you will find that the SPK actually peaks and troughs with the price series it is monitoring. Since it's a momentum indicator, that’s not always possible as linear trends found in secular bull markets cause it to peak prematurely, and during a truncated cycles it can be late. Most market cycles though, revolve around the 4-year business cycle and that means the SPK flags primary trends pretty closely.
From a practical point of view the indicator signals changes in the primary trend when it violates a meaningful trendline and this is confirmed by some kind of trend break for the price. Previous examples of these SPK/price combinations are flagged in the chart. Recently the SPK completed a top and dropped below its MA, thereby triggering a momentum sell signal. The Nikkei is already below its 200-day MA, so all that is required is for it follow suite with a decisive break below its trendline with, say, a daily close below 13,800. In that event a new bear market will be signaled.
In the last few years the relationship between the equity market and the dollar/yen have been closely correlated as you can see from Chart 2. Note that the yen itself has been inverted to correspond with movements in the Nikkei. The reason for the connection between the currency and the Nikkei lies in the fact that Japanese exporters have largely left their prices unchanged, which means that yen weakness has gone straight to the bottom line, thereby stimulating equities. If it now rises (shown here as a decline) profits will fall accordingly. Once again the trendline combinations between the Nikkei and yen have offered some pretty prescient signals of primary trend reversals in both, but Whither the yen now?
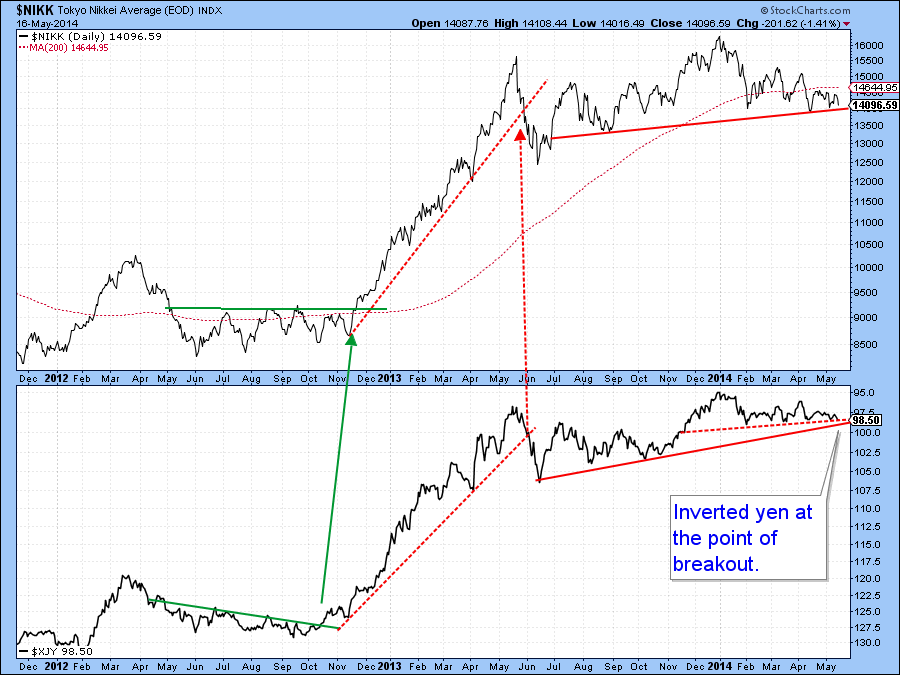
Chart 2
Chart 3 compares the yen to my long-term KST. This indicator, which you can read about here, is a long-term smoothed momentum series that attempts to reflect the direction and maturity of primary trends. The yen itself has once again been inverted to correspond with movements in the Nikkei.
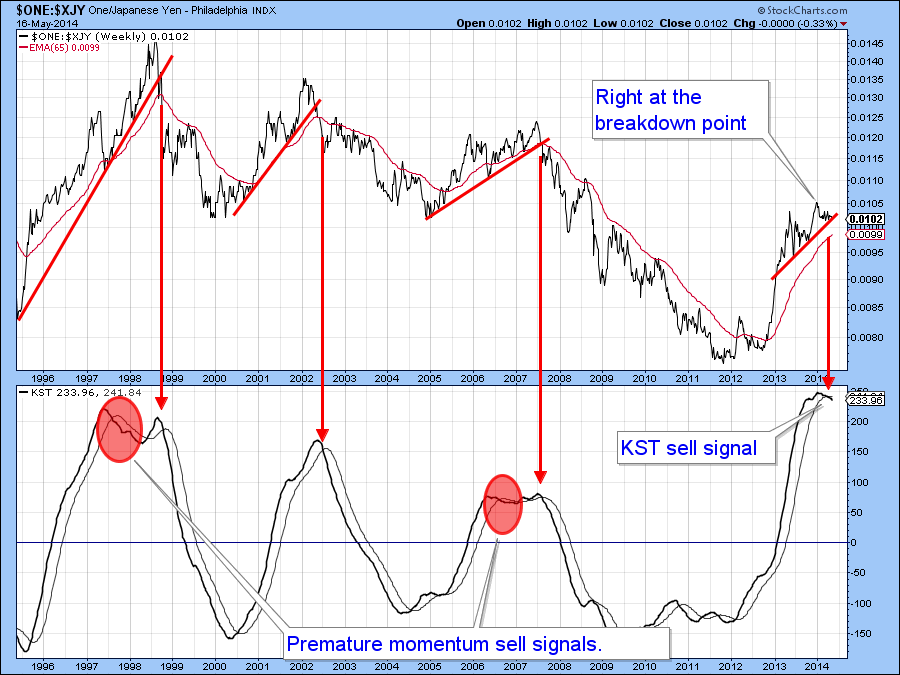
Chart 3
StockCharts Tip: Note in the top left hand corner of the chart placing the symbol $ONE: in front of the desired security symbol inverts the data
The red arrows show that when it crosses above its MA from a sub-zero position the yen usually begins a bull market. The two ellipses show that this is not a perfect indicator as they both experienced whipsaw signals. That’s why it’s of paramount importance to make sure that the price confirms such action with a trendline break or some other trend reversal signal. Currently the KST has triggered a bull market signal but the currency remains below its trendline.
Chart 4 shows the yen in greater detail and it looks to me as if it wants to go higher, which on this inversely plotted chart means lower. First, it has violated the 2013-2014 down trendline and second the KST has started to roll over to the downside. All that is required is for the price to confirm with a decisive break below the potential head and shoulders neckline (red line).
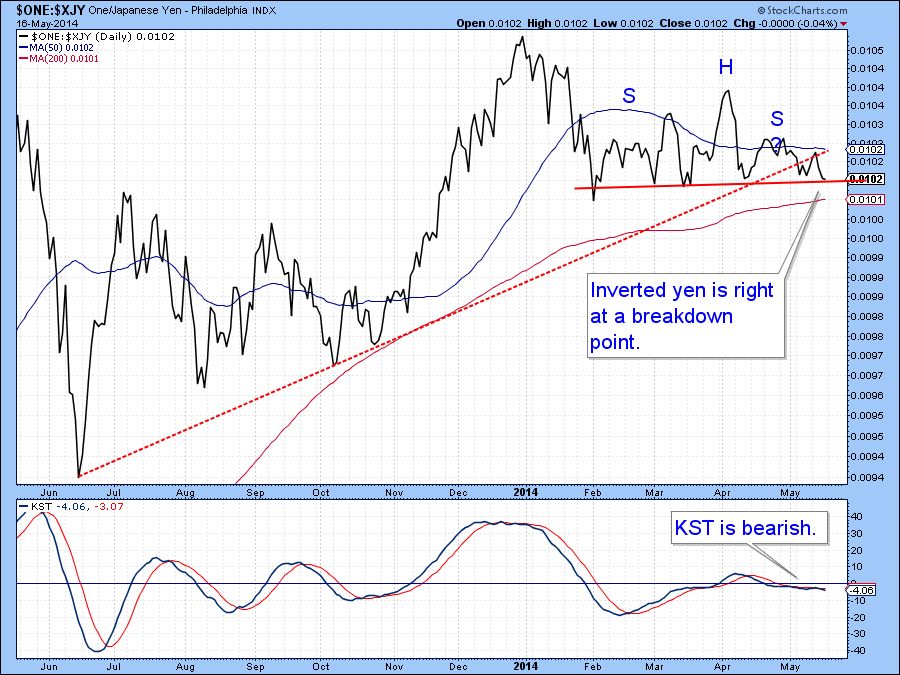
Chart 4
lf the yen and Nikkei both experience downside breaks, which seems likely, but which is no certainty, I believe it would have deflationary consequences. For equities it would signal the failure of Abenomics. With Japan as the world's third biggest economy with a relatively high debt to GDP ratio of 227% does that matter for the US?
My final chart, chart 5, shows that the Nikkei, since its secular bear market began in 1990, has led every recession associated peak in the US, by varying amounts of time. If 13,800, is taken out that would confirm a top in Japanese equities and the question would then relate as to how long it would take the US to follow suit? The other question I would ask is thatif,and i'ts a big if, Japanese equities implode, would this mean a loss of confidence in the BOJ and by implication in other central banks. So far they have been able to expand their balance sheets with impunity based on one factor-confidence. If that confidence should begin to crack, things could unwind quickly revealing global central bank profligacy for what it really is.......a BUBBLE!
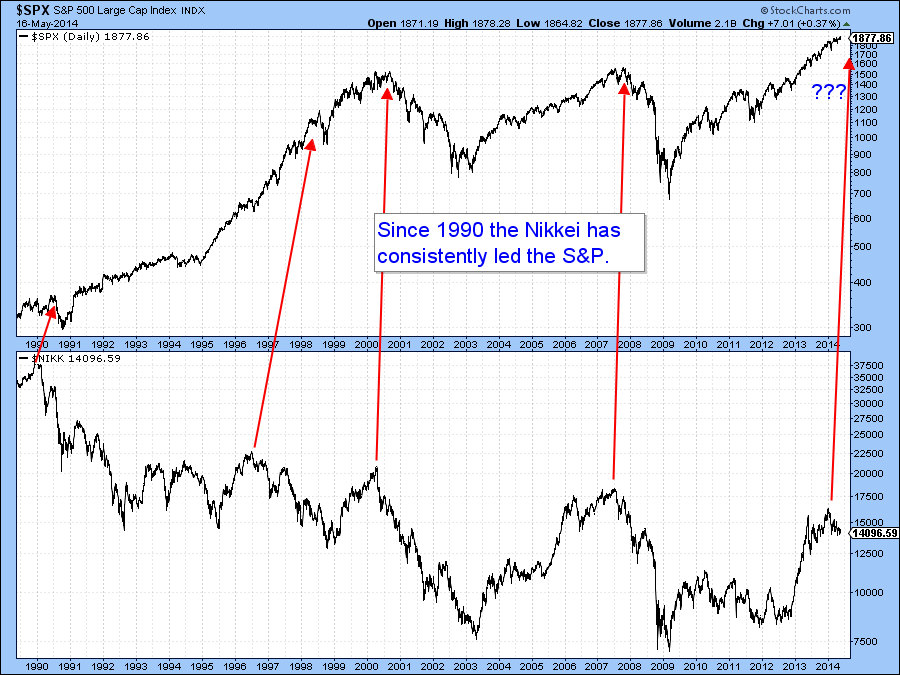
Chart 5
Thanks for reading,
- Martin


