US Dollar Index Tentatively Breaks Out from a Ten Year Base
- Short-term indicators still bullish for stocks.
- Growth (IVE) about to break out against value (IVW).
- Commodity market experiences bullish short-term divergence.
(Click here for a video version of this commentary.)
US Equities
The short-term indicators i.e. those monitoring trends that range from 3-6-weeks remain in a bullish mode and are not yet overextended. A pause in the recent strong advance would not be unexpected, but as long as these indicators continue to point north the uptrend should be considered to be intact. Chart 1, for instance features my Dow Diffusion indicator. This is a smoothed measure of Dow stocks that are above their 40-day MA’s. As long as it can continue to advance this indicator is giving us the all-clear for equities. The current relatively low reading also suggests that prices will continue to advance.
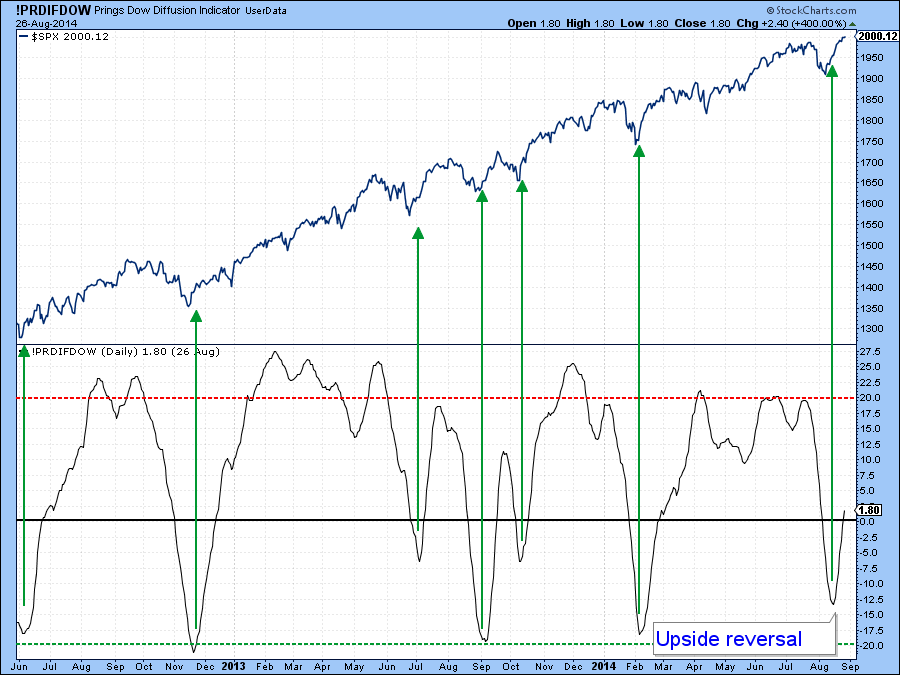
Chart 1
The KST indicator in Chart 2 supports a bullish near-term outlook, with its positive trend and current relatively neutral reading.

Chart 2
Even though, the indicators suggest higher prices several indexes and indicators have reached resistance in the form of previous highs. Take the broadly base NYSE Composite. Unlike the S&P this series did not record a new all-time high in August and has now rallied back to resistance as flagged by the green trendline. The KST remains at a subdued level, but if the recent rally pauses we might see a scenario similar to the blue line play out, as a kind of right shoulder correction takes hold. This is certainly not a prediction, merely a possible scenario.

Chart 3
Chart 4 shows overhead resistance for the brokers ETF, the IAI where it is close to its previous high. The upside/downside cumulative volume line is in a similar position, all of which suggests that some sectors might experience some kind of a correction from here.

Chart 4
Finally, Chart 5, which I posted in an earlier Roundup, reminds us that what is taking place now is probably part of an overall topping out process for the bull market, where many sectors, such as the Value Line Arithmetic, struggle to make new highs as say, the Dow and S&P extend their bull markets. This Special K break that we see is a serious one and the red up trendline violation for the Index itself is indicative of a loss of upside momentum.

Chart 5
Chart 6 indicates that growth stocks in the form of the IVW may be about to break out against value (IVE). That would require a daily close in the ratio above 1.186. Remember you can update the chart by clicking on it. At this point all three KSTs are in a rising mode, so the odds of an ultimate upside breakout favoring growth stocks is pretty high.

Chart 6
Chart 7 shows that the US has, and is likely to continue, to out-perform the rest of the world. That’s because the ratio of the SPY to the MSCI Europe Australia Far East ETF, the EFA, has recently broken out from a huge consolidation pattern. Both the short- and intermediate KSTs are supporting the breakout and their long-term counterpart is just about to do so. Usually this ratio and the Dollar Index move in a similar direction, so the breakout supports the idea of a major Dollar Index advance as discussed below.

Chart 7
US Credit Markets
The 5-year yield remains in its recent trading range. The two benchmarks are 1.8% on the upside and 1.5% on the downside. The KST has started to ever-so-slightly reverse to the upside, so an attempt at the upper part of the trading range seems likely.

Chart 8
US Dollar Index
Last week I drew your attention to the fact that the short-term KST for the Dollar ETF, the UUP had started to roll over and concluded that a correction of some kind in an overall basing process was likely. The Index had other ideas and barreled ahead. It has now tentatively broken out from a 10-year base. I say “tentatively” because the break is a marginal one and this chart is based on end-of-the-month prices. That means that we will not actually know whether there is a breakout until Friday. Note also that the long-term KST has started to turn up, which is another positive sign. Provided the breakout holds the upside objective is just over 100 on the Index, as flagged by these two brown arrows.

Chart 9
Chart 10 features the short- and intermediate KSTs and both are in a positive mode. That suggests that a more decisive breakout in the monthly chart is likely to take place, either this month or next. Just by looking at recent price action it is pretty evident that on a very short-term basis things are very overstretched, so I would not be surprised to see some digestion of recent gains. In any event the odds ultimately favor an upside breakout, whether now or later.

Chart 10
Precious Metals
A rising dollar is usually a bearish factor for gold and its related assets, but there have been periods when both have rallied simultaneously. Chart10 compares the recent progress of the Index to the Gold Share ETF, the GDX. The shares have been plotted inversely to correspond with movements in the currency. As you can see, most of the time the two move closely together. However, there have been enough periods, as flagged by the shaded areas, when the two series have followed opposite paths. Recently we have seen a divergence as the Index has rallied and the GDX just gone sideways. That action suggests that their normal simultaneous paths may have become unlocked again.

Chart 11
Chart 12 shows that the GDX could be in the process of forming a base, which would require a decisive break above $27.50 to complete. So far, the overbought condition in the KST has been worked off by the price moving sideways, which is a good sign. So too is the fact that during this corrective period the bullish percentage in the bottom panel was able to edge slightly higher. This indicates that under the surface the technical position is improving because some of the GDX components are turning bullish, even though the GDX itself has lost a little ground.

Chart 12
Commodities
The Dow Jones UBS Commodity ETN, the DJP, remains within its recent down channel. However, both momentum series have started to reverse to the upside, so it seems likely that the price will soon break above the green down trendline marking the top of the channel.

Chart 13
The 10-day net new high series could be in the process of setting up a very positive divergence. That’s because the number of commodities hitting 10-day net new highs maxed out on the downside in mid-July, well before the low in the price was registered. Recently the price was at a new low but relatively few commodities were following suit. The key now is to see whether the price can rally decisively above the green trendline with say, a daily close above $37. Were that to happen I think the potential positive new high divergence could set the scene for a pretty spirited advance.

Chart 14
Good luck and good charting!
Martin Pring
The views expressed in this article are those of the author and do not necessarily reflect the position or opinion of Pring Turner Capital Group or its affiliates.


