An Important Move is Likely for Gold and Silver in Early 2015. Here are the Chart Points to Watch
- Dollar based gold is in a bear market.
- Yen and euro denominated gold are in primary bull markets.
- Gold shares complete a massive top.
Last week we reviewed the technical picture of the major currencies. This week it is the turn of the precious metals because the finely balanced technical position of some of them suggests that important moves are likely to get underway early in the New Year.
Long-term Picture For Gold
Chart 1 shows that gold remains in a primary bear market. The evidence comes from the fact that the price is below its 12-month MA, but more importantly, has been tracing out a series of lower peaks and troughs since 2011. Finally it remains below the green resistance trendline marking the top of a potential base. A move above the $1250-1280 area would clear the MA and the trendline thereby suggesting that the primary trend had reversed to the upside. Were that to happen it would also be confirmed by the KST, which is already in a bullish mode.
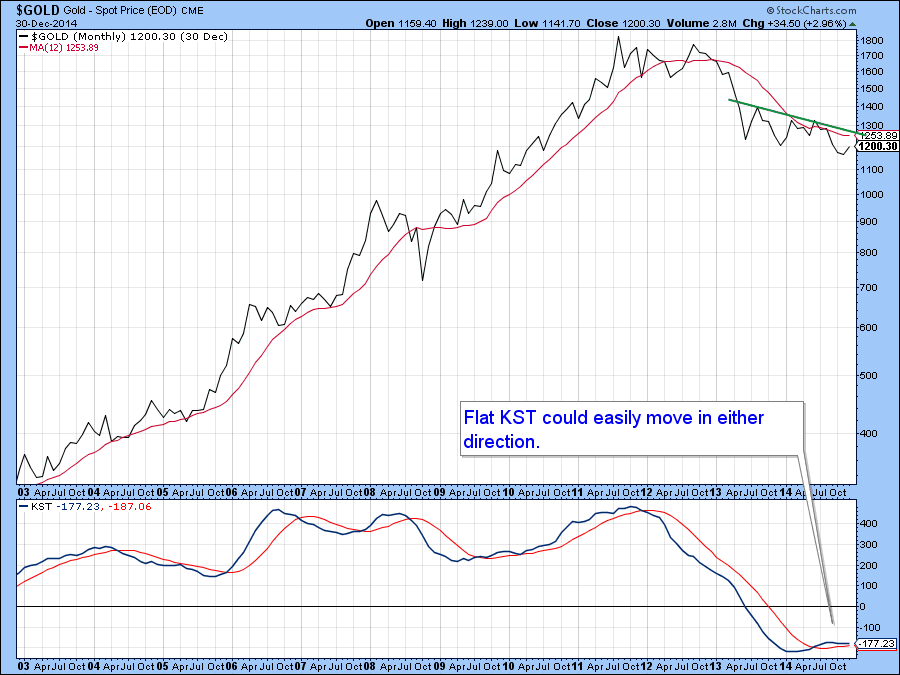
Chart 1
When we look at gold expressed in euro and yen a different picture emerges. For instance, Chart 2 indicates that euro denominated gold has broken out from a reverse head and shoulders pattern and crossed above its 12-month MA. Moreover, the MA itself has also begun to rally, which is usually a pretty reliable signal of a primary uptrend. Note also the series of rising peaks and troughs that have been developing since the 2013 low.
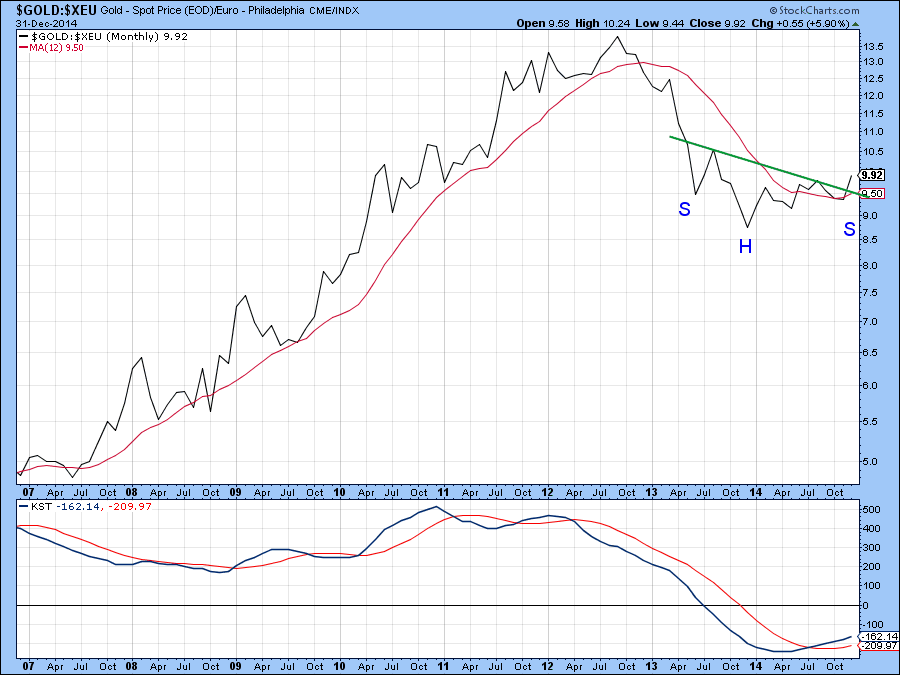
Chart 2
In the case of yen denominated gold we see a head and shoulders top that tried to form between mid-2011 and 2014. However, it was never completed with a break below the neckline. Instead the price rallied through the green resistance trendline joining a series of 2013-2014 peaks. Head and shoulders patterns that do not work are often followed by above average price moves, and since the KST has also gone bullish, I think there is lots of upside potential here.
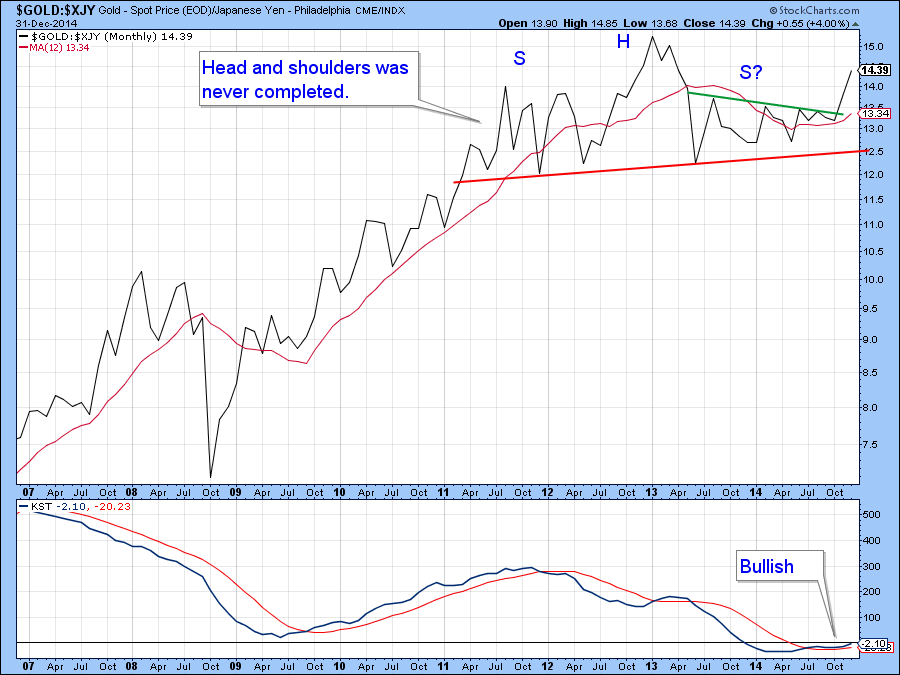
Chart 3
Gold shares often lead the price of gold since they are more leveraged and tend to discount the average future price rather than the current one. In this respect the long-term technical action of the Gold Miners Gold Share Index ($GDM), the tracking index for the Market Vectors Gold Miners ETF (GDX) is not offering much in the way of encouragement for the bulls. Chart 4 indicates that it has recently completed a massive head and shoulders top. If the price rallies early in the New Year and moves above the green down trendline and 12- month MA, say to 650, that would cancel the pattern. However, as it stands right now the chart has an overall bearish feel to it, despite the slightly positive KST.

Chart 4
Chart 5 offers some long-term perspective on the silver price. A few years ago it completed and broke out from a giant reverse head and shoulders but was unable to maintain the breakout. Not only that, but the price recently violated the up trendline joining the head with the right shoulder. Usually this kind of action sets the price up for a long-term decline, so despite the oversold short-term condition, the outlook for the gray metal does not look to be that encouraging. Moreover, a close up view of the KST shows that it has just marginally crossed below its MA.
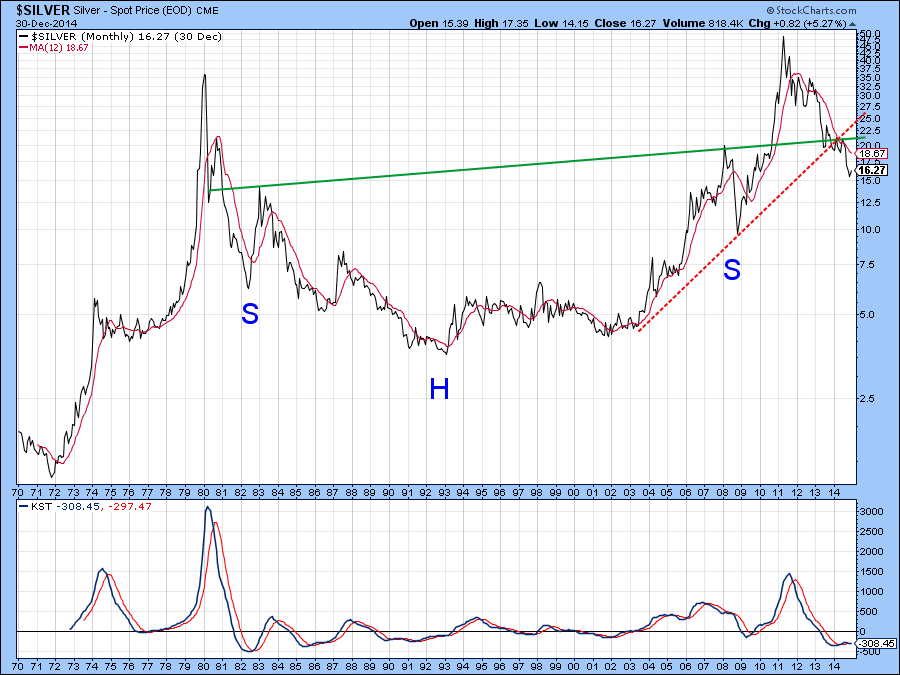
Chart 5
Platinum has also completed a massive top and violated its 1999-2014 up trendline. Since the KST is definitely in a bearish mode, substantial long-term downside potential still exists. In order for the situation to reverse we would need to see a rally that would result in a decisive month-end close above the previous high at $1500. In that way the price would have cleared some major resistance barriers, but until then a cautious stance is the most appropriate.
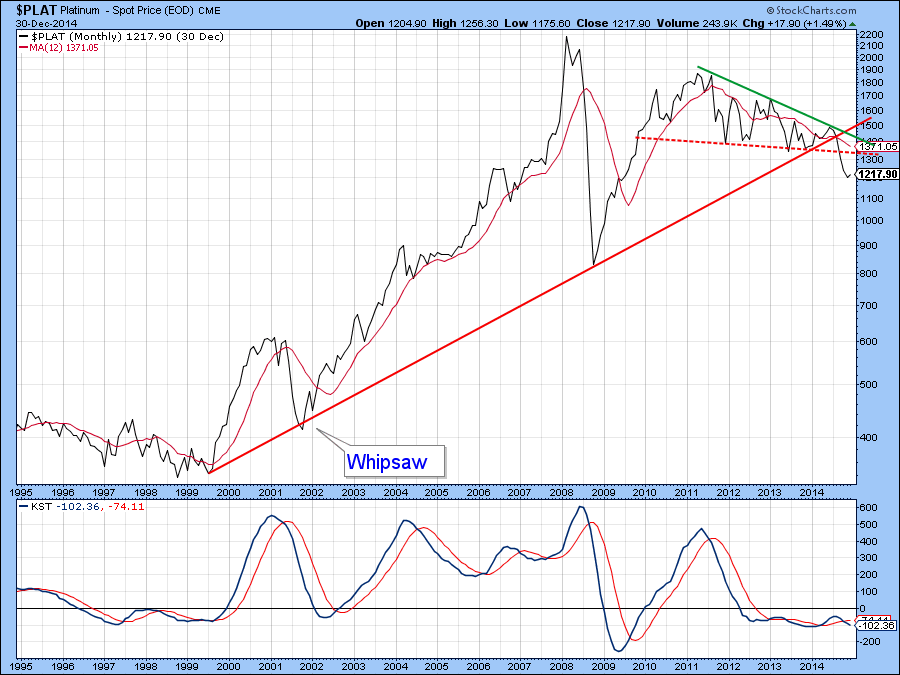
Chart 6
Palladium is the most bullish of the dollar denominated precious metals, but even here the price appears to be struggling to maintain a position above its 2010-2014 up trendline. The KST remains in a positive mode but recent rolling over action suggests that if the red up trendline at around $800 is decisively violated, the whole picture will turn pear shaped.
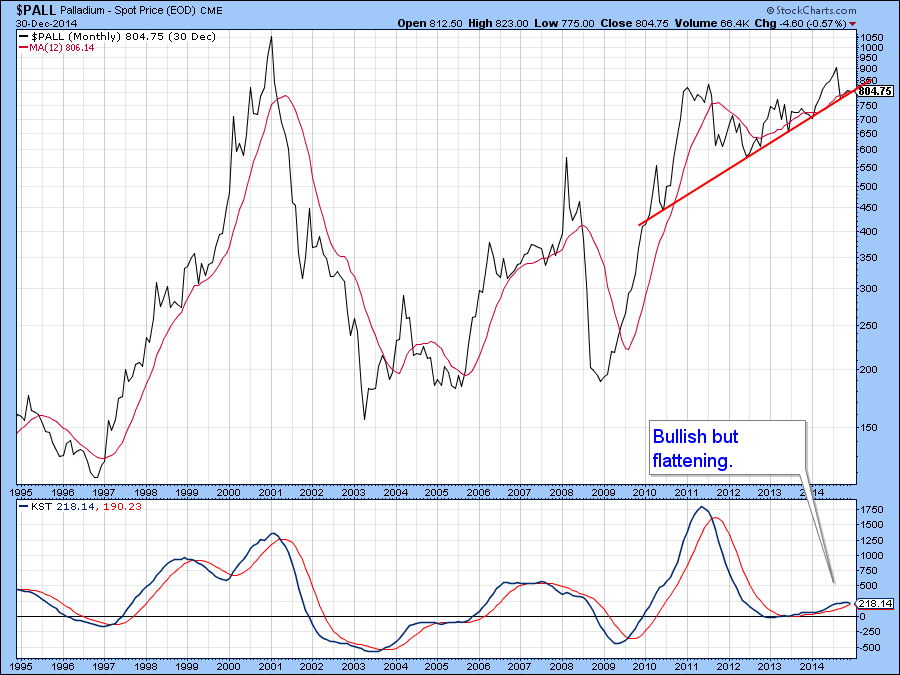
Chart 7
The Short-term Picture
Chart 8 shows that the short-term technical position is quite challenged for the Gold Trust ETF, the GLD. A couple of weeks ago I pointed out the potential for the price to break down from a bearish flag. That happened, but the price also moved back above the flag’s lower line, suggesting that the “flag breakdown” had failed. However, it quickly reversed again, thereby indicating that the rally above that lower flag trendline was a whipsaw. Since whipsaws are often followed by strong moves in the opposite direction, gold will face a very important short-term test early in the New Year, especially as the KST in Chart 8 remains in a bearish mode.
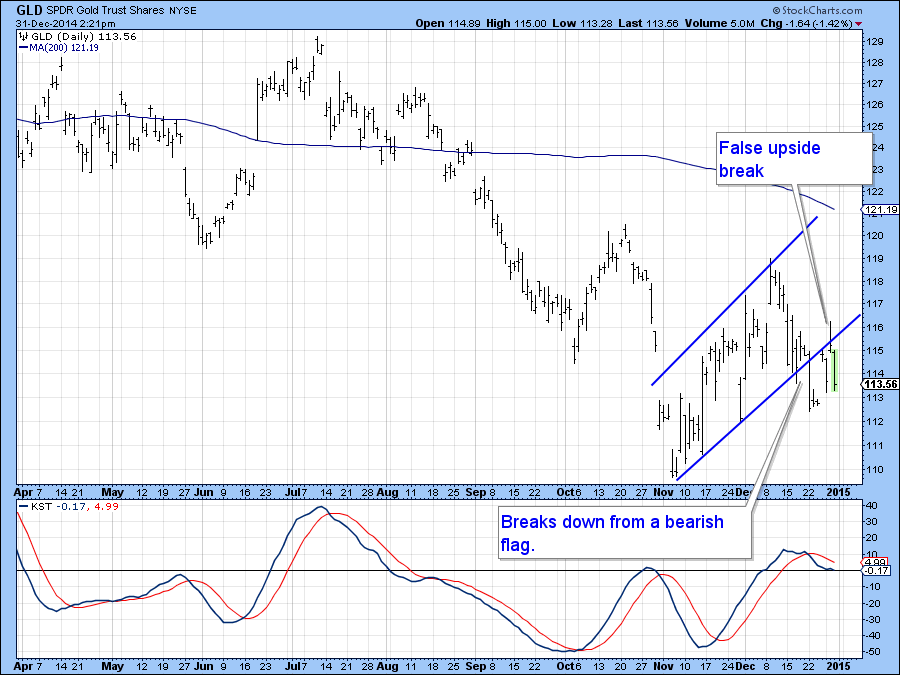
Chart 8
Chart 9 offers the nature of the challenge since it is quite possible that the price has been forming a bearish continuation head and shoulders pattern, as shown in the upper panel of the chart. On the other hand, the glass could be half full as it’s also possible that the price is in the final throes of tracing out a reverse head and shoulders formation. The two numbers to watch out for are $112 on the downside and $119 for a decisive upside breakout on the upside.
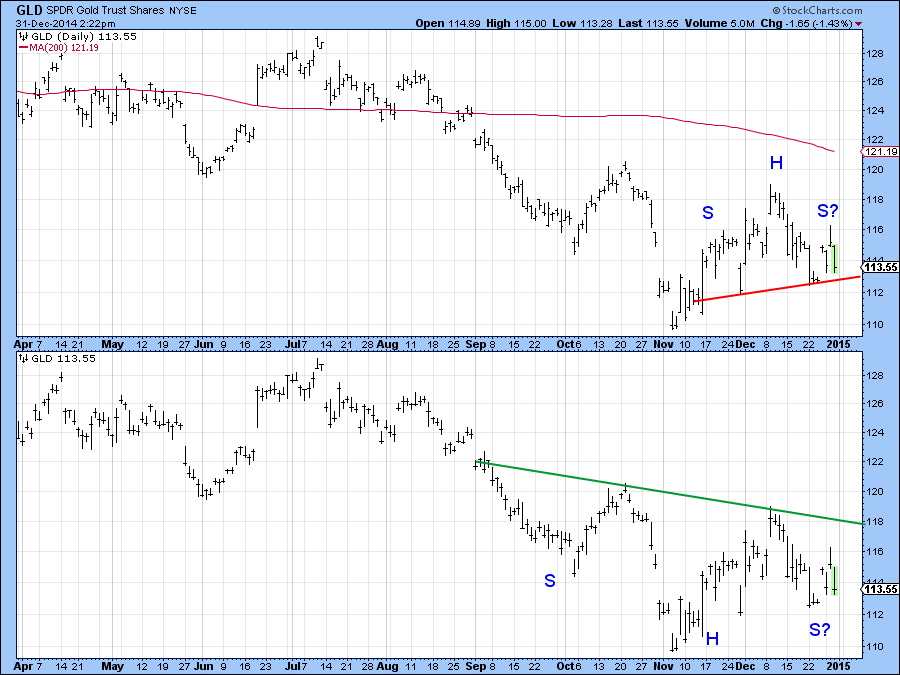
Chart 9
Chart 10 shows a similar dual outlook for the silver price. Here the battle lines are roughly drawn at $16 and $14.50. The KST is currently bearish but it would not take much to reverse that downward trajectory.
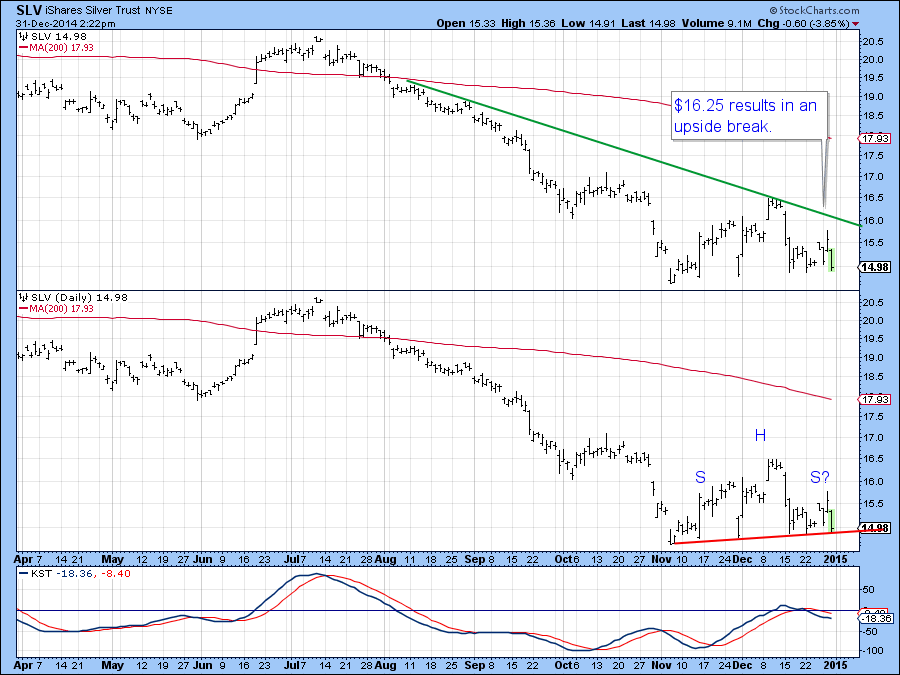
Chart 10
In the case of both gold and silver the short-term technical picture is very finely balanced and could easily tip in either direction.
Finally, chart 11 shows that joint trendline breaks for the Gold Miners ETF, the GDX, and the A/D Line constructed from gold shares have offered some good signals of changes in the short-term trend recently. Currently the A/D Line has experienced a tentative upside breakout but the price has not. That would require a move above $19.50. Such action would not be sufficient to reverse the bearish long-term trend discussed earlier, but it would be an important first step.
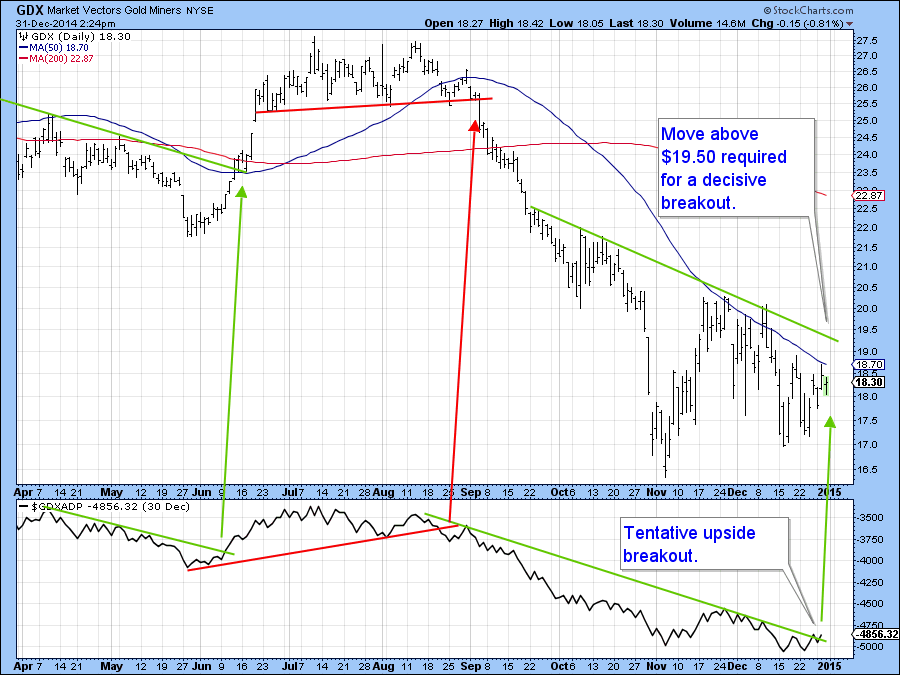
Chart 11
Conclusion
The majority of the long-term technical evidence indicates that dollar denominated precious metal prices are currently experiencing a primary bear market. However, the short-term picture for gold and silver is finely balanced and does have the potential to reverse the bearish indicators in the event that the near-term position gets resolved in a positive way. In the meantime a cautious stance is recommended.
Gold expressed in euro and yen is in a primary bull market, so for investors wanting exposure to the yellow metal these might be the ways to do so.
Good luck, good charting and a happy, healthy and prosperous new year to all from Greg and myself.
Martin Pring
The views expressed in this article are those of the author and do not necessarily reflect the position or opinion of Pring Turner Capital Group or its affiliates.


