End Of The Year Dollar Index Review
- Long-term dollar rally likely to continue.
- Yuan on the edge of a breakdown.
- January is tied with November as the most bullish month for the dollar.
- Short-term dollar momentum overstretched but re-accelerating to the upside.
Currencies
At the end of August the US Dollar Index ($USD) broke out from a huge base. Chart 1 shows that the minimum objective of this formation of around 102 has yet to be reached. My feeling, notwithstanding counter-cyclical corrections along the way, is that this is just the start of the overall move. If we take a look at the major individual currencies we can see why that might be so.
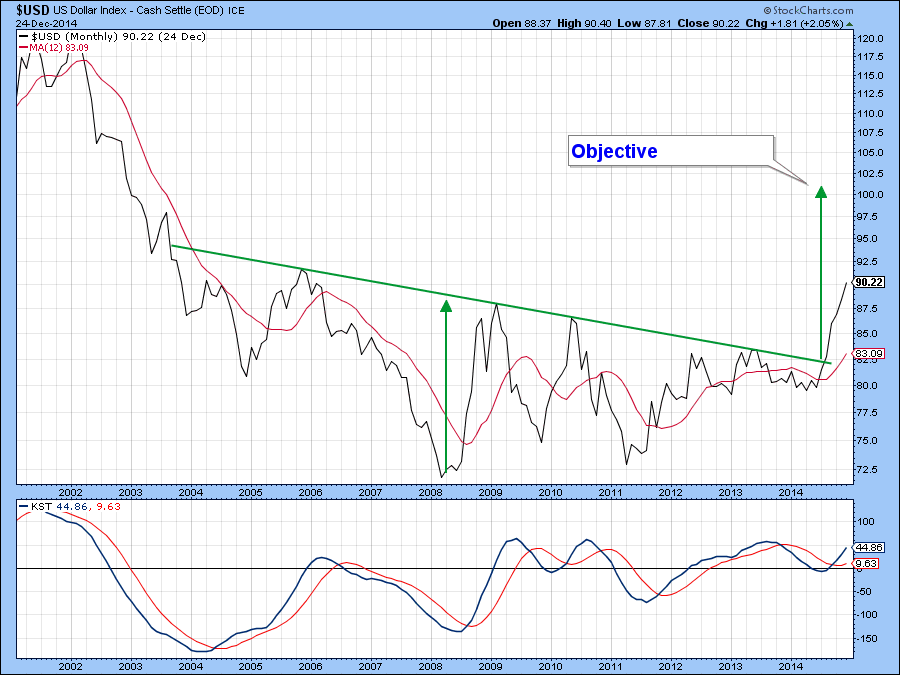
Chart 1
Chart 2 for instance, shows four currencies, the Euro ($XEU), the Yen ($XJY), Australian Dollar ($XAD) and the Canadian Dollar. ($CDW). Each has formed and broken down from a multi-year top. The Euro, for instance, has the largest (57%) weighting in the Dollar Index and has barely broken to the downside at this point. This indicates that much more potential for further weakness still exists. Equally important is the fact that the breakdowns for the other currencies are also recent, which again suggests the likelihood of further substantial losses. The minimum ultimate downside objectives have been flagged by the blue dashed arrows. There is no guarantee that prices will fall to these objectives. However, in most situations price pattern objectives are usually exceeded, often by multiples of the initial objective. Moreover, the broad based nature of these bear moves suggests that the US dollar is moving up in its own right rather than an advance based on someone else’s weakness.
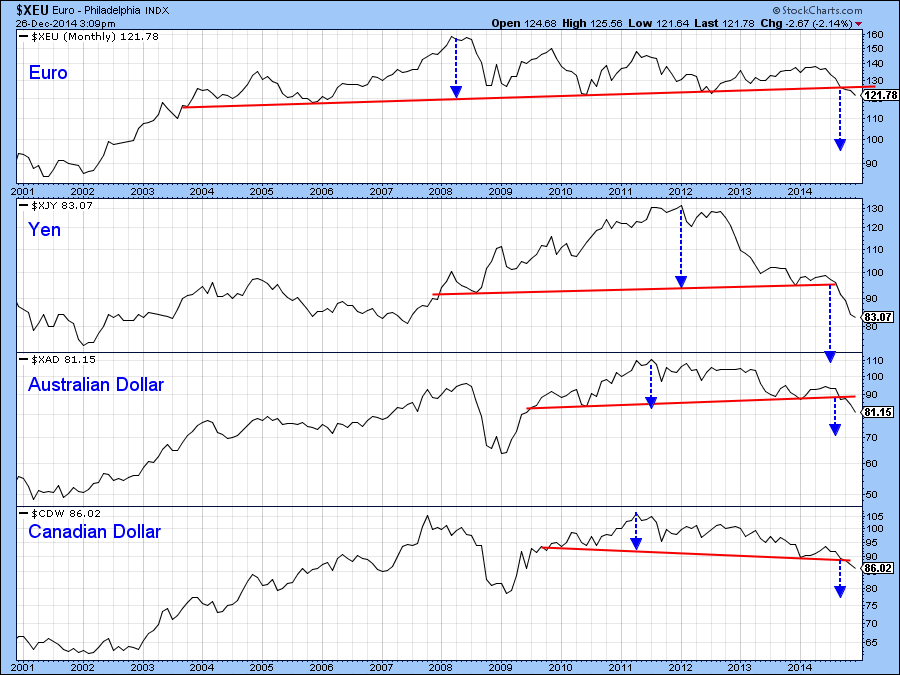
Chart 2
Chart 3 includes the Great Britain Pound Sterling ($GBPUSD) and Swiss Franc ($CHFUSD). Sterling has yet to break negatively along the lines of the currencies in Chart 2. However, you can see that it did experience a false break above the blue trendline a while back. Whipsaw moves such as this are often followed by severe declines and that seems likely in this case. By way of support for this view, look at the negative action of the pound’s long-term KST in Chart 4.
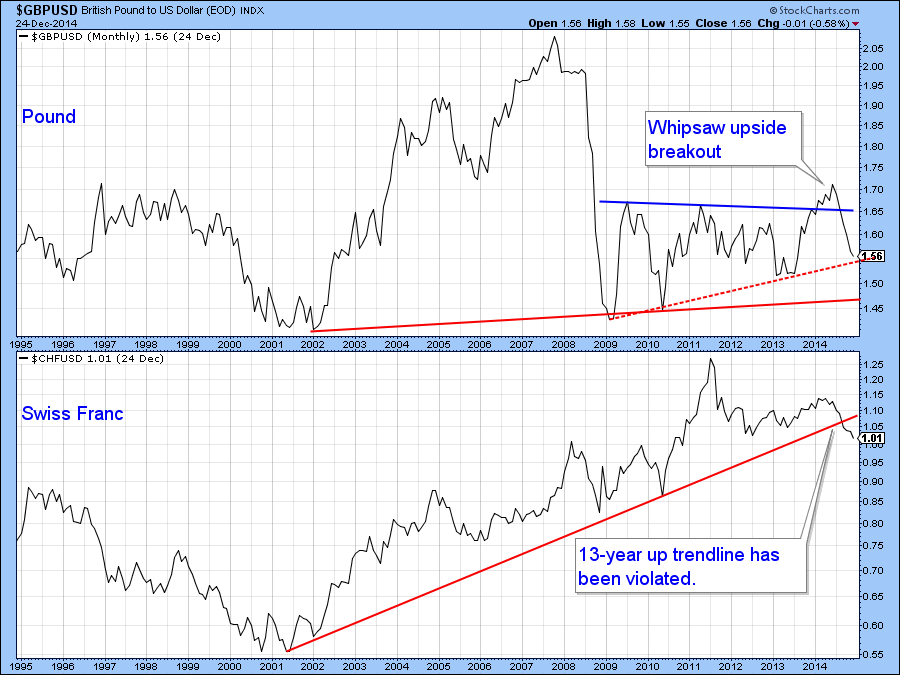
Chart 3
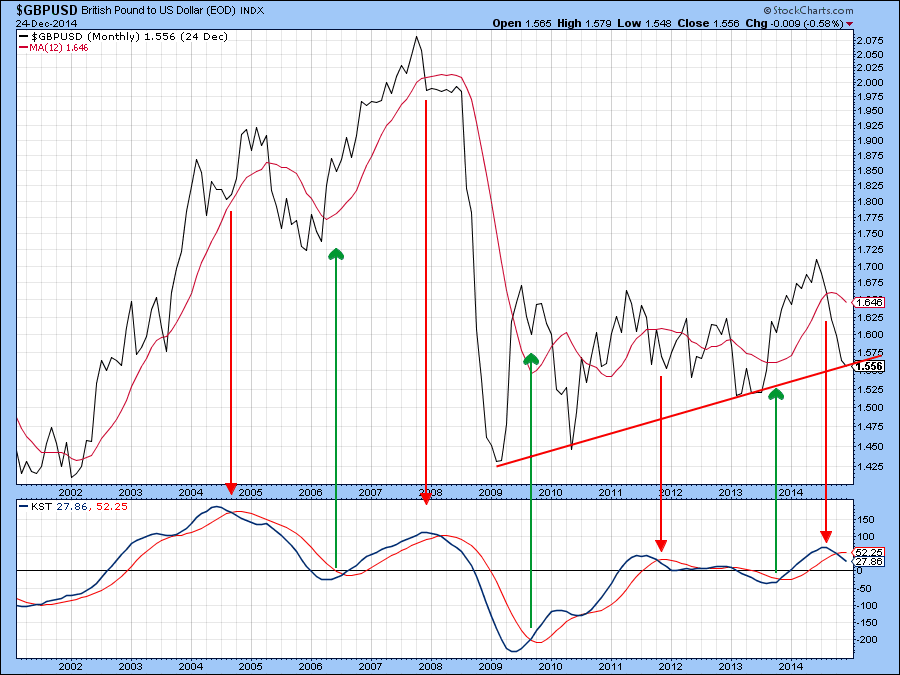
Chart 4
The Swiss Franc ($CHFUSD) is one of the few currencies that has not formed a top against the dollar. However, it has violated a 12-year up trendline, which is no small feat. It could be argued that the franc has actually completed a double top formation, though my feeling is that the second 2014 peak, does not really qualify as it’s much lower than its 2011 counterpart. These semantics do not really matter. What does is the fact that we see bearish price action. After all, we give these formations names more to help us identify important turning points than as strict pass or fail descriptions. In this instance we can observe a series of declining peaks and troughs, which in my book is outright bearish. Note that the minimum ultimate downside objective using this pattern would be for the franc to fall to 80 c level.
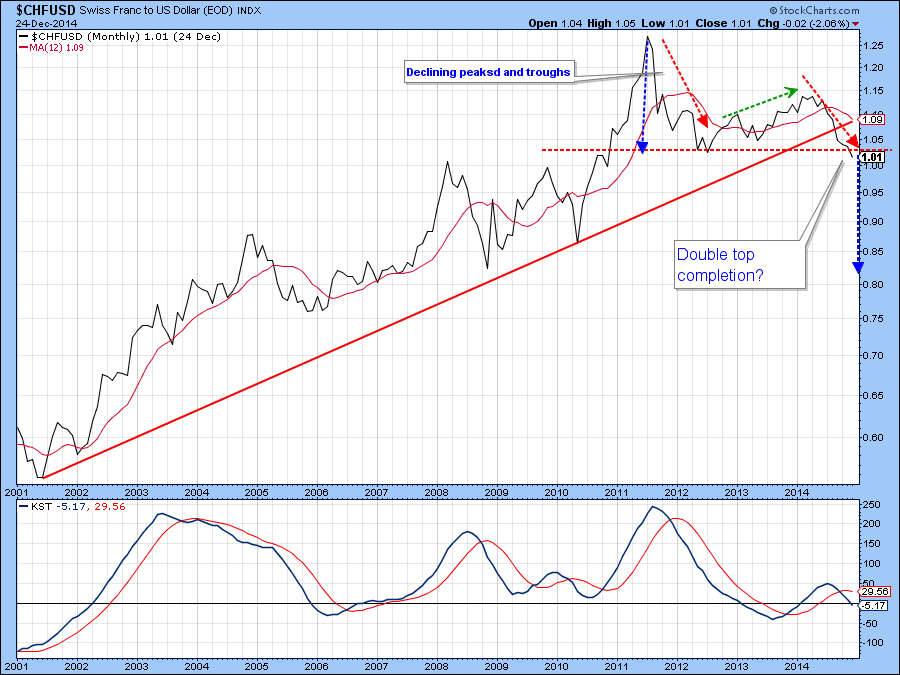
Chart 5
Emerging market currencies are not immune to dollar strength either as the Wisdom Tree Emerging Market Currency Fund (CEW) has also completed a large top. The downside objective indicated by the dashed blue arrow is literally “off the chart”, and calls for a move below the $16 area. It is no secret that countries around the world have taken on huge amounts of US dollar denominated debts in the last five years. Estimates range from $3-9 trillion, a significant amount of which is concentrated in emerging market economies. Think for a moment that if the US dollar rises, corporations and government entities owing this debt will be squeezed as they need to convert more of their local currencies in higher prices dollars. No wonder that there is an inverse correlation between the US dollar and most international stock markets, especially those in the emerging category. Just think of it as a giant short squeeze from positions that were accumulated during the 10-year base building process experienced by the US Dollar Index.
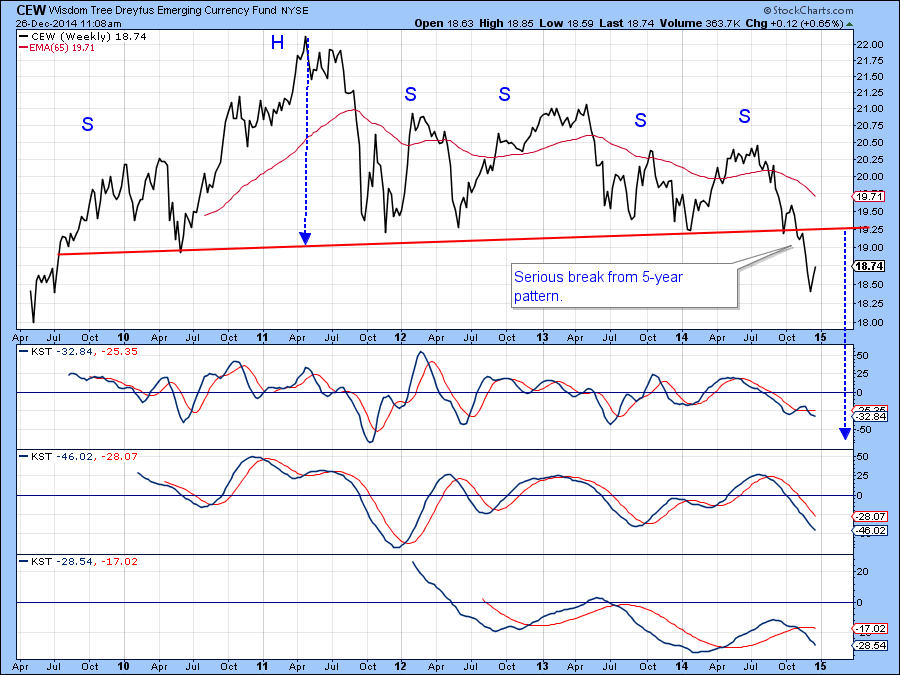
Chart 6
Chart 7 shows recent price action by the WisdomTree Chinese Yuan fund (CYB). The price has been in an uptrend for the last few years but has now fallen back to its 2010-2014 up trendline and 200-day MA. The Special K is a momentum indicator constructed from short, intermediate and long-term trends and often peaks and troughs with the price series it is monitoring. In this respect the 2010 low and 2014 high have been flagged by the green and red arrows. Because this indicator reflects primary trend reversals when it experiences a major trendline violation this is often a reliable signal of a primary trend reversal. The current situation already sports a violation of an important dashed red up trendline. However, should we observe a penetration of the solid red trendline and the price itself the technical balance would shift strongly into the bearish camp.
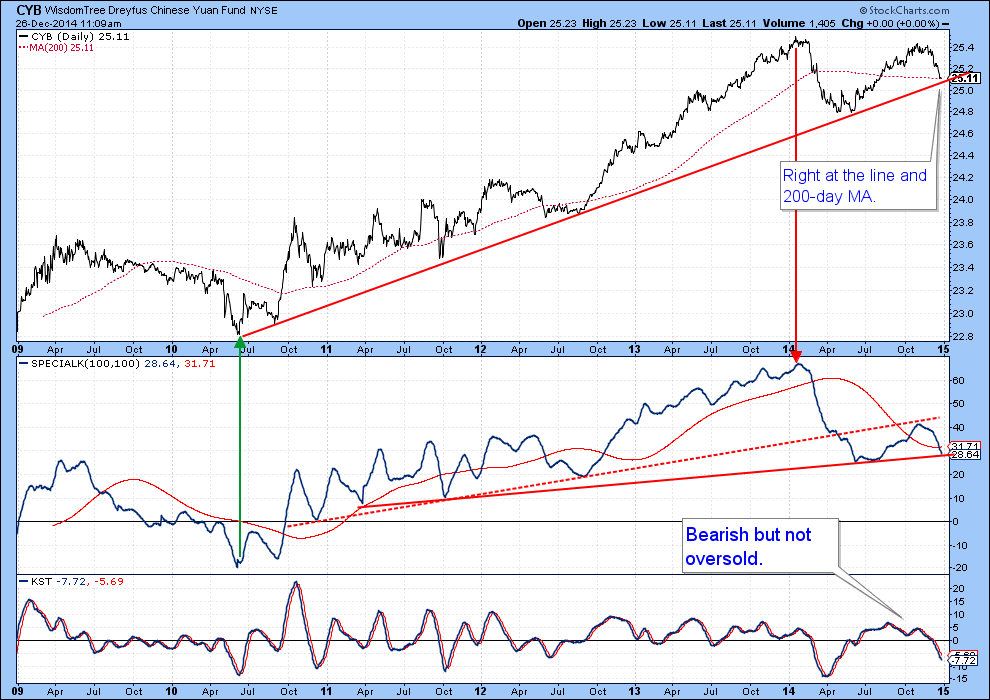
Chart 7
Turning to the shorter-term picture for the Dollar Index ($USD) itself we see a very overextended technical situation. Since short-term oriented sentiment data is almost universally bullish on the currency, contrarians would argue for a correction of some kind. Unfortunately for the bears that has been the case for the last three months and no meaningful correction has materialized. It shows the fallacy of trying to identify corrections during the early stages of a young bull market.
One thing that dollar bears are going to have to contend with in the next few weeks is that over the last 20-years January ties as the strongest month of the year along with November. This is shown in Chart 8.
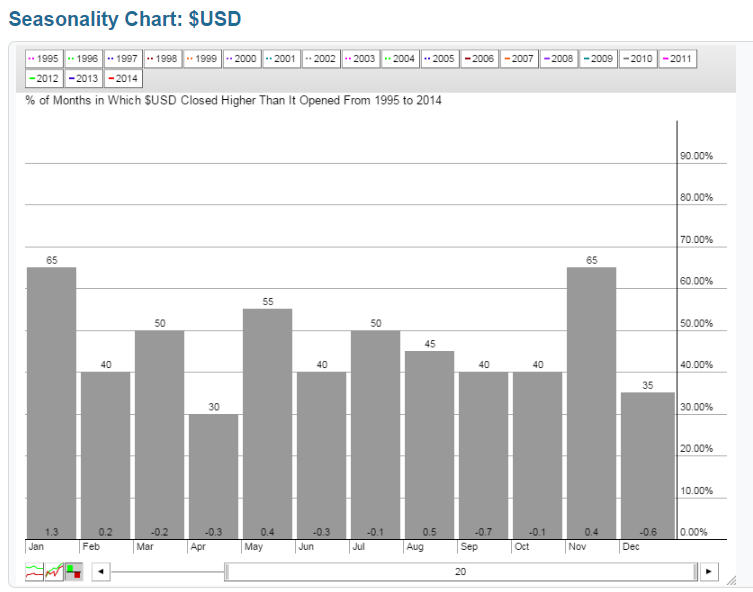
Chart 8
In addition my Dollar Diffusion indicator (!PRDIFCUR) in Chart 9 has remained in a bullish mode since the start of the current rally several months ago. In the last couple of days it has begun to accelerate to the upside. Of course, we will see a counter-cyclical correction at some point, but in the meantime some “short covering” in US dollar denominated debt held abroad could add further fuel to the rally. Correction or not, the technical odds favor a much stronger dollar in the year ahead.
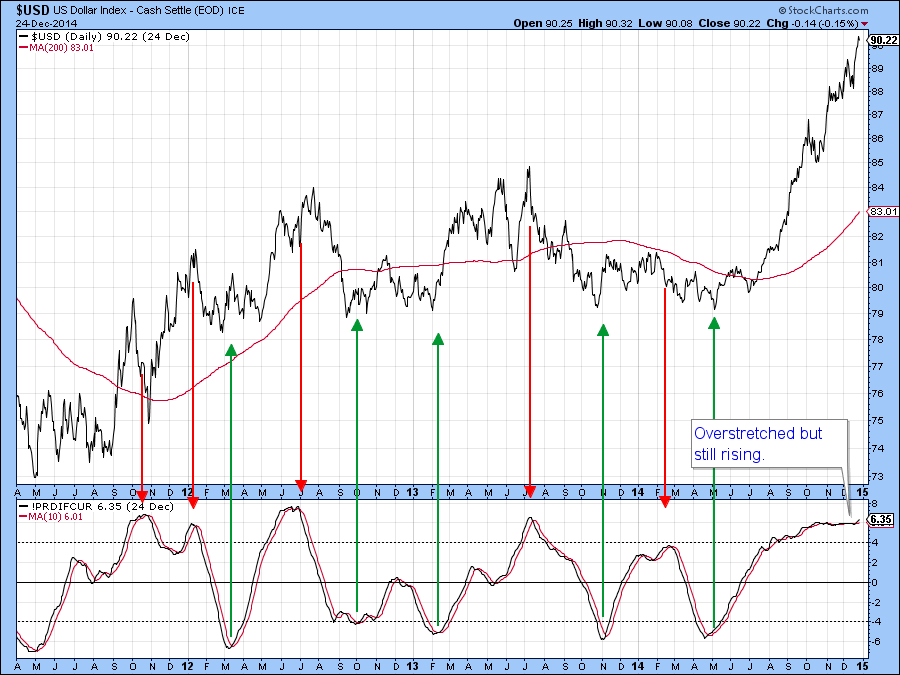
Chart 9
Good luck and good charting,
Martin Pring


