Friday's Stock Market Action Hints at Further Weakness to Come Near-term
- World Stock ETF getting closer to completing a top.
- Gold in euro and yen build on recent breakouts.
- Dollar denominated gold close to an upside breakout.
US Equities
On Friday the S & P Composite ($SPX) experienced the second day of a dark cloud cover formation, a bearish candlestick pattern. Dark clouds develop when, following an advance, a long white candle is followed by a second candle that opens above the trading range of the first and closes more than halfway down its real body. These patterns usually only have an effect for a few days, but in the current situation this bearish action could be the domino that tips the larger technical picture into a bearish mode. For example, if you look at the KST in the lower window of Chart 1 you will see that the KST is very finely balanced. It’s in a bearish mode because the indicator is below its moving average. However, price action has recently been quite flat and could easily get pushed in either direction. Friday’s weakness caused by the dark cloud cover could well result in a roll over effect .
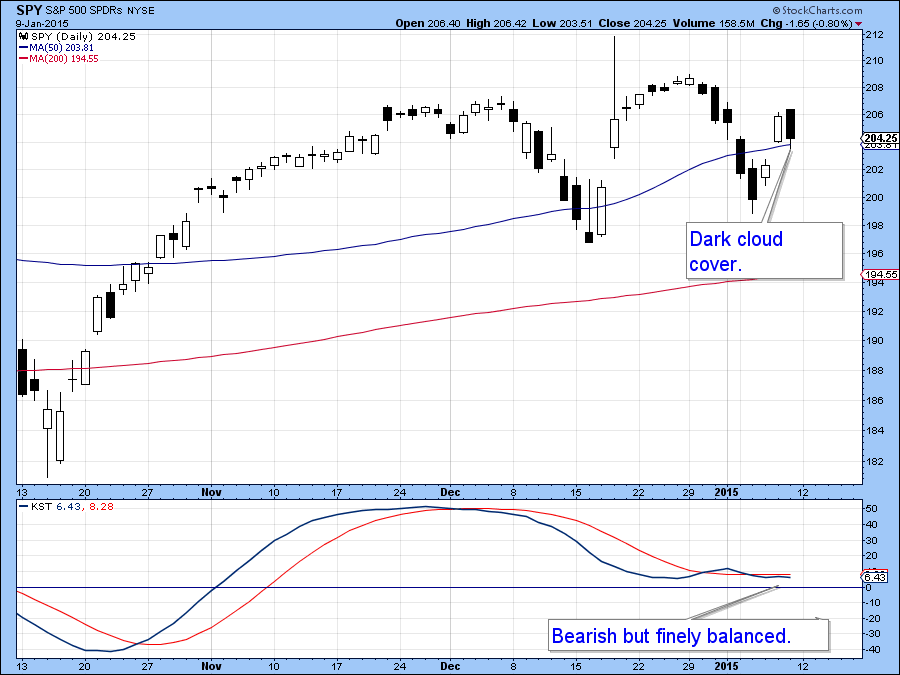
Chart 1
Friday’s bearish action showed up in different ways on different market averages. For instance, the MSCI World Stock ETF, the ACWI, experienced an outside day. That's one in which Friday’s trading range totally encompassed that of Thursday. Since the price closed very near to the low of the session it indicates a shift in the balance between buyers and sellers. In this case it's moved in favor of the sellers. Note that the Price Momentum Oscillator (PMO) is also in a bearish mode.
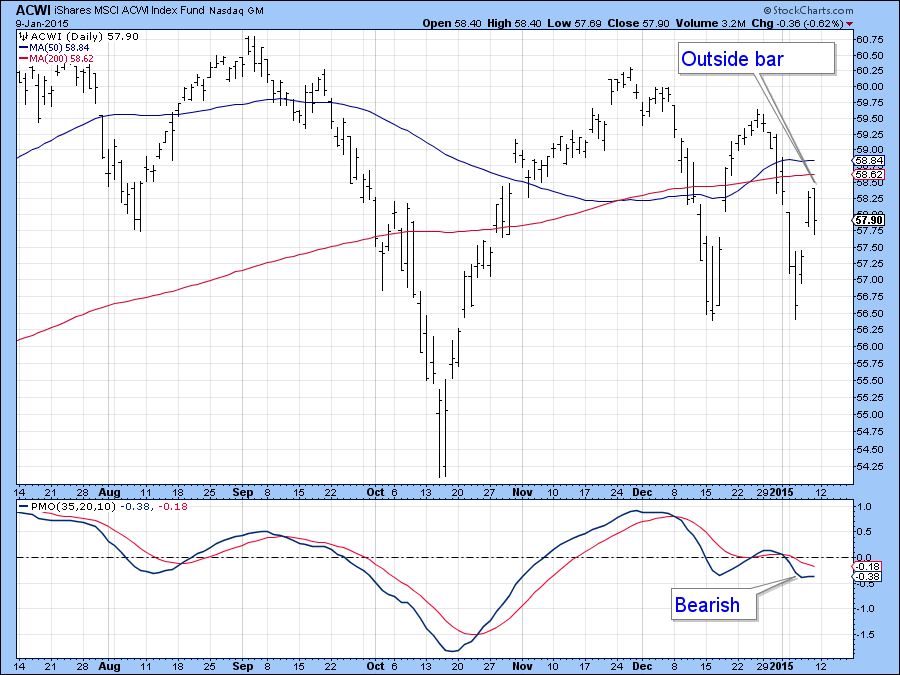
Chart 2
The World ETF (ACWI) has also experienced expanded volume on the downside. This can be seen from Chart 3, which features a candle volume plot. In this instance fluctuations in volume are reflected by the width of the candle. The wider the candle the greater the activity and vice versa. The very wide black candles therefore indicate that volume recently has been expanding on the downside as sellers have been more motivated than buyers. You can also see the complete lack of enthusiasm at the November and December peaks as the candles were very narrrow in width and lacked the conviction of wide trading ranges.
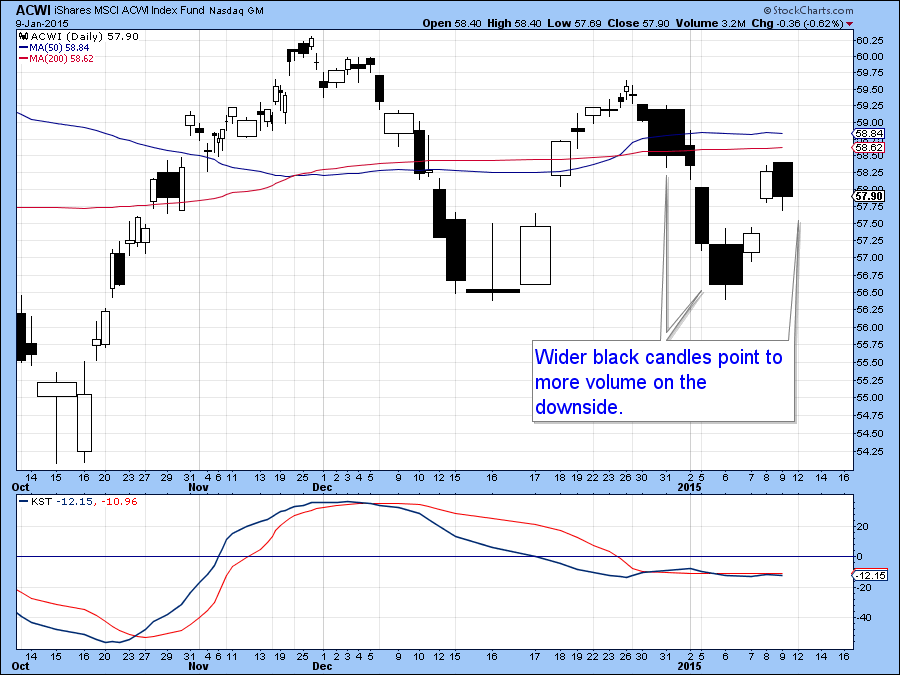
Chart 3
Chart 4 offers another variation on bearish short-term price patterns, but this time for the small-cap sector in the form of the Russell 2000 ETF, the IWM. In this case the formation is a two bar reversal. These patterns develop after a rally in which the first day opens near the low and closes near the high. The second day completely reverses this pattern by opening near its high and closing near its low. As a result, anyone who went long during this 2 day period will be going home with a loss, thereby putting downward pressure on prices as they make the painful decision of how much of a loss to take. Note also that IWM recently experienced a false upside breakout. Last week's rally took the price right back the breakout trend line, which now represents formidable resistance. Since the momentum indicator in the bottom panel is bearish I would expect to see the overhead resistance to be too strong and a challenge of recent lows. We also need to remember that these short-term patterns are not infallible and from time-to-time do fail. That would be signaled if prices take out their Thursday or Friday highs, depending on the average. However, for now their bearish short-term warnings remain.
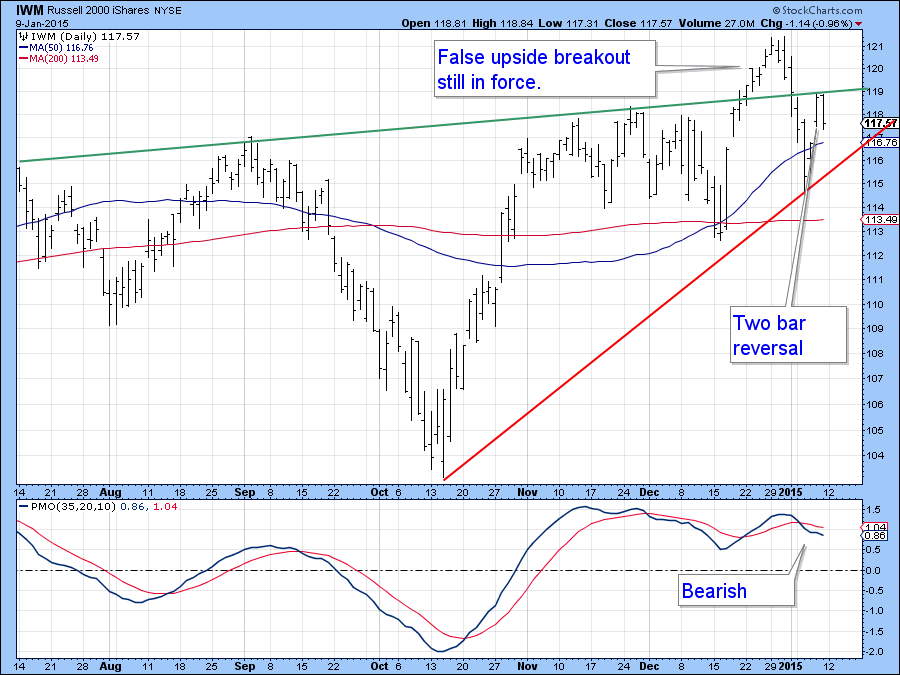
Chart 4
The immediate outcome is far more important than the short-term technical picture would have us believe and Chart 5 explains why. As you can see, the completion of a potential top in the ACWI is still a possibility and if Friday’s weak action does tip the near-term balance to the bears I would certainly expect to see a test of that potential neckline. The chart also demonstrates that the primary trend technical background is also questionable as the long-term KST is in a definite downward trajectory. Finally, its intermediate counterpart in the center panel is also declining. Thus, if I am correct about near-term weakness we will soon have all three trends involved with a negative trajectory. The breakdown point looks to be somewhere below $55 as that would take the price well below the neckline and below the very important October low.
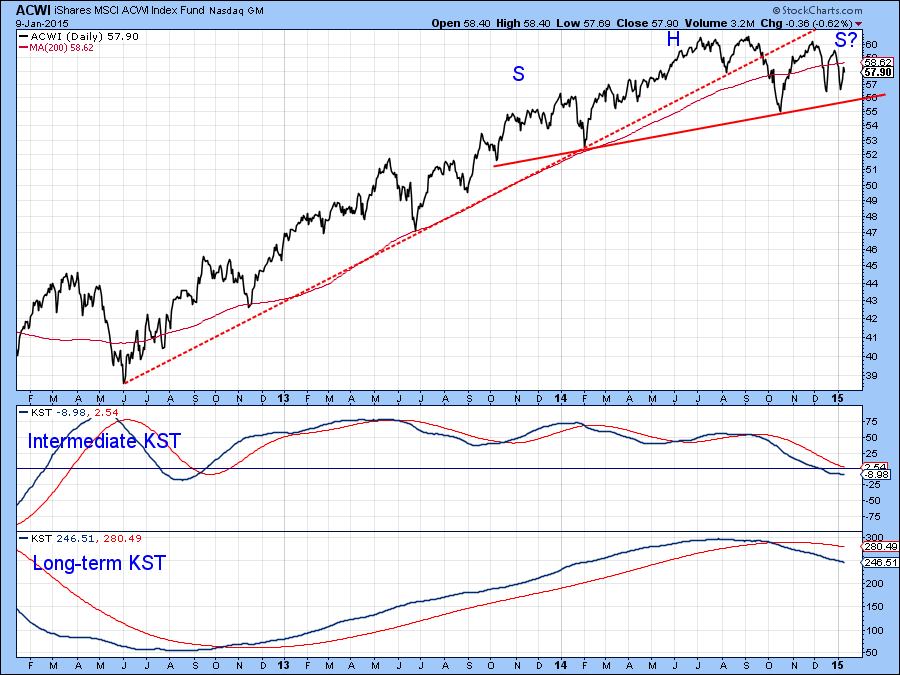
Chart 5
That’s already happened when we exclude the US, as the MSCI Europe, Australia Far East Index (EFA), effectively the rest of the world, has just broken below the neckline of a head and shoulders top. Both KSTs are in a declining mode, so a more decisive penetration of the neckline appears likely.
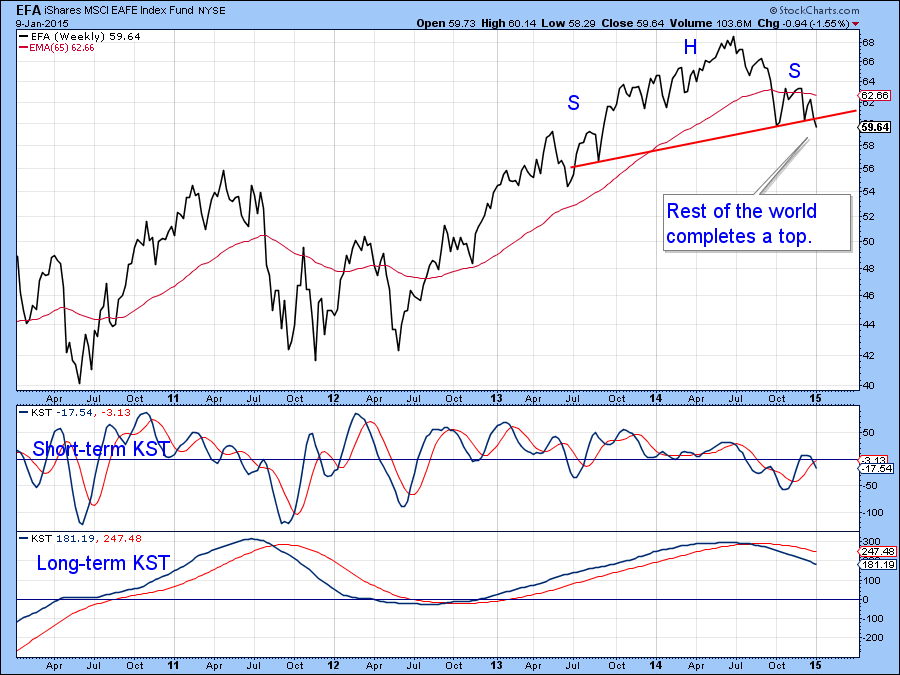
Chart 6
Gold
Last time we looked at $GOLD was a couple of issues ago. I concluded that a strong move was likely, but because the technical position was so finely balanced it was unclear which direction that move would take. Now the probabilities, and that’s all they are, are starting to favor the bulls. Chart 7 indicates that the weekly price of the Gold Trust ETF, the GLD, is very close to its 2012-2014 down trendline. It has already completed a small reverse head and shoulders and the two KSTs are rising, so there is a good chance that it will achieve an upside breakout.

Chart 7
Chart 8 shows a closer review, but on this daily chart the breakout has not yet developed. I think it will, because the price recently whipsawed below the red dashed neckline of what looked to be a bearish head and shoulder formation that was forming between November and January.
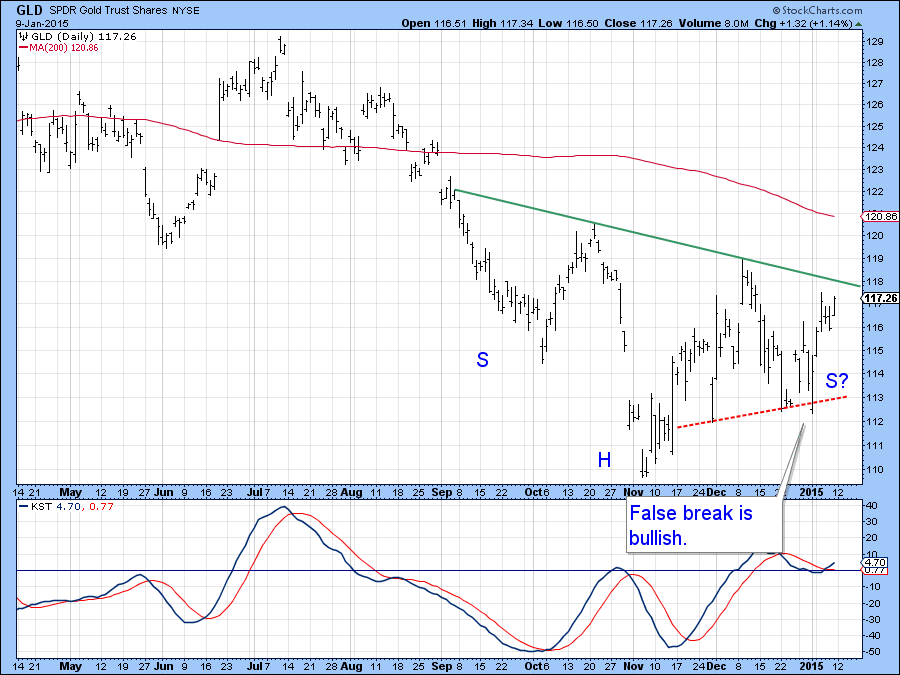
Chart 8
The price of the yellow metal looks quite favorable when the dollar is ignored. Chart 9 shows that gold expressed in both euro and yen has decisively broken to the upside. Can dollar based gold be far behind?
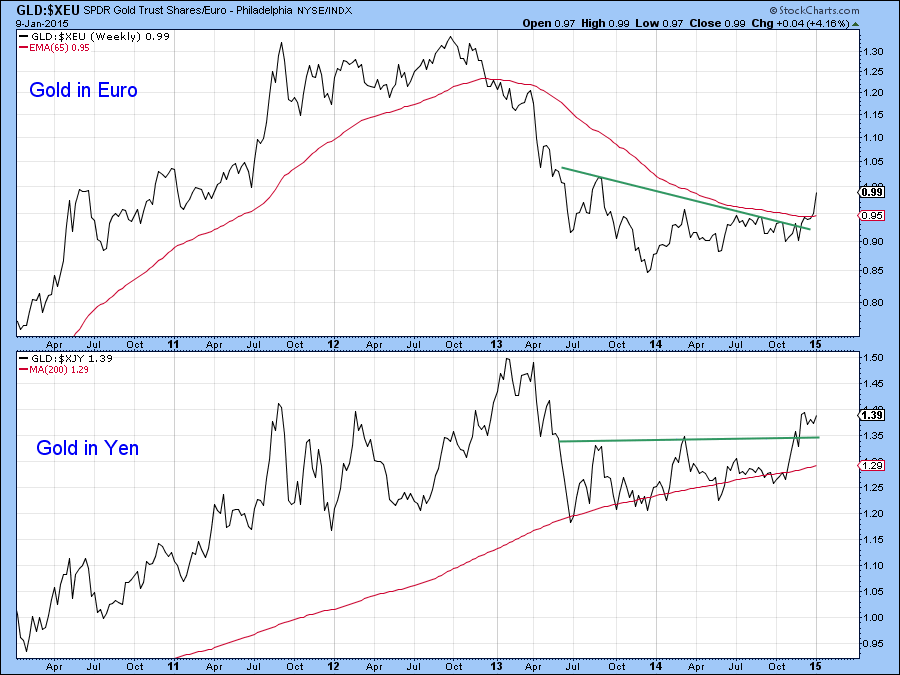
Chart 9
Finally, the ratio between gold and stocks in the form of the NYSE Composite (GLD:$NYA) is also right on a key down trendline. Both KSTs are in the early stage of a rally, so the odds strongly favor an upside breakout. That would not necessarily mean that gold itself would rise, merely that it would out-perform equities.
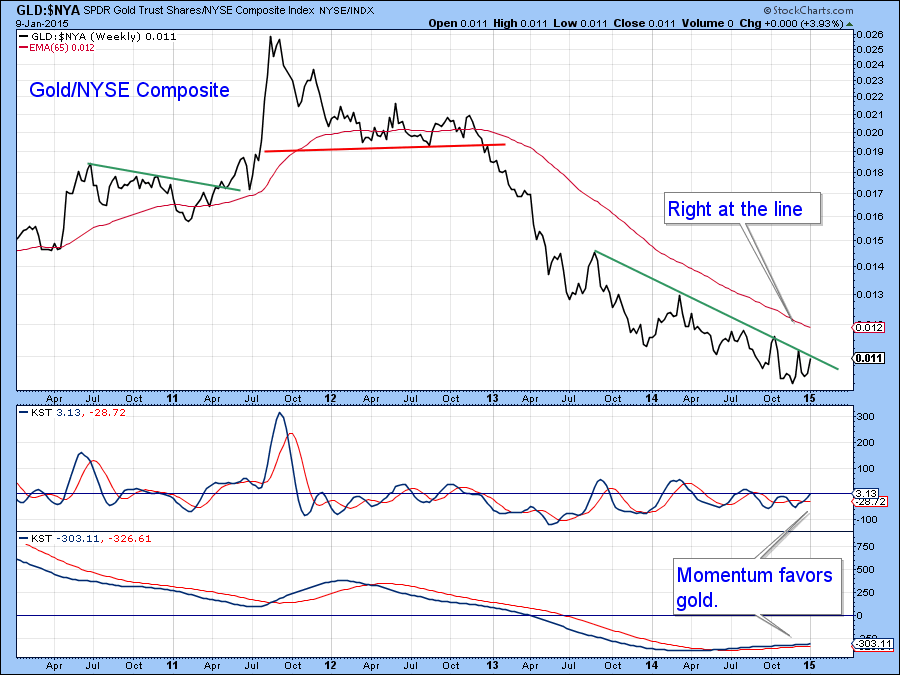
Chart 10
One stock that seems to be leading gold higher is Gold Fields (GFI). It’s shown in Chart 11, where you can see that it has broken out on both an absolute and relative basis, action which is being supported by both KSTs. I'll be reviewing some of these longer-term charts as I join Greg during his Thursday webinar. See you there!
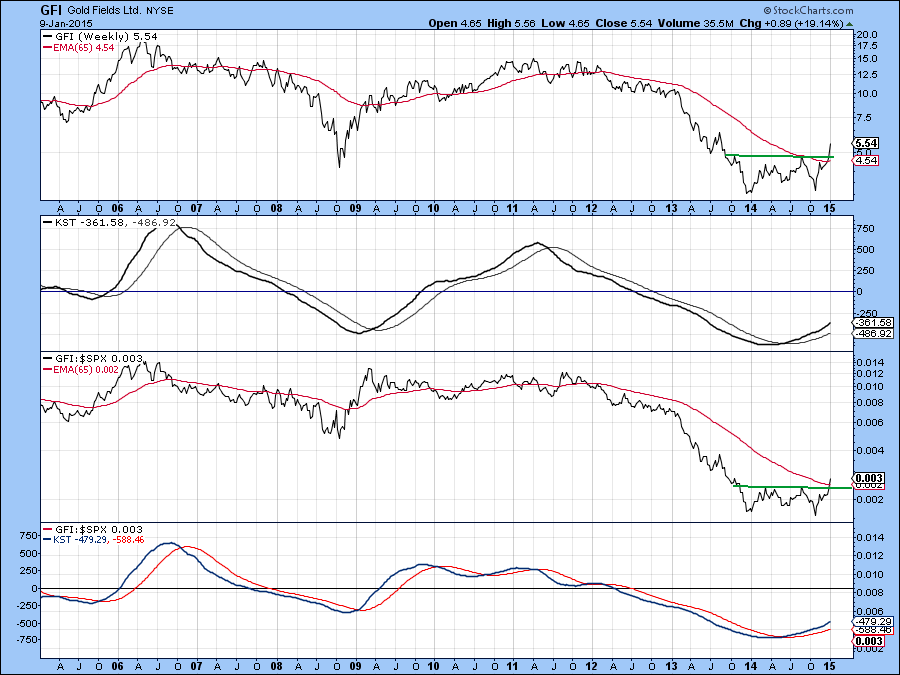
Chart 11
Good luck and good charting,
Martin Pring
The views expressed in this article are those of the author and do not necessarily reflect the position or opinion of Pring Turner Capital Group or its affiliates.


