With Recent Breakouts Lacking Strong Conviction, "Sell in May?" Could Be A Legitimate Question
- Global equities starting to get overbought.
- Dollar Index and related relationships break to new correction lows.
- Commodities tentatively break to the upside.
US Equities
From now until next Tuesday the market will be under the spell of the bullish end of the month seasonal. That condition, combined with the fact that most of the short-term momentum indicators are positive, should enable the NYSE Composite to build on its recent breakout. That’s important because May 1 begins the weak May/October seasonal and any hesitation in these short-term momentum indicators would quite possibly set us up for a false breakout going into a weak season. Given the evidence at hand I am assuming that the breakouts in the NYSE Composite and MSCI World Stock ETF, the ACWI, are valid. Nevertheless we must also be mindful of benchmarks that could be of help in identifying them as being false.
Chart 1 shows that my Dow Diffusion Indicator (!PRDIFDOW), which monitors the percentage of a basket of Dow stocks in a positive trend, is still rising. It is not particularly overstretched, so as long as it continues to advance higher prices are indicated.
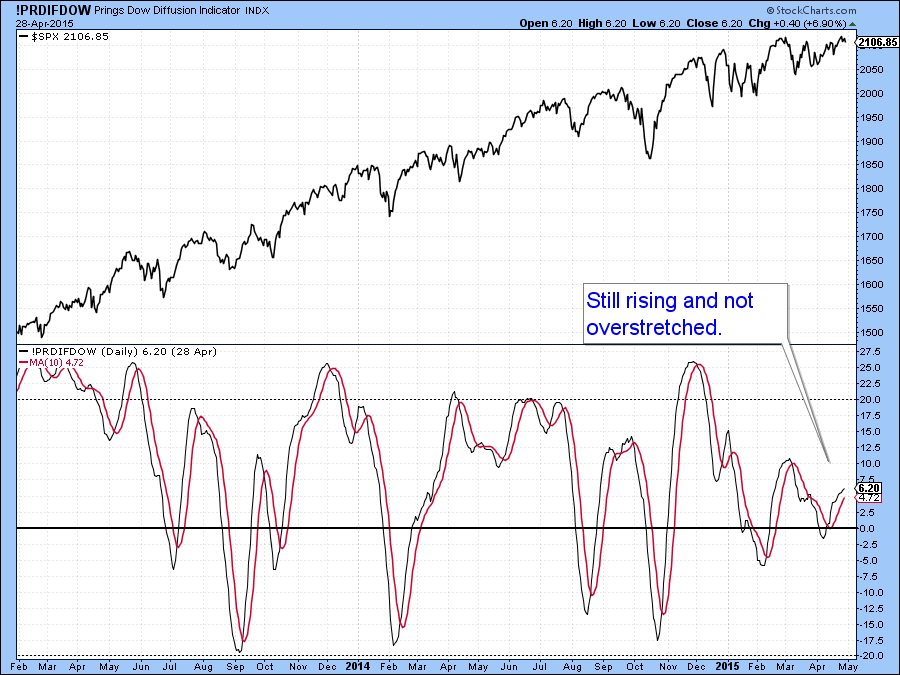
Chart 1
The same can be said for the KST for the New York Composite ($NYA) in Chart 2. It is also in a rising trend and has not yet reached its overbought level. However, it is at a sufficiently high level that were the market to experience a small hiccup that could well cause it to reverse its upward trajectory. Chart 3 shows the McClellan volume oscillator (!VMCOSINYC) model, where the 10-day EMA, the black line, looks as though it might soon drop below its (red) 20-day EMA counterpart. If it does that would increase the odds of a stumble.
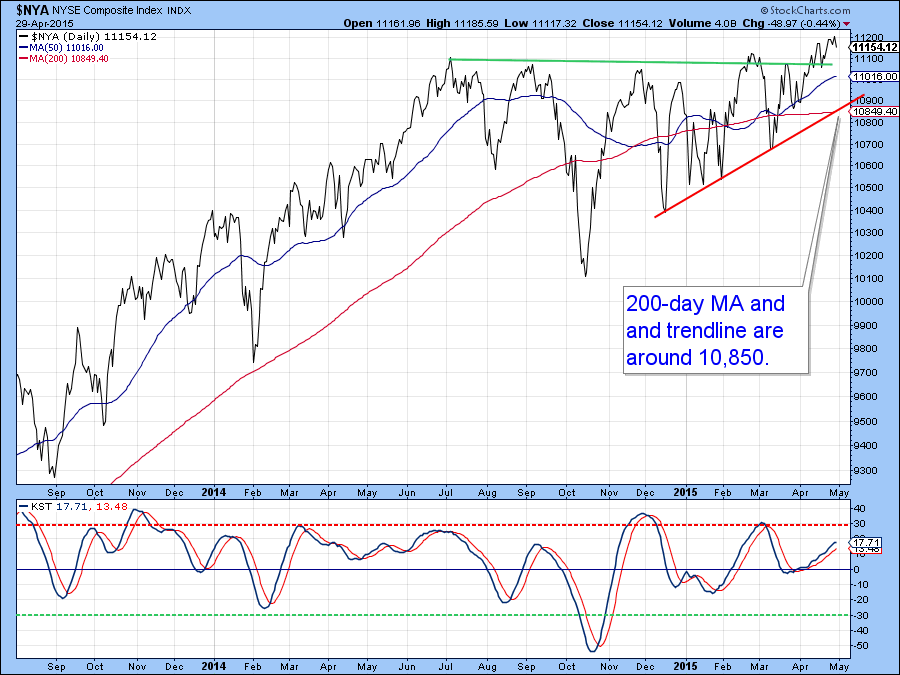
Chart 2
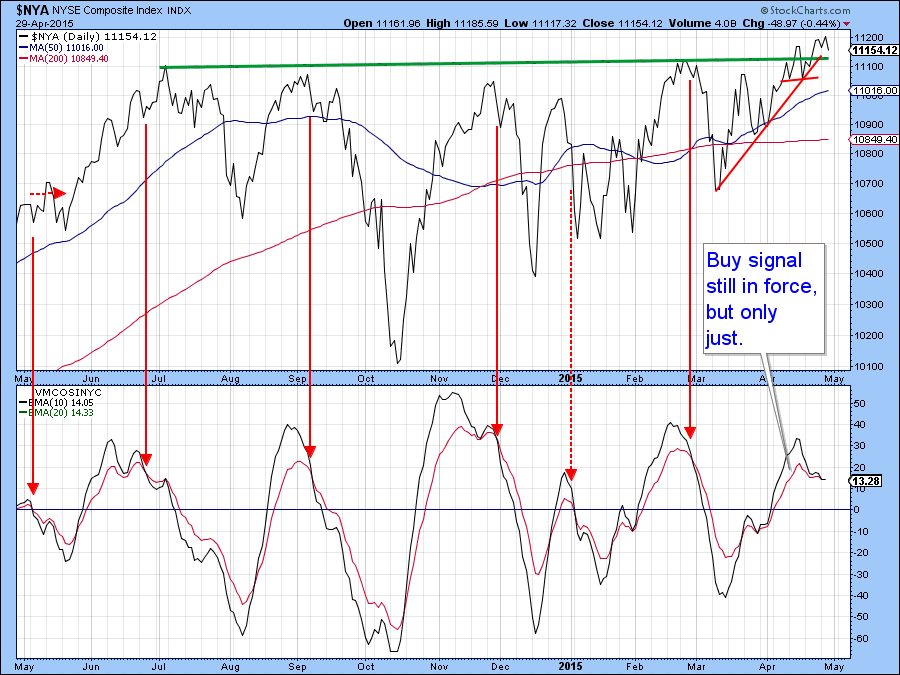
Chart 3
That’s important because Chart 4 shows that the Special K for the NYSE Composite ($NYA) is at a very crucial point. It has tentatively violated a small (green) down trendline, which is positive, but it also needs to trace out a series of higher peaks and troughs by moving above its previous peak and MA, both of which have been flagged by the ellipse. If it is unable to do so, the possibility of a red trendline violation would be quite real. Such action, would probably be combined with a breakout failure and that would not be at all positive.
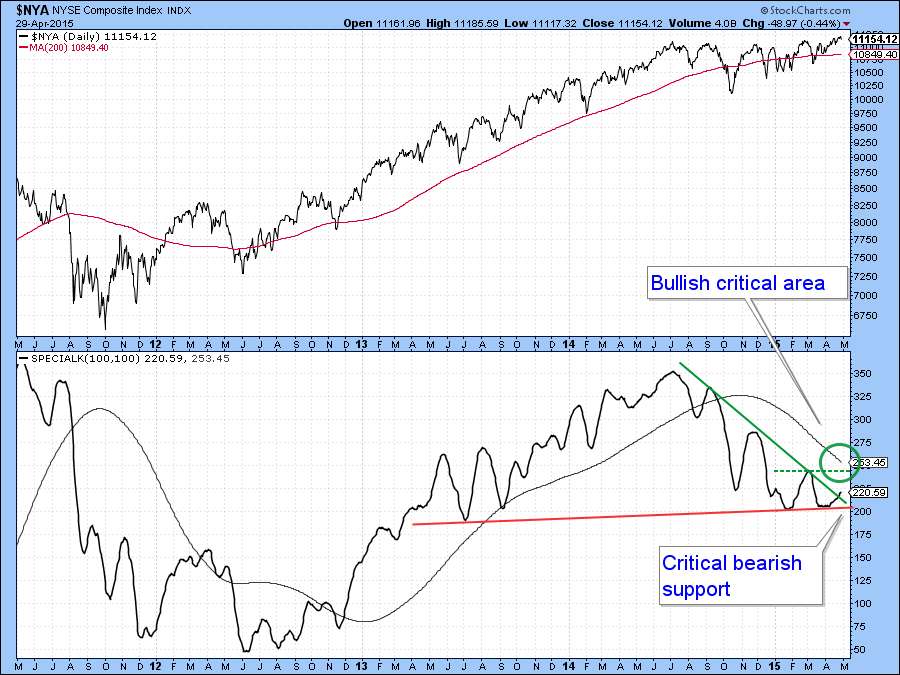
Chart 4
Global Equities
The other breakout we are monitoring is that from the MSCI World ETF, the ACWI. The price of this ETF rallied above its trading range earlier than the NYSE and experienced more in the way of upside follow through. There are two indicators that suggest that further near-term potential will be difficult to attain. The first is its KST and the second is my Global Diffusion indicator. The KST, in Chart 5, is approaching its overbought zone, a condition that turned back the previous two rallies. A falling KST by no means has to result in a false breakout but the number we would watch for in this respect would be a drop below the previous low at $60 since that would also mean a decisive violation of the solid red up trendline at $61.40.
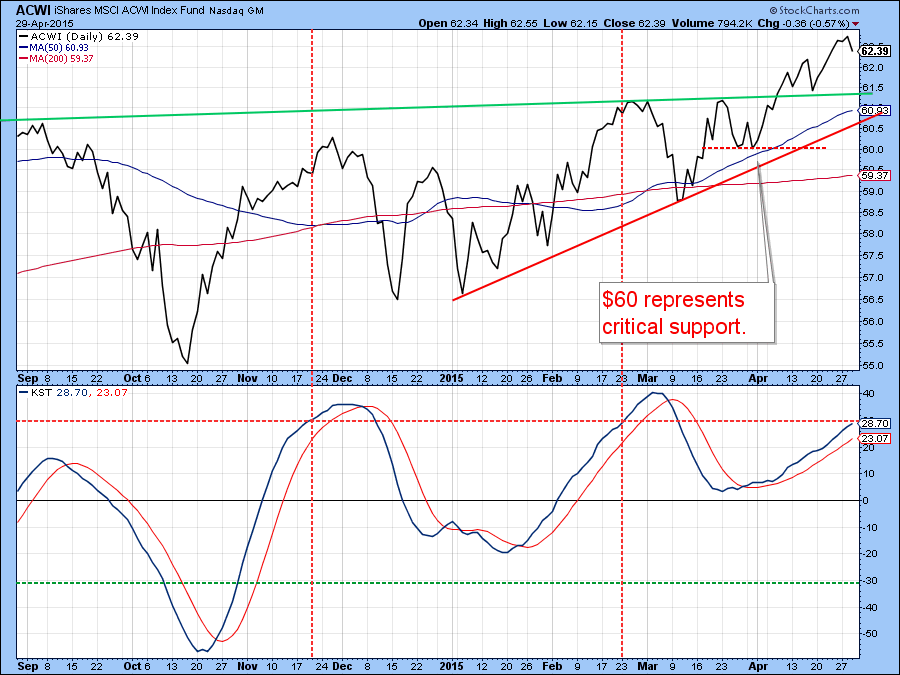
Chart 5
The second indicator to watch, is my Global Diffusion indicator (!PRDIFGLO) , a series that monitors a basket of country ETF’s in a positive trend. It’s still bullish but is right at its overbought zone. If it falls from here that would not guarantee lower prices and a false breakout but would cause me to monitor the situation a lot more closely.
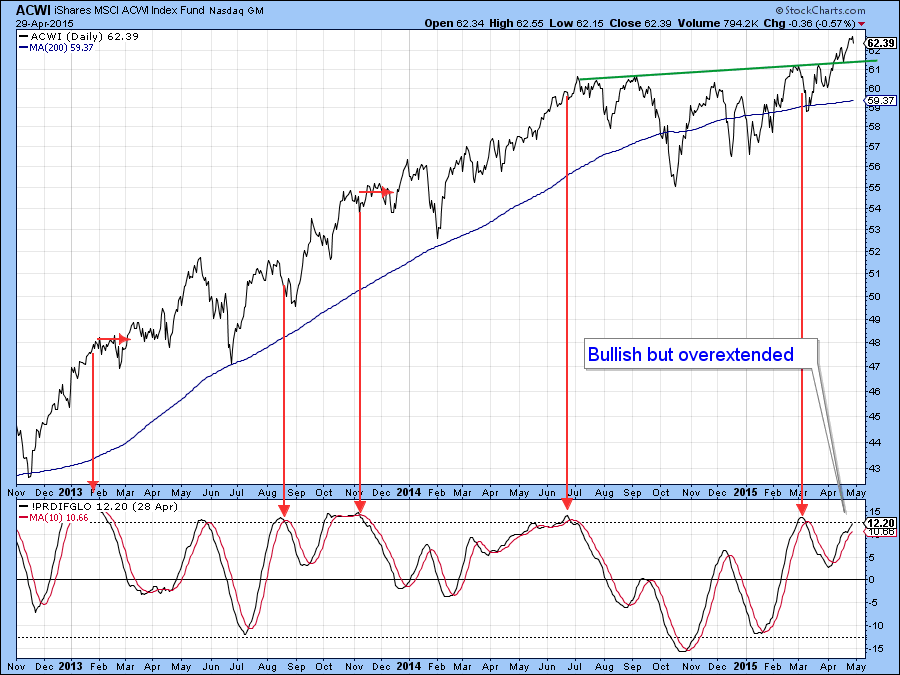
Chart 6
The Dollar
Chart 7 shows the US Dollar Index and three relationships that usually move in sympathy with it. The idea is that when all three relationships break trend and that is confirmed by the Index itself, there is a high probability that the move in the currency will prove to be a valid one. Those relationships are the ratio between US stocks and bonds versus the rest of the world and inverted commodity prices. The chart begins with all four series in a rising mode i.e. the dollar is rising and US stocks and bonds are out performing the rest of the world. In addition, commodity prices are falling. Remember the DB Commodity ETF (DBC) has been plotted inversely in order to correspond with movements in the other three series.
The first crack in the dollar’s strength came at the vertical blue line when US equities peaked against the rest of the world. Later on at the tip of the red dashed arrows, the other two relationships and the Dollar Index itself began to move lower. We are now in the situation where all three of these series have completed tops and the inversely plotted commodity ETF is right at a key support trendline. All of this suggests that the Index itself is likely to experience further downside action. You can also see that it is possible to construct (dashed green) trendlines for each series. Were they to be jointly violated on the upside we could well see a reversal in the dollar’s fortunes. Until then it’s wiser to assume that a correction, under the context of a primary bull market, is underway.
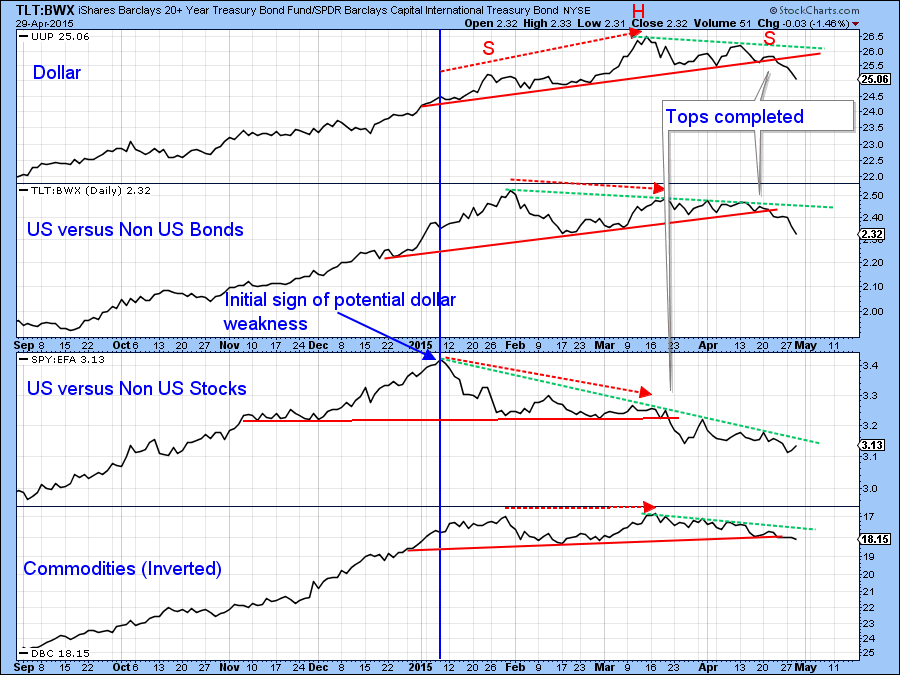
Chart 7
Commodities
Chart 8 also shows the DB Commodity ETF (DBC) being close to an upside breakout. The stock market is voting that one will take place. That’s because two ratios constructed from inflation and deflation sensitive sectors have already moved to the upside. The first is a simple ratio between the Goldman Sachs Natural Resource and the Spider Consumer Staples ETF’s (IGE/XLP). If you compare its trajectory to that of the DBC you can see they usually move closely together, so the upside breakout is an important development. The second relationship compares a group of inflation sensitive S&P Groups, such as Gold and oil shares against a defensive combination including insurance and utility stocks. It too moves closely with commodity prices and has recently broken out from a bullish broadening formation with a flat top.
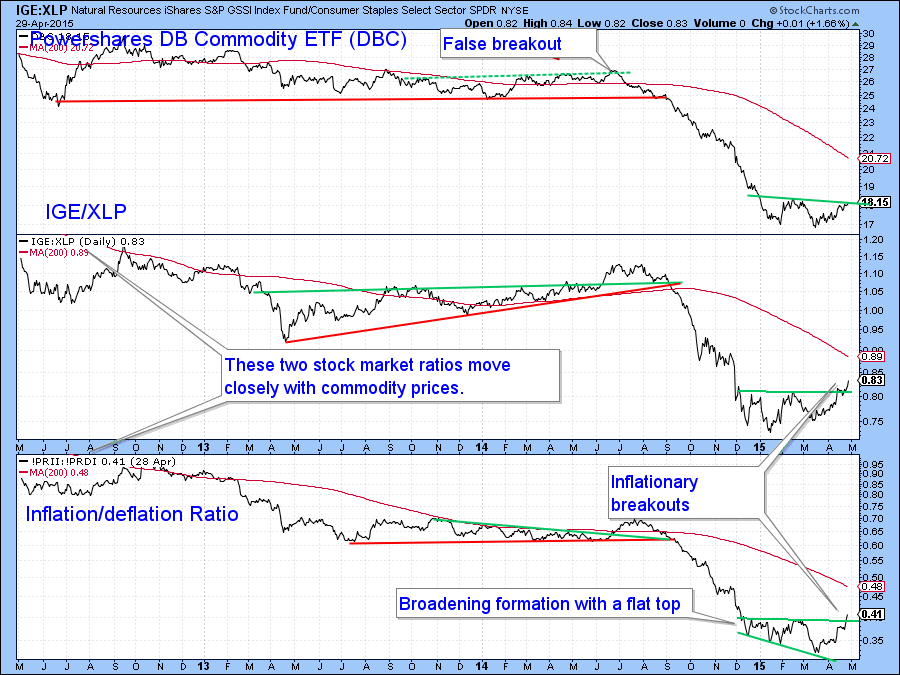
Chart 8
Chart 9 shows that the DB Commodity ETF, on an intraday basis, has tentatively broken out in sympathy with the two stock market ratios in the previous chart. The KST is in a bullish mode and certainly supports this positive action. It’s too soon to know whether commodities are in a new primary bull market or not because that evidence takes time to build up. Obviously, if they are in a bull market, current prices are very attractive. On the other hand, bear markets are notorious for experiencing false upside breakouts. I am going to assume that this breakout is valid unless or until the price violates the red up trendline and 50-day MA, both of which are in the $17.60 area. If it does break below that line that kind of action would be typical of a primary bear market.
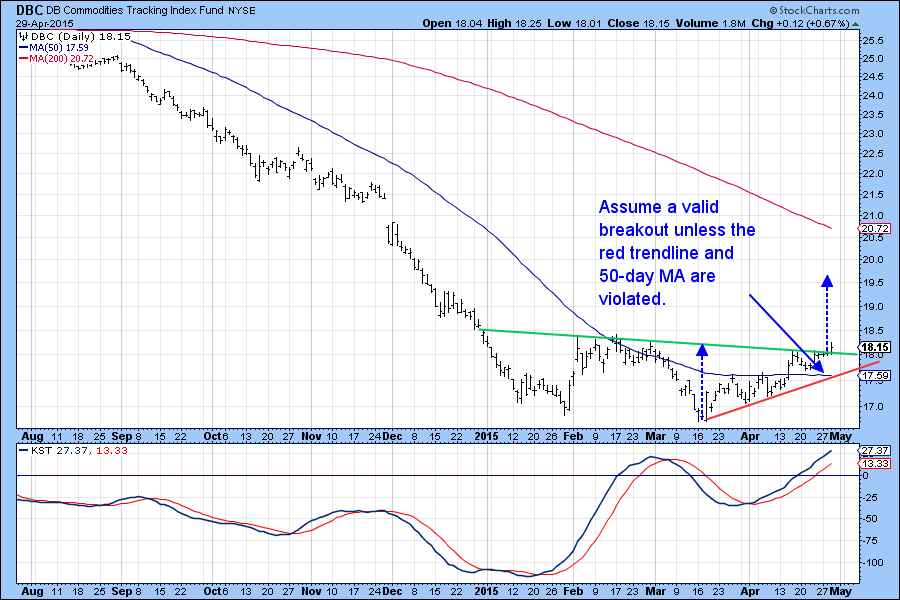
Chart 9
Good luck and good charting,
Martin Pring
The views expressed in this article are those of the author and do not necessarily reflect the position or opinion of Pring Turner Capital Group or its affiliates.


