Is The Greek Stock Market About To Collapse Or Explode?
- HYG/IEF bond confidence indicator may be peaking.
- Cyclicals and financials have the ability to break to the upside.
- Spider Metal and Mining and Materials less favored.
US Equities
The NYSE Composite ($NYA) continues to trade in a narrow range frustrating bull and bear alike. The 200-day MA often acts as a springboard following declines. In the last couple of weeks we have seen the price bounce off this average a couple of times. The level just below 10,900 has become an important one. On the one hand, a downside break would set the scene for lower prices. On the other, a rally above the potential right shoulder at 11,100 would cancel the head and shoulders, probably resulting in a KST reversal to the upside and higher prices to boot. It would also take the price back above its previous high and the blue 50-day MA, which has gone completely flat.
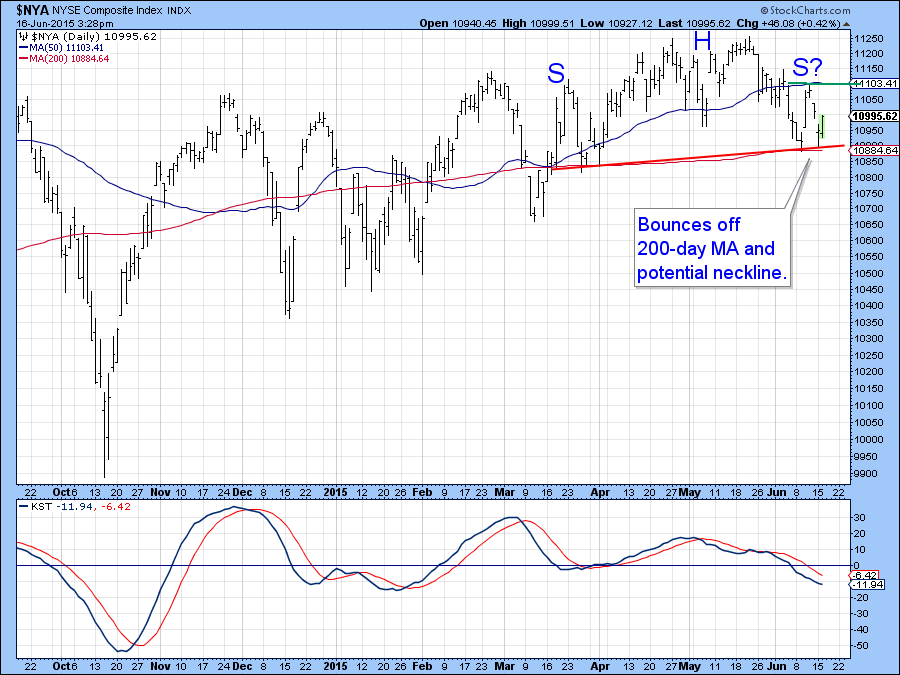
Chart 1
The complexity of the situation can be appreciated from Chart 2, which features the ratio between the iBoxx High Yield Corporate ETF, the HYG, to the Barclays 7-10 year Trust, the IEF. Normally this ratio moves up and down with equity prices as bond traders alternate between gaining confidence, as they bid up risky high yield bonds, and losing it by rushing to higher quality government paper. A major negative divergence set in last year as the ratio sold off and the market moved on to new highs. At the beginning of this year confidence in the bond market returned as the ratio rallied sharply. This renewed optimism should have spilled over to equities, but so far it has not. Now this relationship looks as if it might be in the process of peaking again. This view is based on the fact that it recently experienced a false breakout above the green trend line and this false breakout has now been confirmed by a violation in the red 2015 up trend line. As a result it now stands at its 200-day MA, which, given the downside re-acceleration of the KST, suggests the likelihood of a negative MA crossover. Given the linkage between movements in this credit spread and equities that would not be a good sign.
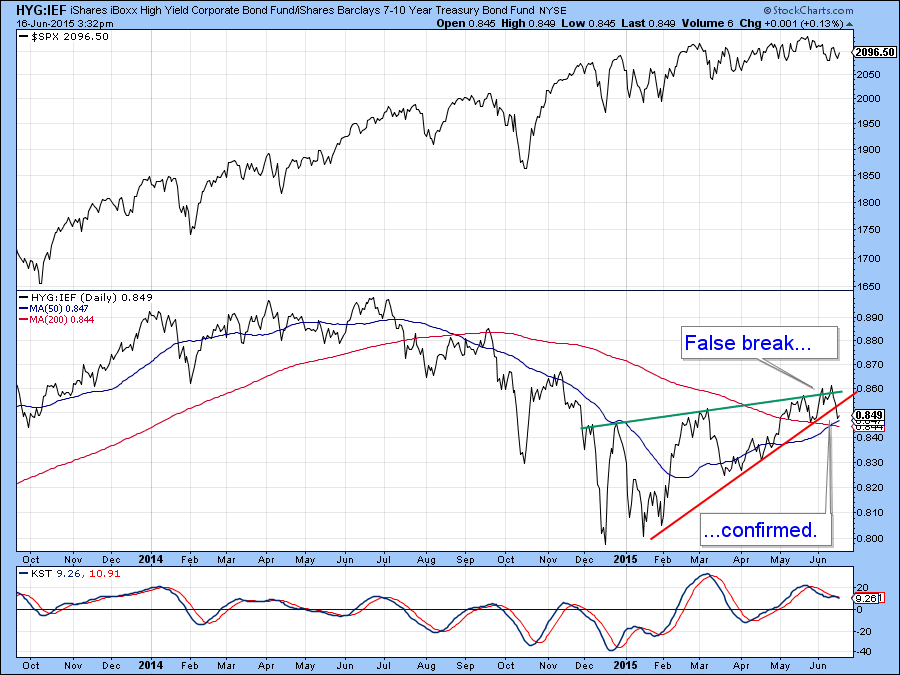
Chart 2
Sectors – potential upside leaders
If the market does break to the upside we would look for recent leaders to extend their favorable trend of relative action. By way of example, the Dow Jones Financials in Chart 3 looks set to break to the upside as the KST is in a positive trend and the price itself is within a whisker of a breakout.
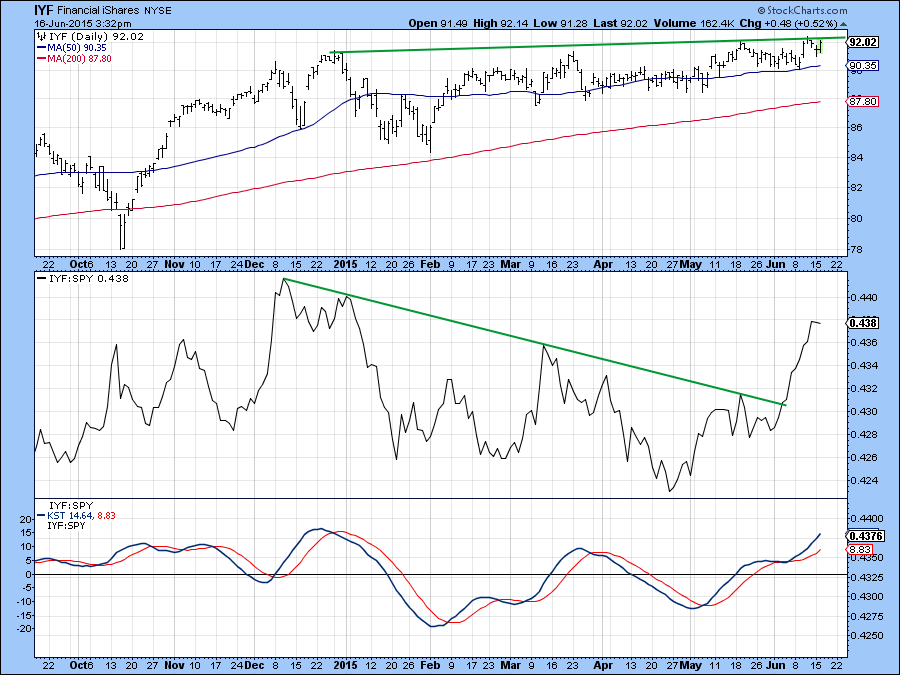
Chart 3
Moreover, several financial sub-groups have already achieved breakout status, some of which are featured in Chart 4. Particularly noteworthy is the fact that one of these leaders is the Dow Jones Brokerage ETF, an industry group that often leads the market both up and down.
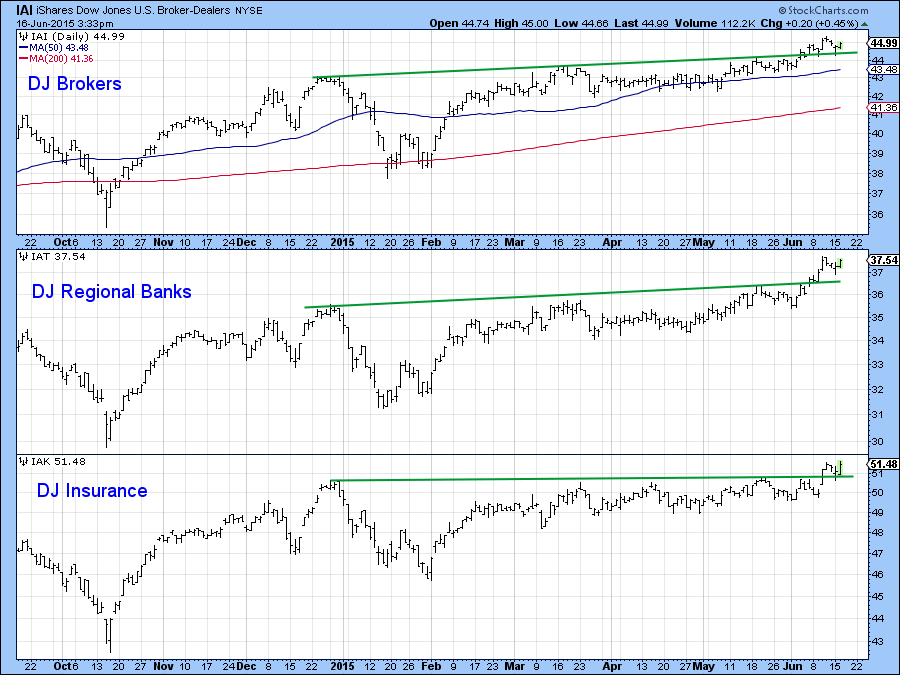
Chart 4
A second interesting sector is consumer durables or cyclicals. Chart 5 shows the Spider Consumer Cyclicals (XLY). The price is still caught below its resistance trend line. Quite a few of the components have already broken to the upside so that is encouraging for the sector as a whole. Several of these are already overextended.
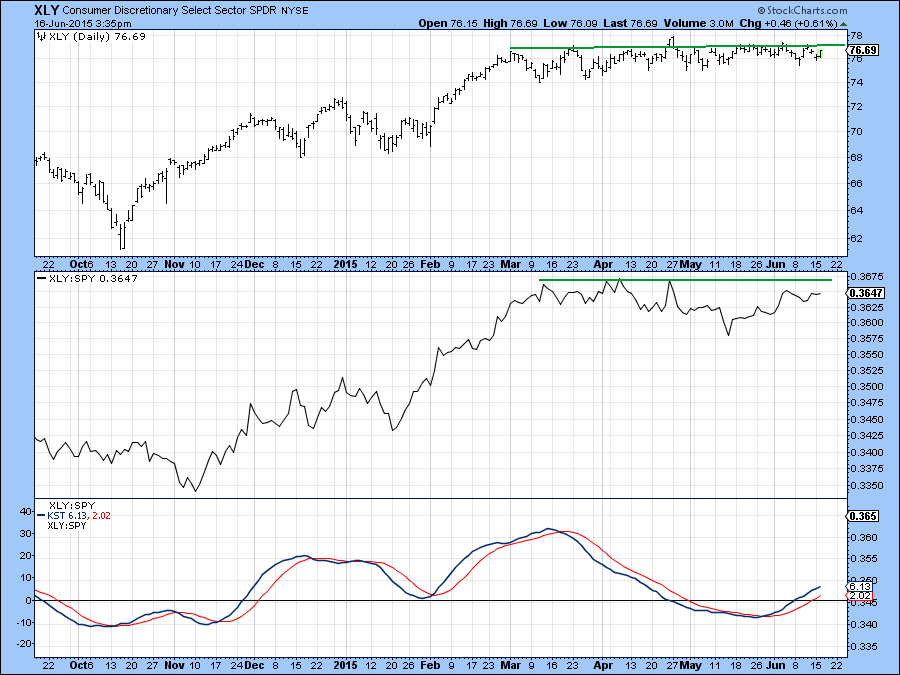
Chart 5
The Dow Jones Footwear Index ($DJUSFT) is one that has just broken out on a relative strength basis (Chart 6) which makes it interesting now.
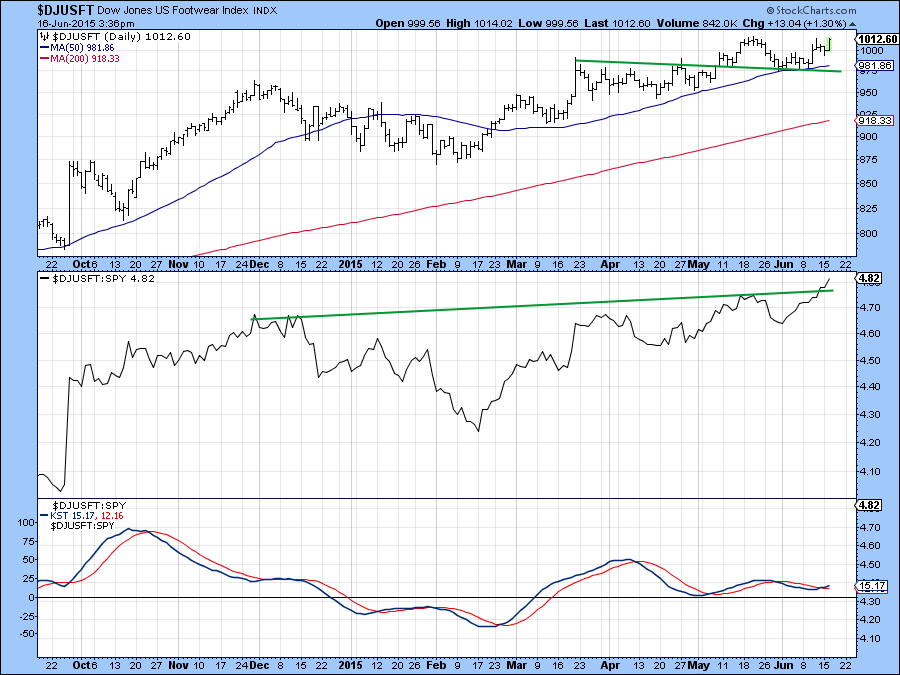
Chart 6
Sectors- Potential downside leaders
If the market decides to break to the downside, the weaker sectors are likely to take their cue from earnings driven areas such as mining. In this respect Chart 7 features the Spider Metal and Mining ETF, the XME. This series has just violated a 3-month support trend line on both an absolute and relative basis. Materials in the form of the Spider Basic Industry (XLB) have also broken a couple of support trend lines with a slightly declining KST as shown in Chart 8.
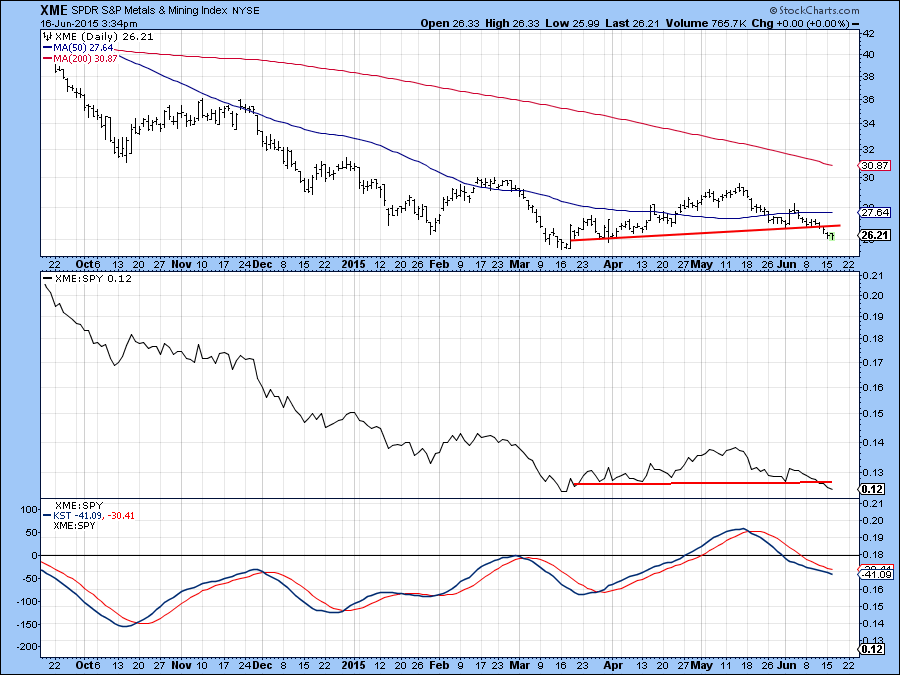
Chart 7
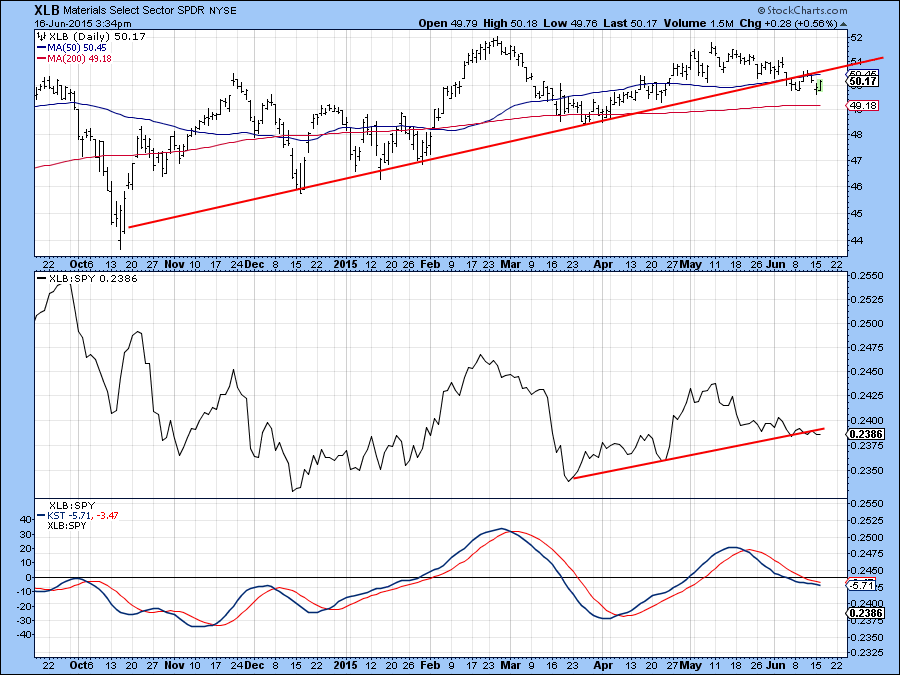
Chart 8
Greece
The Greeks may be misbehaving with financial matters but the Athens General Share Index ($ATG) has been steadfastly and consistently behaving when it comes to 12-month MA crossovers. Indeed, there have only been two whipsaw signals in the last 17-years, which are shown in 2009 and 1998. I raise the question because the so called Grexit crisis appears to be coming to a head and the Athens SE Index is approaching its 2012 low in what may turn out to be a double bottom formation. That view is purely speculative right now, especially with the long-term KST declining, but this level can hardly be termed as oversold.
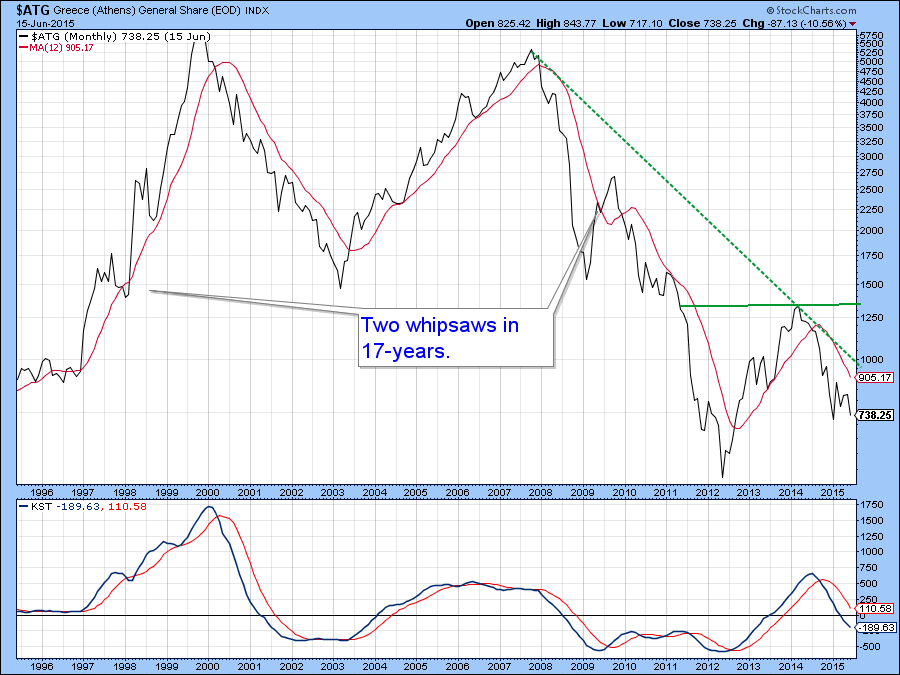
Chart 9
Chart 10 shows that joint trendline violations between the price and its Special K (SPK) have offered reliable signals of important trend changes on the Greek market ($ATG) in the past. Right now both the price and the SPK are below down trend lines offering us a potential buy signal if this turns soon.
A big test is coming because the Index is fast approaching the neckline of a potential head and shoulder consolidation formation.
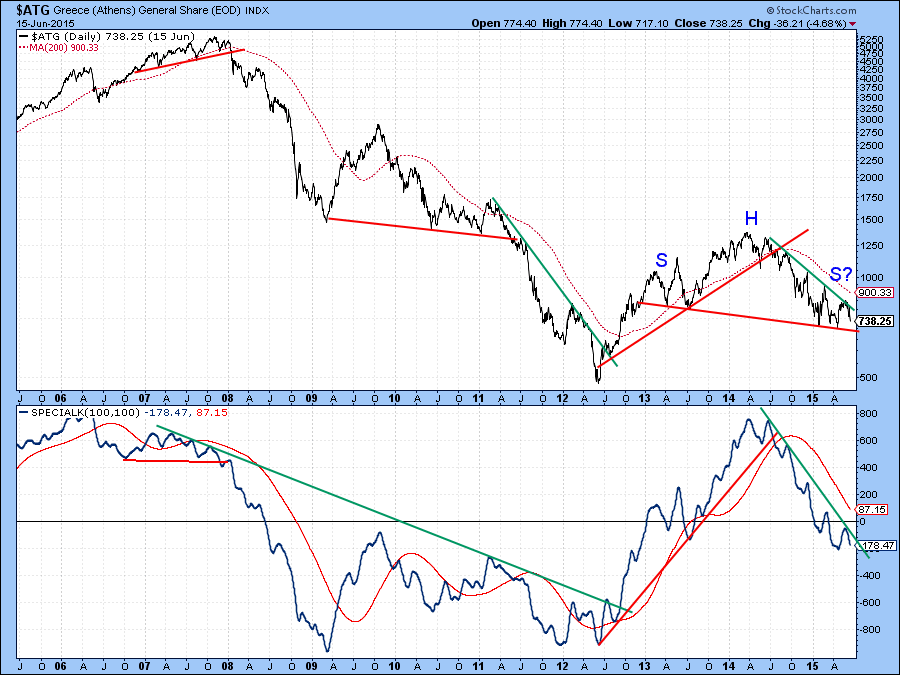
Chart 10
Chart 11 shows the same indicators but in more recent detail. I have also plotted the daily KST in the bottom panel. Currently it is a declining trend but cannot be described as oversold. That offers further support to the idea that a test of that head and shoulders neckline just below 700 is in the cards.
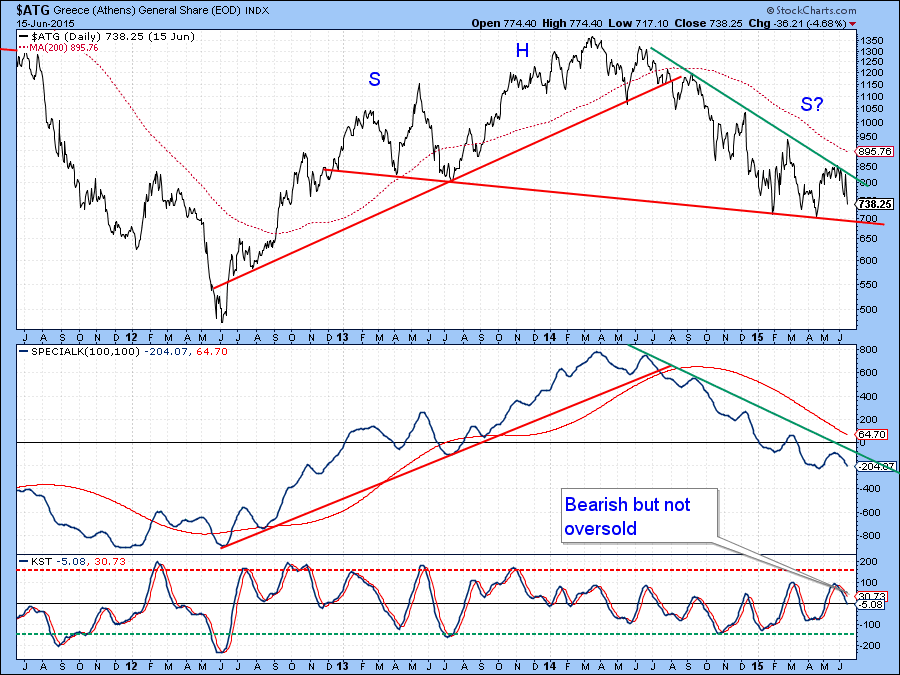
Chart 11
Chart 12 shows the FTSE Greek 20 ETF (GREK). It’s clearly in a downtrend. However, we cannot rule out the possibility that it is in the process of forming a bullish inverse head and shoulders pattern. That would require a break above the neckline around $13, whereas a move in the immediate future below the recent low (the head) would invalidate such a scenario.
My point here is to say that the Greek market, whether expressed in euros or dollars as per the ETF, remains in a downtrend. Nevertheless, the potential for a turnaround does exist if the right things happen. Technically that would involve a move above the 12-month MA (not shown) on Chart 11 above, as the monthly MA crossover has been a reasonably reliable signal over the last couple of decades. Such action would also result in the violation of some key down trendlines and likely, one for the Special K. The 12 period monthly MA is currently at 905, about 20% above recent levels. That might seem a lot, but with 5%+ daily swings not uncommon that could happen very quickly, either given some good news or the market’s favorable reaction to bad news. In the meantime I am assuming that the trend remains negative because the Greek market is not oversold on either a short or long-term basis.
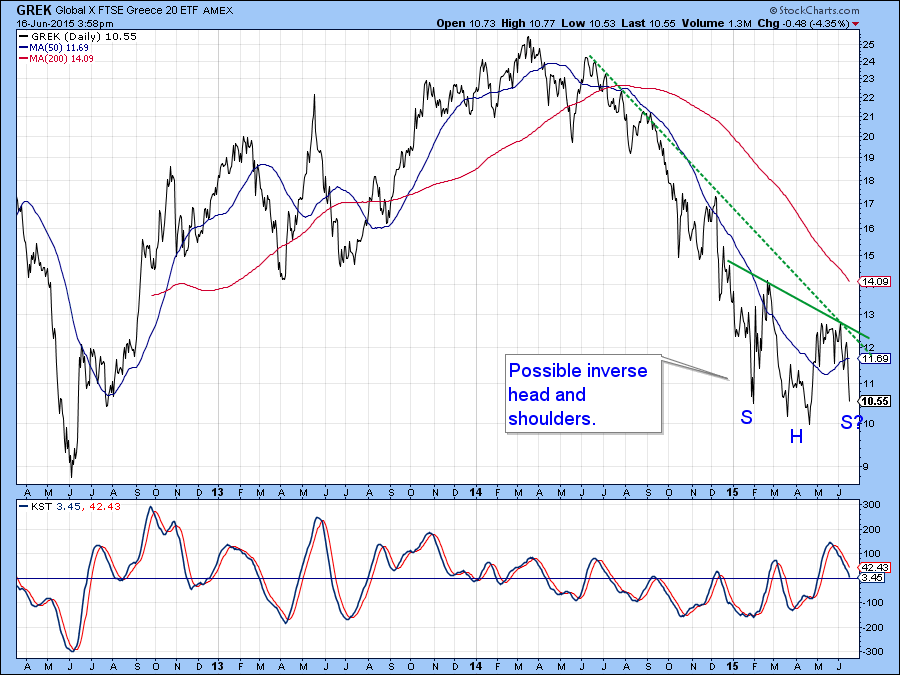
Chart 12
Good luck and good charting,
Martin J. Pring
The views expressed in this article are those of the author and do not necessarily reflect the position or opinion of Pring Turner Capital Group or its affiliates.


