Oversold Short-term Indicators Suggest Another Attempt At New Highs Is In The Cards
- Pring Dow Diffusion indicator triggers a tentative buy signal.
- Net new high bond indicator is deeply oversold.
- Aussie and Canadian dollars experience bullish KST.
US Stocks
Action this week has been somewhat disappointing since several averages and sectors experienced reversal characteristics on Tuesday. This suggests that, over the next few sessions, the market needs to regain some composure if it is to move higher. Chart 1, for instance, shows that the NYSE Composite ($NYA) once again failed to rally above its green breakout trendline and the extended red up trendline. The McClellan Volume Oscillator (!VMCOSINYC) continues positive since the (black) 10-day EMA remains above its (red) 20-day counterpart.
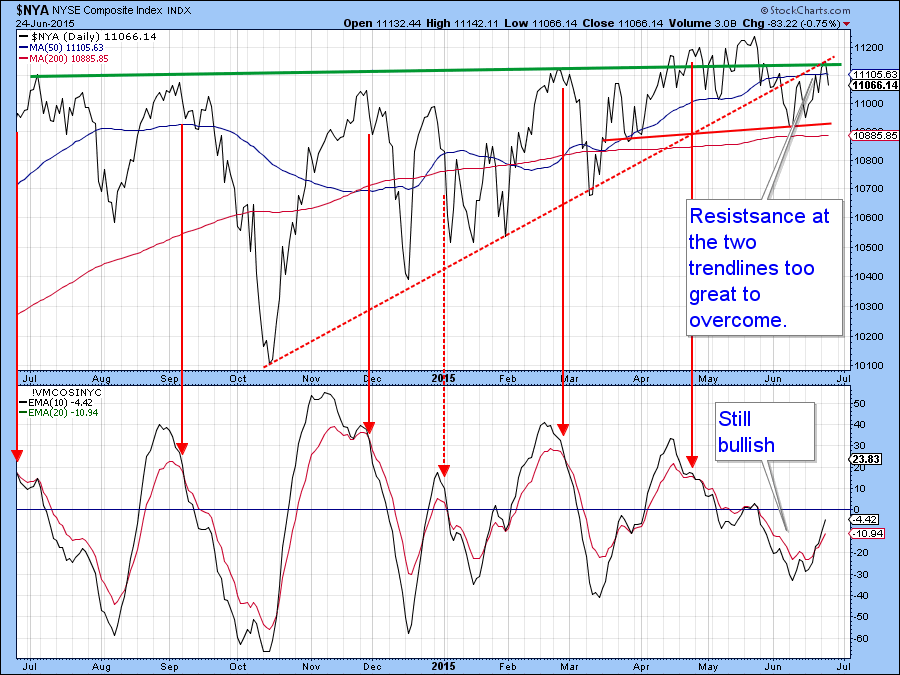
Chart 1
Chart 2 plots the NYSE Composite ($NYA) using bars and we a failed breakout on Tuesday. The situation is very finely balanced, for while the KST is bullish it has started to hesitate a bit, which means that a dose of higher prices is needed to re-assert the uptrend.
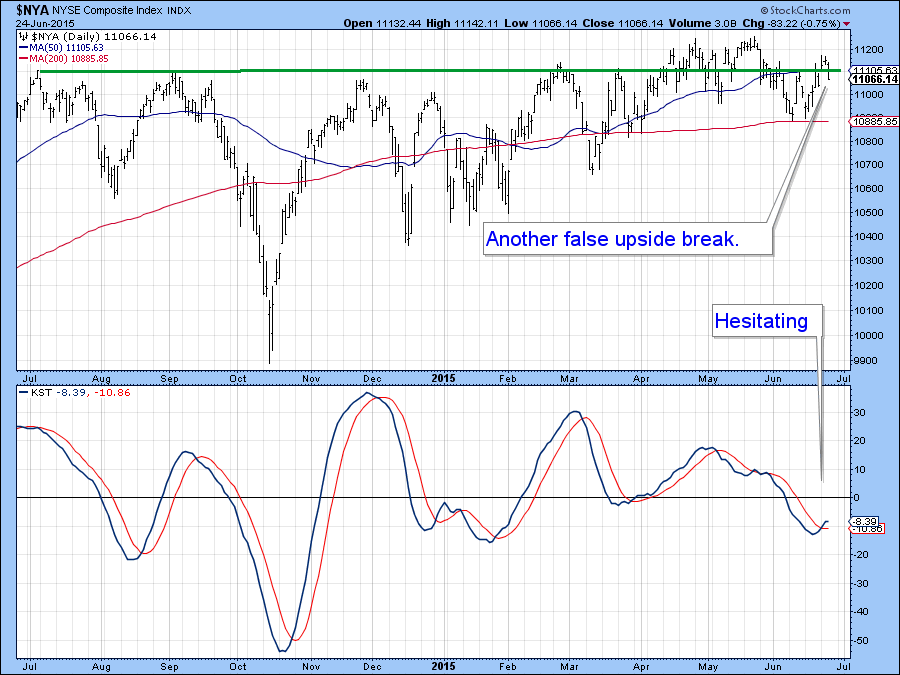
Chart 2
Nevertheless many, most short-term momentum indicators, like those in Chart 1 continue to move in a manner that is consistent with near-term strength. My Dow Diffusion indicator (!PRDIFDOW) in Chart 3, for instance, is not only oversold, but has started to reverse to the upside in a manner that is consistent with a rally.
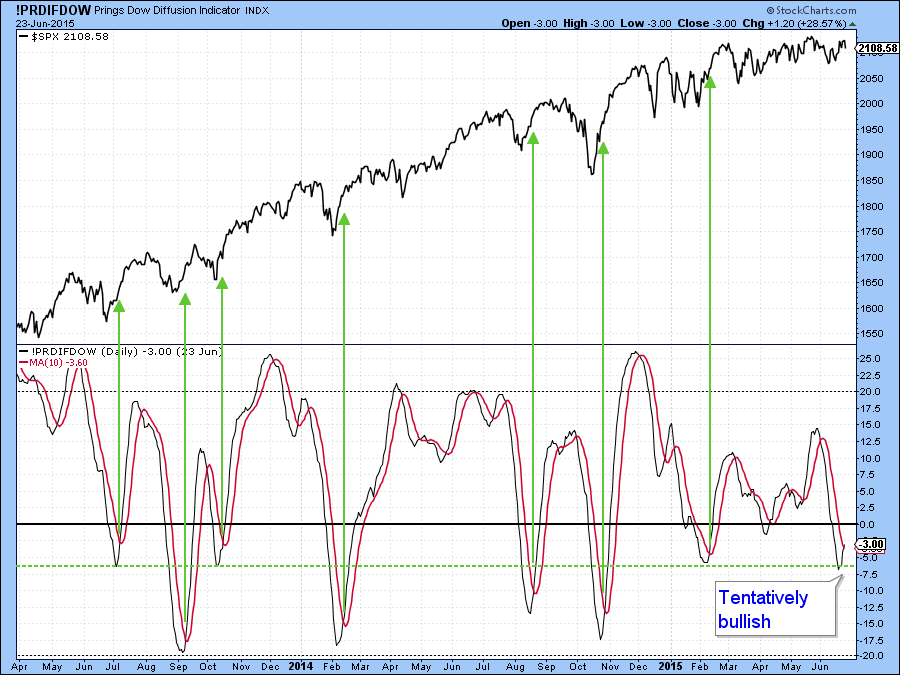
Chart 3
The Bottom Fisher (!PRBFISH), in Chart 4, has also started to turn up. Unfortunately it did not reverse from the “fishing zone” at or below the green line, from which the best rallies appear to develop. However, reversals from moderately low levels such as that attained this week are usually followed by an advance of some kind.
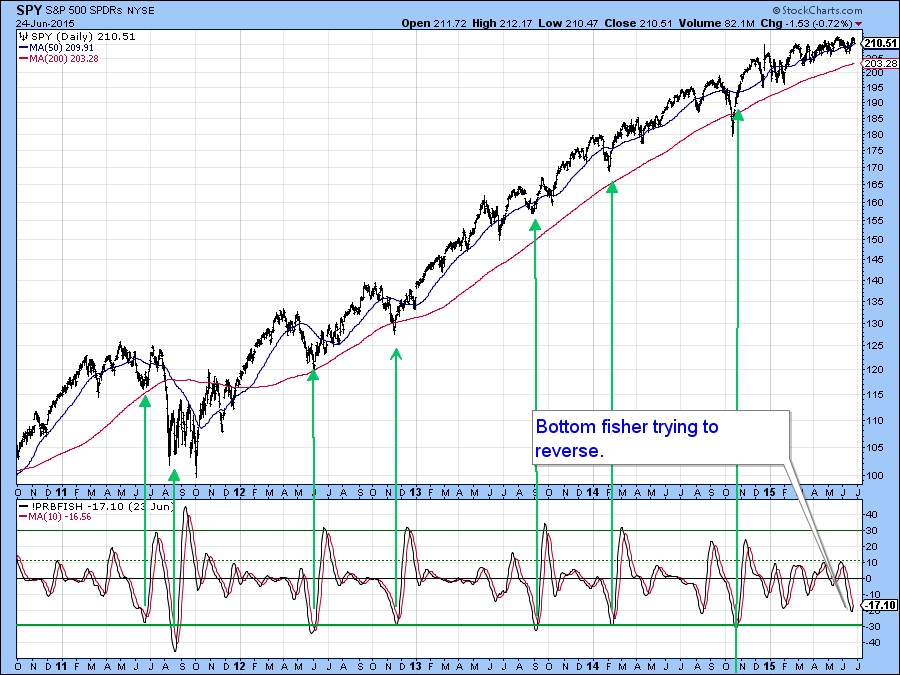
Chart 4
New high ($NYHL) data has also been expanding this week, as you can see from the lower panel in Chart 5. The numbers are certainly not as high as they were earlier in the year. However, from a short-term trend point of view the break above the trendline does suggest that the number of net new highs will continue to expand going forward.
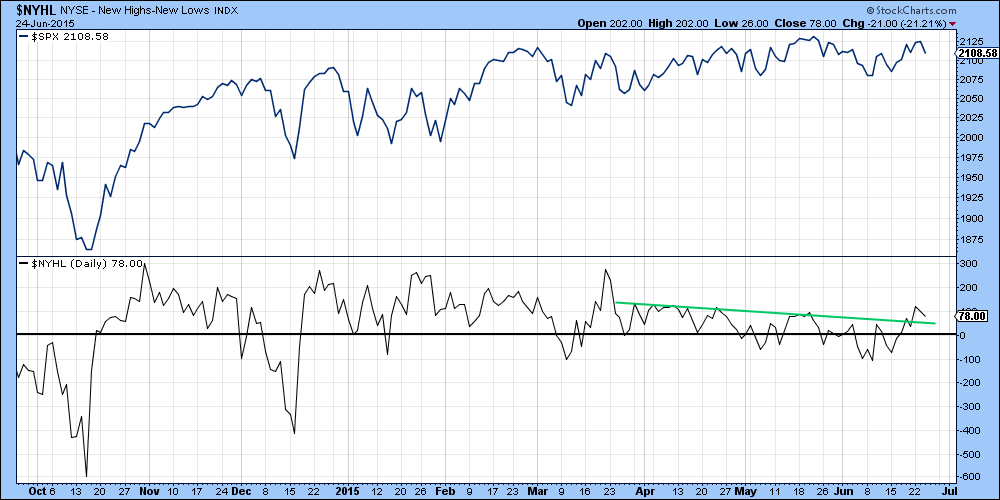
Chart 5
Chart 6 features the new high ($NYHL) data in a cumulative format. This indicator goes bullish and bearish for the overall market when it crosses above and below its 50-day MA. Buy and sell signals using this approach have been flagged with the arrows. The chart also shows that the indicator recently came pretty close to a sell signal. Now though, it is accelerating away from a sell signal, clearly a positive sign.
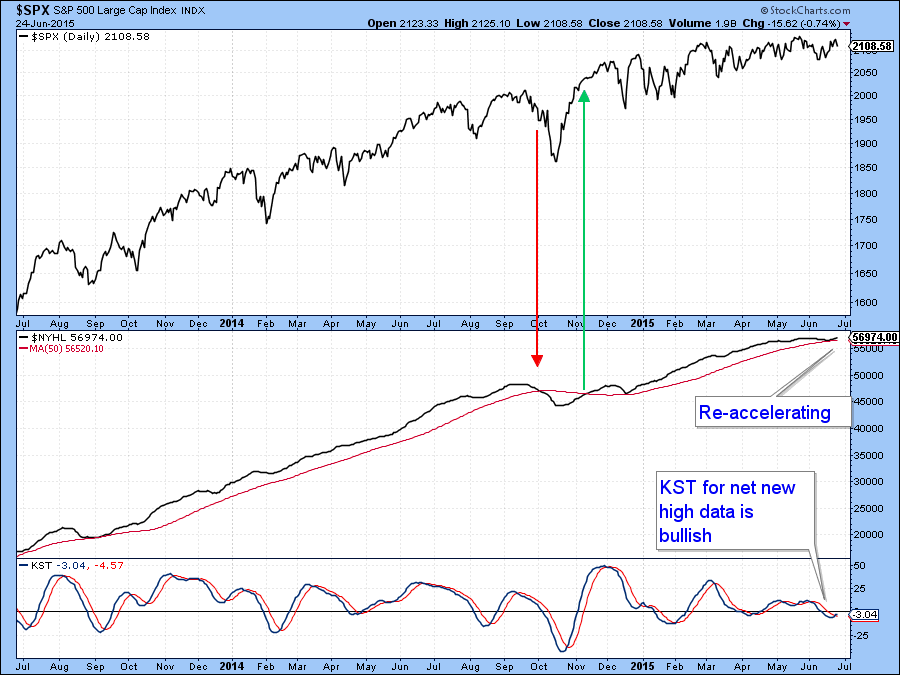
Chart 6
Bonds
The bond market is way overdue for some kind of rally. You can see this from the position of my Bond Net New High (!PRNNHBND) indicator. This series is calculated from a basket of divergent bond ETF’s registering net new highs over a short-term time span. The arrows show that whenever it has reversed from an oversold reading, as was recently the case, bonds have experienced some kind of a rally averaging several weeks. At the moment the indicator is still declining. However some respite from recent weakness seems likely as the KST for the Barclays 20-year Trust (TLT) has gone bullish following a small positive divergence. At the moment there has been no confirmation from the price, which would require a break above the down trendline at $118.
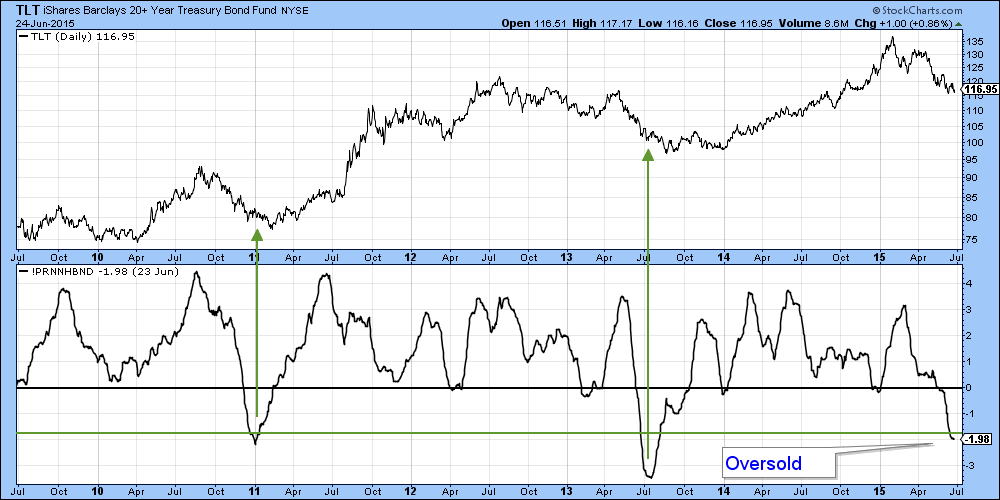
Chart 7
Barclays 20-year Trust (TLT) is shown in Chart 8.
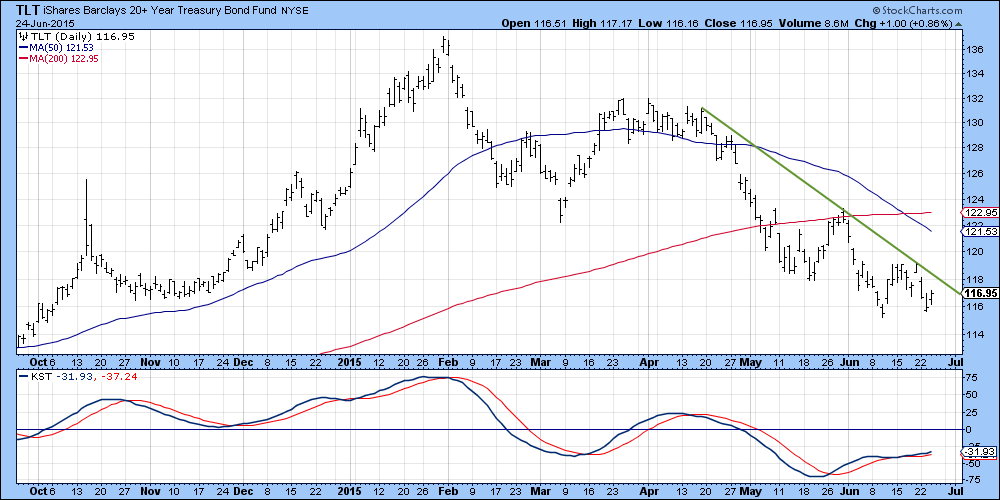
Chart 8
Canadian and Australian Dollars
Both the Canadian ($CDW) and the Australian ($AUDUSD) currencies are currently classified as being in a primary bear market. In my book the objective measurements I use are being below their 12-month MA's and experiencing a negative long-term KST. See Charts 9 and 10.
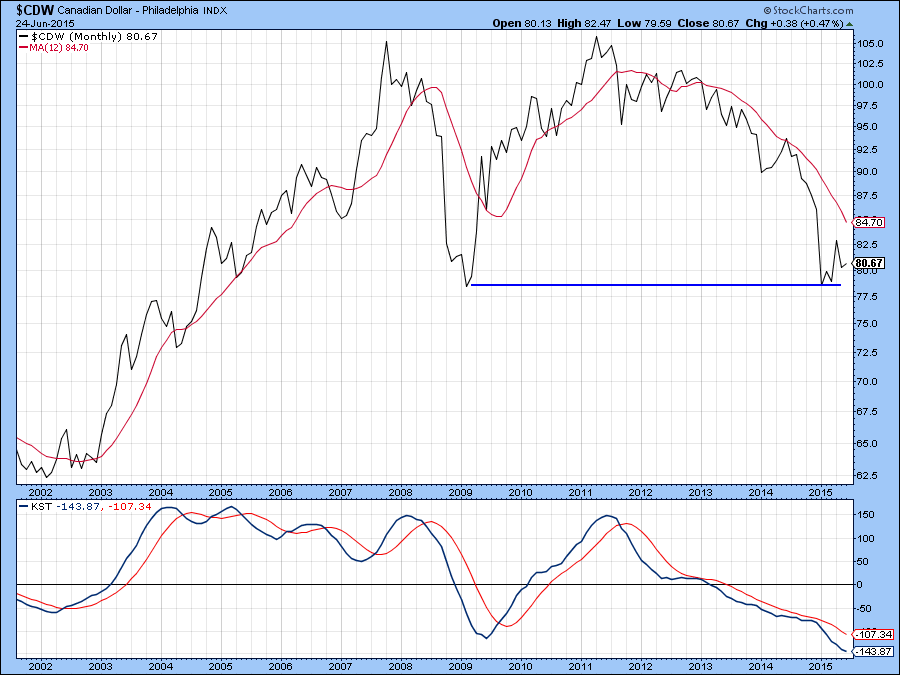
Chart 9
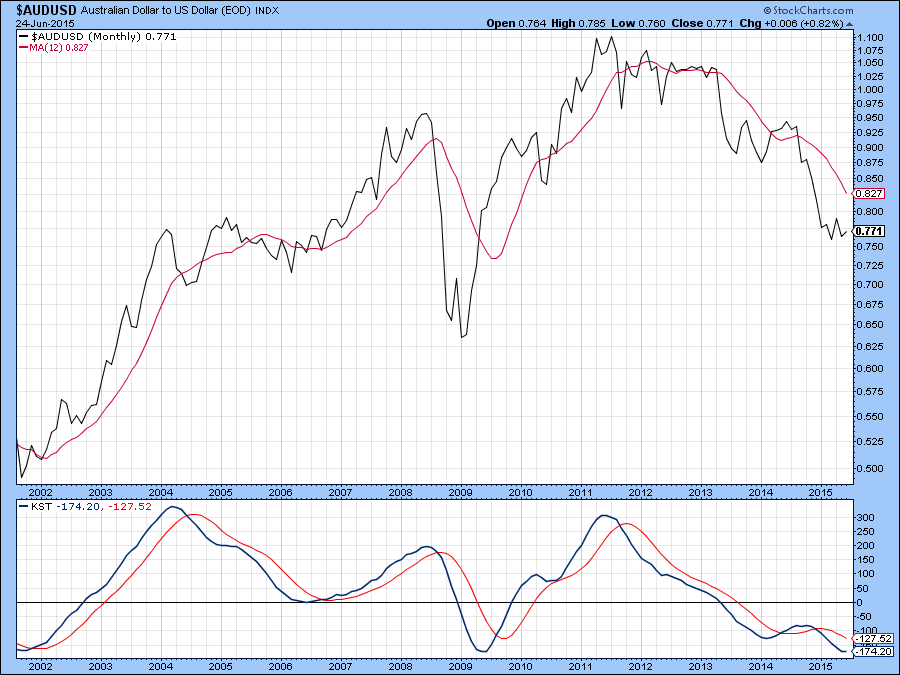
Chart 10
Of course, identifying primary trend movements is more complicated than that but as a quick test it’s usually a useful technique. Right now though, both currencies look as if they want to rally, probably in a counter-cyclical way as featured in Charts 11 and 12. Here you can see that both short-term KST indicators have reversed to the upside. Confirmation from price has yet to come since neither down trendline has yet been penetrated on the upside. The lines are currently at 82.50c for the Canadian and 80c for the Aussie dollar.
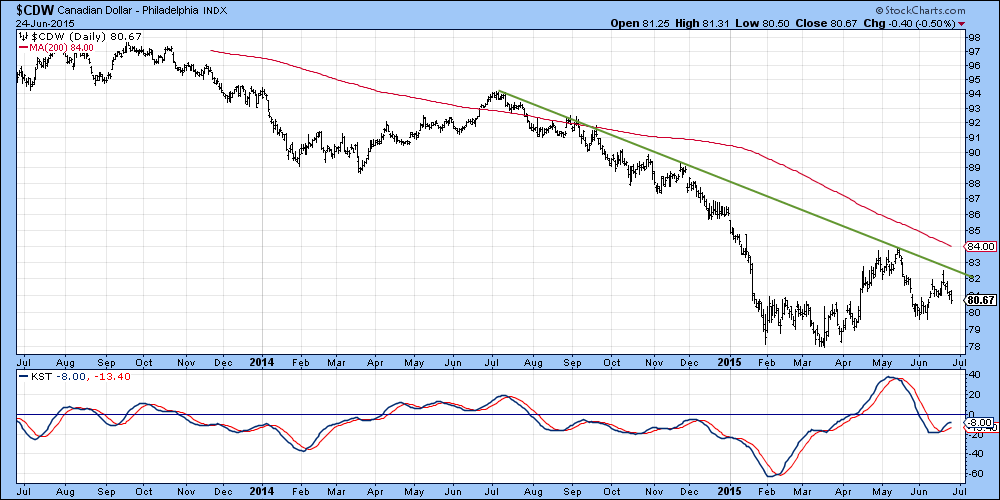
Chart 11
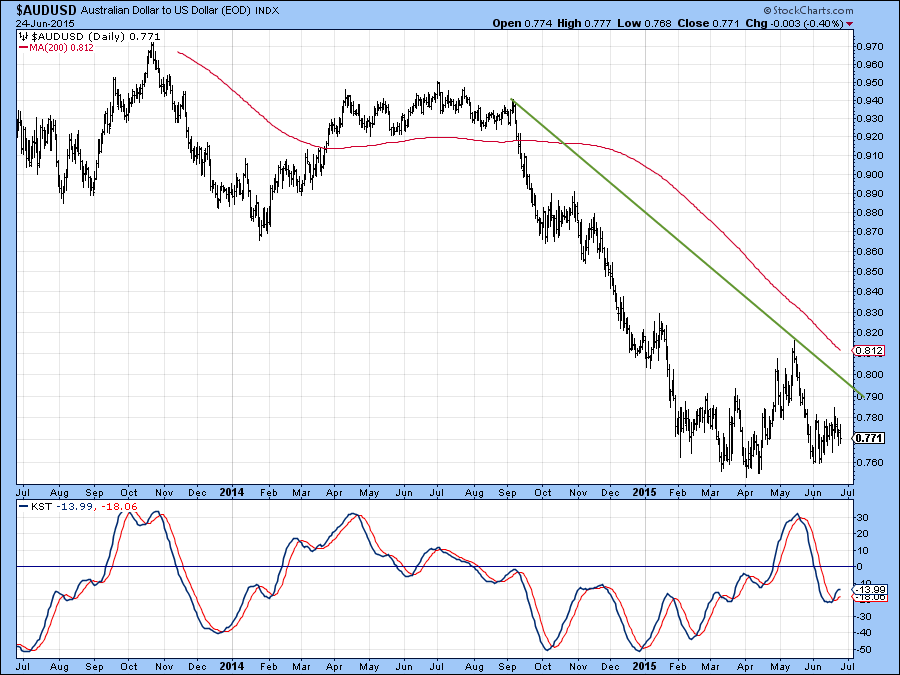
Chart 12
Good luck and good charting,
Martin Pring
The views expressed in this article are those of the author and do not necessarily reflect the position or opinion of Pring Turner Capital Group or its affiliates.


