Long-term Indicators Signal A Primary Bear Market But Last Monday's Panic Low Ought To Hold For A While
- Right shoulder rally is a work in progress.
- Dollar Index showing some technical cracks.
- Gold breaks out against stocks.
Last week I pointed out that the S&P 500 ($SPX), along with several other averages, had experienced a bullish exhaustion day. That fact, along with an excessively high reading in the VIX suggested that a rally was likely. I also pointed out that a normal expectancy for a retracement rally was 50% of the previous decline. The S&P did rally, but did not quite make the 50% (2000) mark. The bad news is that might be the cap for the rally but the better news is that the excessive readings in the VIX ($VIX), see Chart 1, and 'net' new NYSE 52-week highs ($NYHL) (Chart 3) suggest that we may well see some ranging action in the period ahead but not a sustainable move to new lows. I emphasize the word sustainable because it’s quite possible that last Monday’s low could be taken out on a temporary basis. If you study Chart 1 carefully you will see that the VIX was very volatile at high levels when the 2011 bottom was being formed. That gave the (red) 50-day MA to time to rally as well. At present it is rising but is not at a very elevated reading, hence the conclusion of more volatility before things calm down.
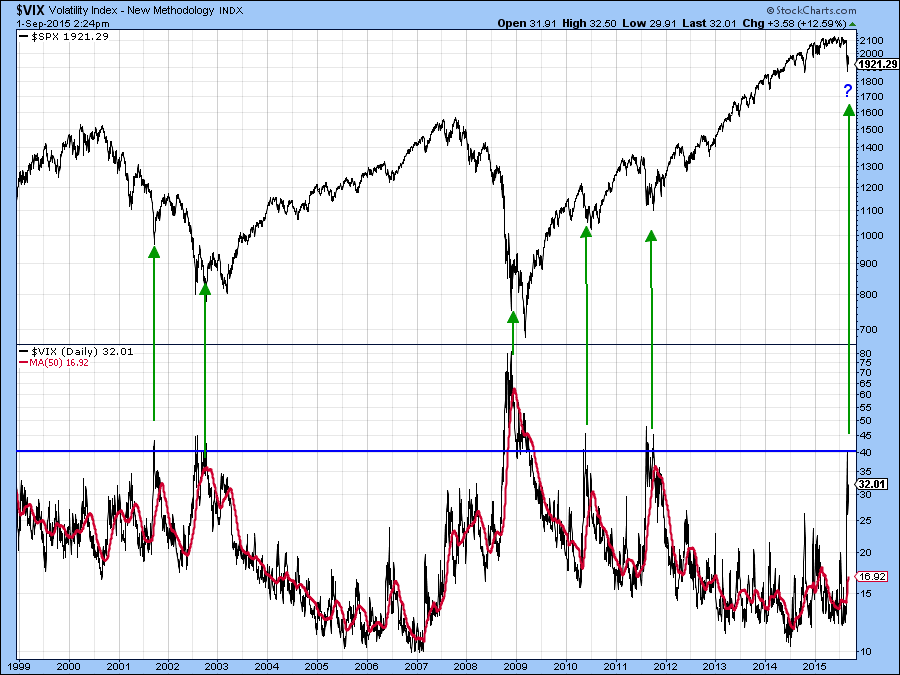
Chart 1
Chart 2 shows some more good news. That arises because the Dow Jones Industrial Average Tracking ETF (DIA) gapped down on Tuesday, thereby leaving a large vacuum. Prices almost always close gaps, so that means that an attempt to close this “hole” in the chart is likely to take place at some point. Gaps are emotional affairs as traders rush to get in or out of a position, depending on the direction of the gap. However, they are usually “filled” because traders typically re-visit their emotions. There are no hard and fast rules concerning how long it takes to close a gap. In most situations they are either closed, or an attempt is made at closing them, within 2-4-weeks. Last Monday’s gap, for example, was filled within three trading days. There are no guarantees however, because there is a gap on the DJIA that goes back to the 1930’s.
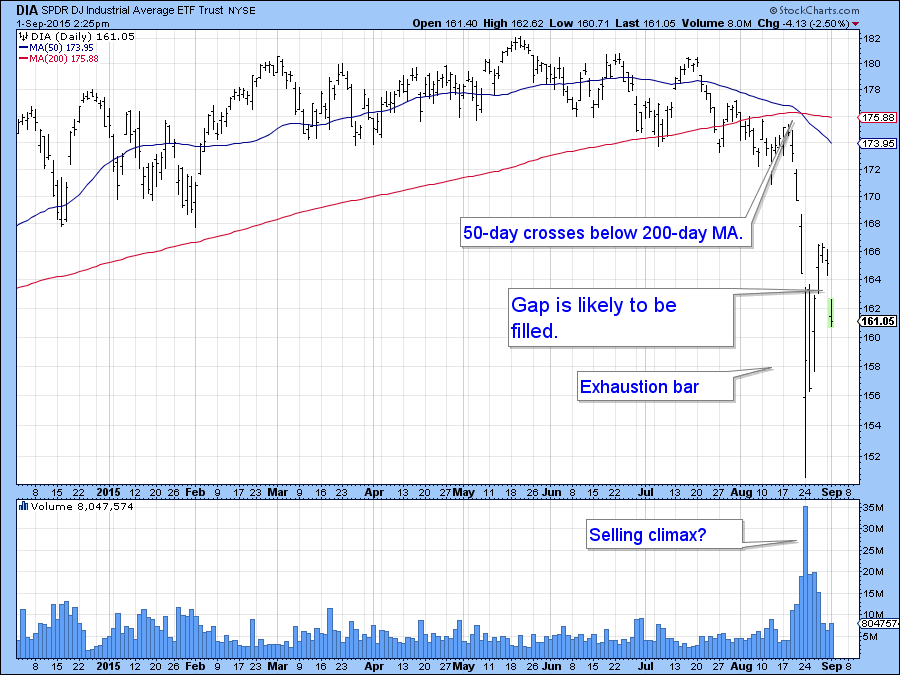
Chart 2
Chart 3 shows the NYSE net new 52-week highs ($NYHL) reached an incredibly low reading last week. That sort of action implies capitulation on the part of traders and that last week’s low will hold for a while.
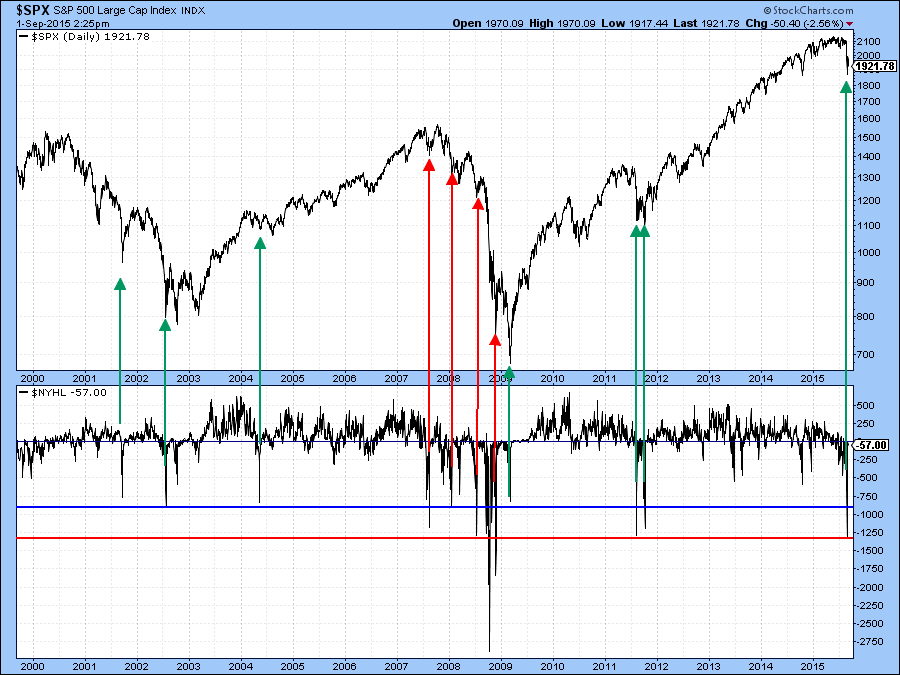
Chart 3
Last week I also pointed out a possible scenario, as featured in Chart 4. That calls for this ranging action I have been expecting to really form the right shoulder of a giant head and shoulders top on the S&P 500 Tracking ETF (SPY). The rally calls for a 50-60% retracement of the recent decline that would run into resistance at the 40-week MA. It’s far too early to say that such a development will take place. Please also be aware that the market rarely rewards such highly speculative scenarios. However, some more supporting evidence of a potential false rally of this nature has materialized in the last week.
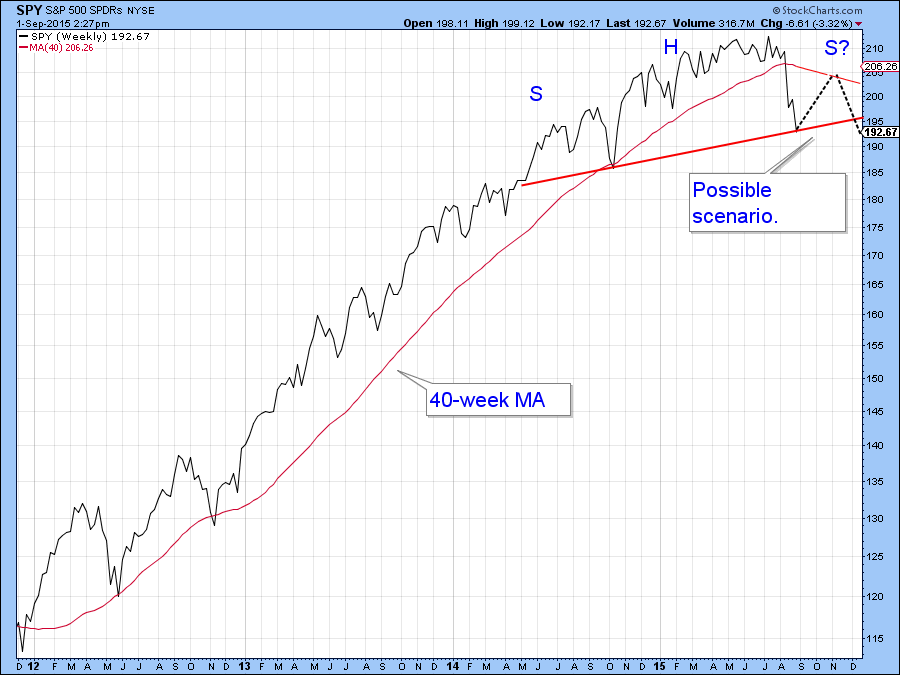
Chart 4
First, the Guggenheim (formerly Rydex) fund flow (!ASETBULSE), in Chart 5, broke down from its 2014-15 trading range. This series measures money flowing into and out of bullish and bearish funds. A falling ratio therefore reflects money moving out of bullish into bearish (inverse funds). The point I am trying to make is that last week’s rally attracted very little in the way of money flowing into the bullish funds as witnessed by the very lethargic bounce. Moreover, without Tuesday’s sharp drop being updated, the ratio actually sank to a new low on Monday. The numbers could improve of course, but right now this indicator provides a strong argument for the right shoulder scenario.
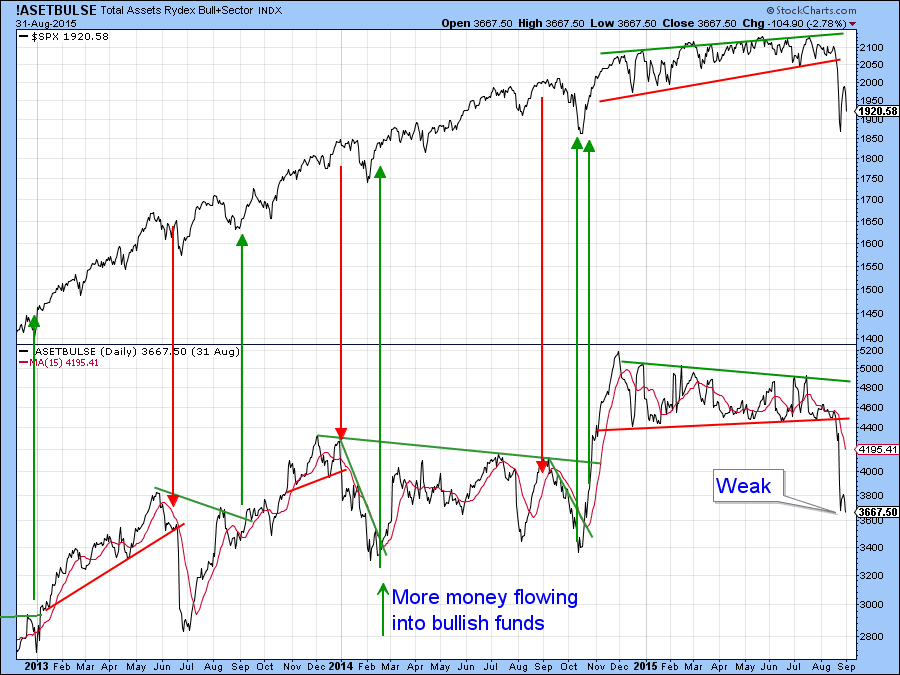
Chart 5
The second and more important reason for suspecting a head and shoulders top lies in the fact that most long-term stock market indicators that I follow, and which have been pretty reliable in the past, are signaling a primary bear market. Here I am referring to such basic indicators as the S&P relative to its 12-month MA. This is shown in Chart 6 along with the 12-month MA of the 48-month ROC for the S&P Composite. Sell signals, as flagged by the arrows, indicate reversals in the MA after the ROC itself has crossed above its overbought line.
Notwithstanding the ability of the market to hold its recent lows, it's important to understand that the bulk of the long-term indicators are signaling a primary bear market. That means that surprises will develop on the downside and rallies subject to deceptive whipsaws. Caveat emptor however attractive things may look.
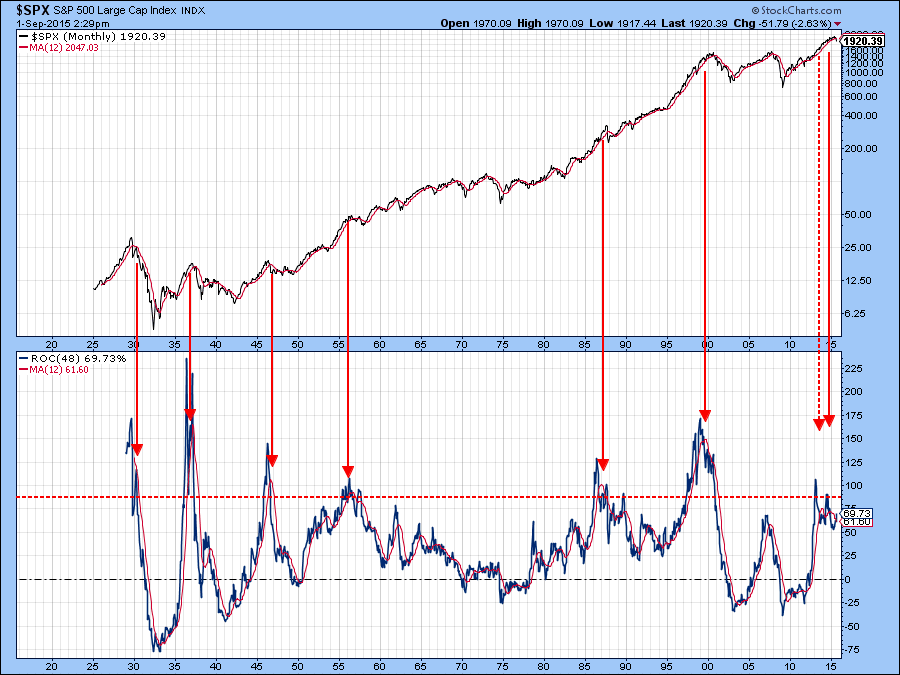
Chart 6
US Dollar
I have been bullish on the Dollar Index for some time but am starting to question as to whether the Index is still in a bull market. In recent months it has experienced a trading range, which could be a consolidation prior to additional gains. Alternatively it could be a top. Chart 7 compares the Index to its Special K (SPK). Trend changes are signaled when it is possible to construct a trendline on the SPK and this is confirmed by a similar break in the price itself. Also, when the SPK itself crosses above or below its MA (100-day smoothed by a 100-day) that usually signals a demarcation between a primary bull or bear market. Recently the SPK has completed a head and shoulders top and crossed below its MA. In my book that places it squarely in the bearish camp. However, until the Index itself confirms by completing the potential top with a decisive daily close below its recent low, say to 92.50 a bullish stance on the long-term trend is still appropriate. Note also that the KST, in the bottom panel, is close to an oversold reading and that makes an imminent breakdown less likely.
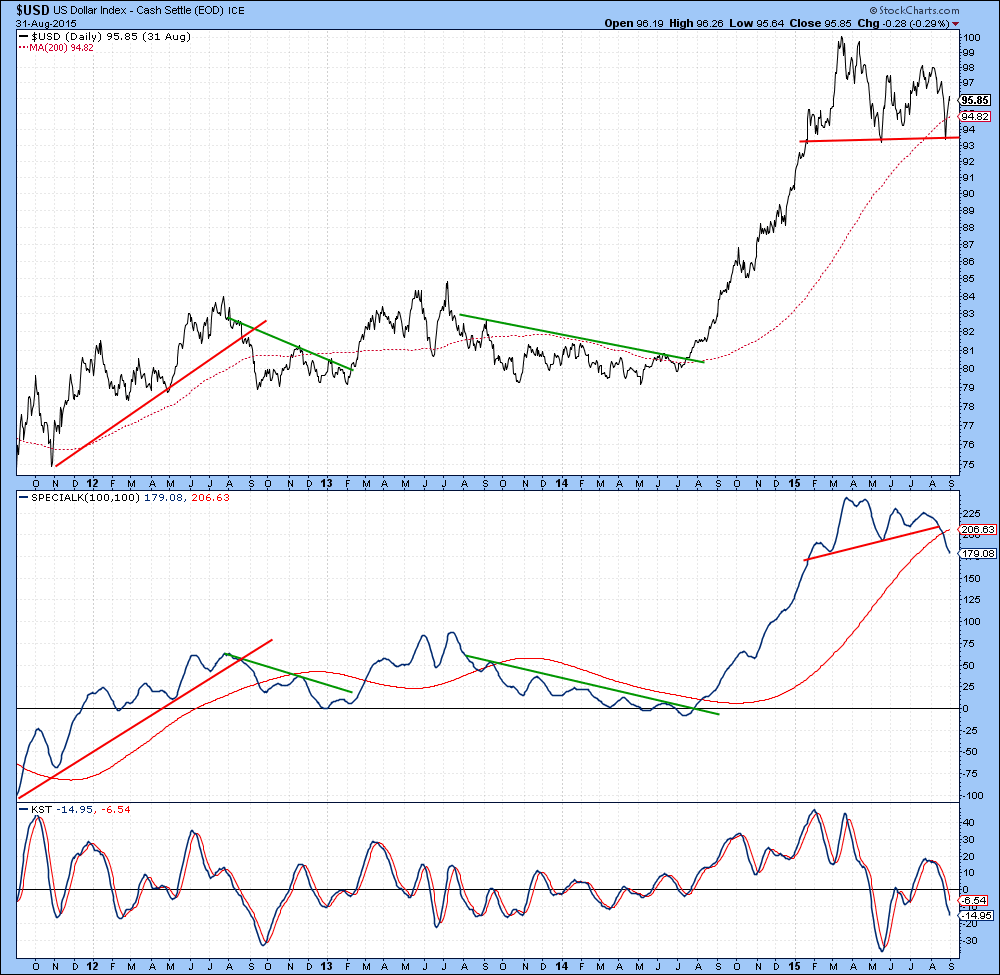
Chart 7
Gold
If the dollar starts to weaken that should theoretically be bullish for gold. The price of the yellow metal is shown in Chart 8. Note that the long-term KST has started to go bullish but the Gold Trust ETF, the GLD, would not go positive until it sees a daily close in excess of $120. Note that gold has already broken out against stocks. It has even managed to bounce from its extended down trend line this week. Since the long-term KST for this relative relationship is positive, gold is likely to out-perform stocks for some time to come. Of course this does not tell us that stocks will decline and gold rally, but usually when the yellow metal is out-performing equities, gold is advancing in its own right.
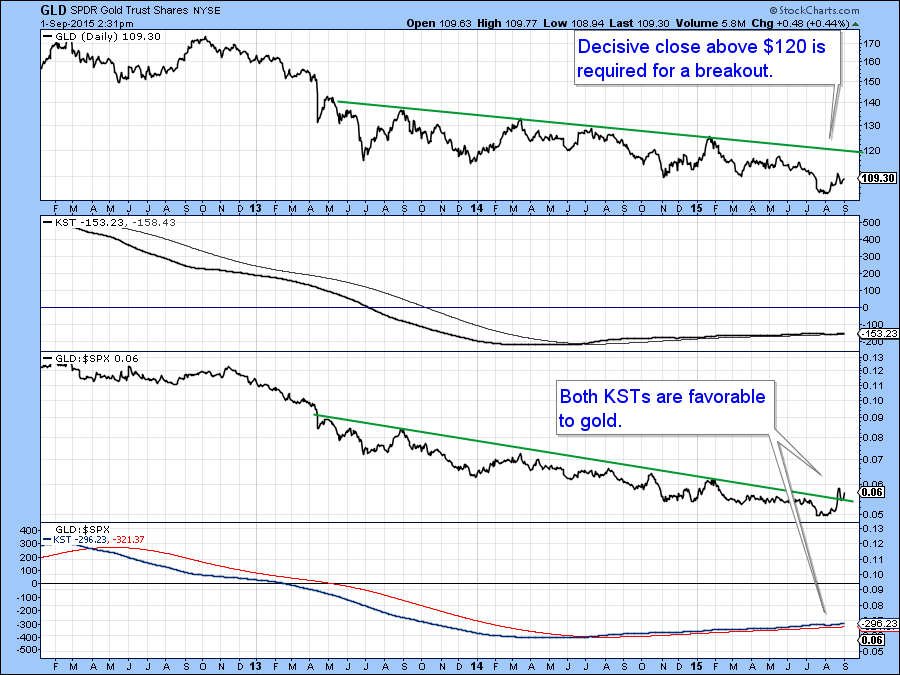
Chart 8
Good luck and good charting,
Martin J. Pring
The views expressed in this article are those of the author and do not necessarily reflect the position or opinion of Pring Turner Capital Group or its affiliates.


