Market Loses Confidence in the Fed
- Thursday’s action represents a bearish Pinocchio bar.
- Long-term indicators remain bearish.
- Will Friday’s trading have a silver lining?
Thursday’s Pinocchio bar
In last week’s article I pointed out that several market averages had experienced bearish engulfing patterns and that a test of the lows was likely. That interpretation proved to be wrong as prices consolidated for a few days and rallied. This action subsequently cancelled the engulfment, so to speak. We can never be sure in markets, as they represent people in action and people can and do change their minds.
That seems to be what happened following the Fed decision not to raise rates. Chart 1 shows this for the S&P Composite ($SPX), where intraday action took the average above resistance flagged by the green trendline. However, by the end of the day prices had fallen back below that resistance. I call these “Pinocchio” bars because like the Disney character it reflects a false move or lie by the market. In this case the whipsaw intraday price action represents the Pinocchio nose. Generally speaking, the longer it is the bigger the lie. In this case the Pinocchio bar represents an exhaustion move. When prices trade above this kind of resistance traders are attracted by the breakout as they expect prices will move higher. When they fall back again this misplaced optimism turns into potential supply that presses prices lower. Moreover, the breakout encourages traders to cover their short positions thus removing a buying cushion that could be used to stabilize prices. Combine both possibilities and this exhaustion of buying power sets the market up for a disappointment.
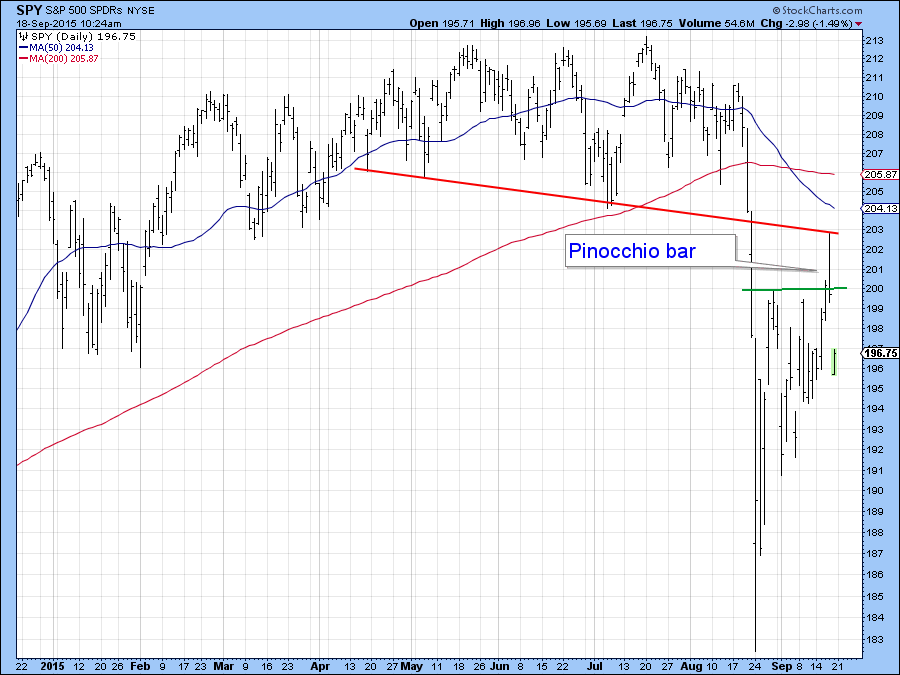
Chart 1
The effectiveness of Pinocchio bars is also enhanced by the level of volume and, in this respect, Chart 2 shows that activity did pick up noticeably on Thursday to the highest level since the August 24 low. Volume is important because it reflects a higher number of traders caught on the wrong side of the market, which means that such positions have to be unwound.
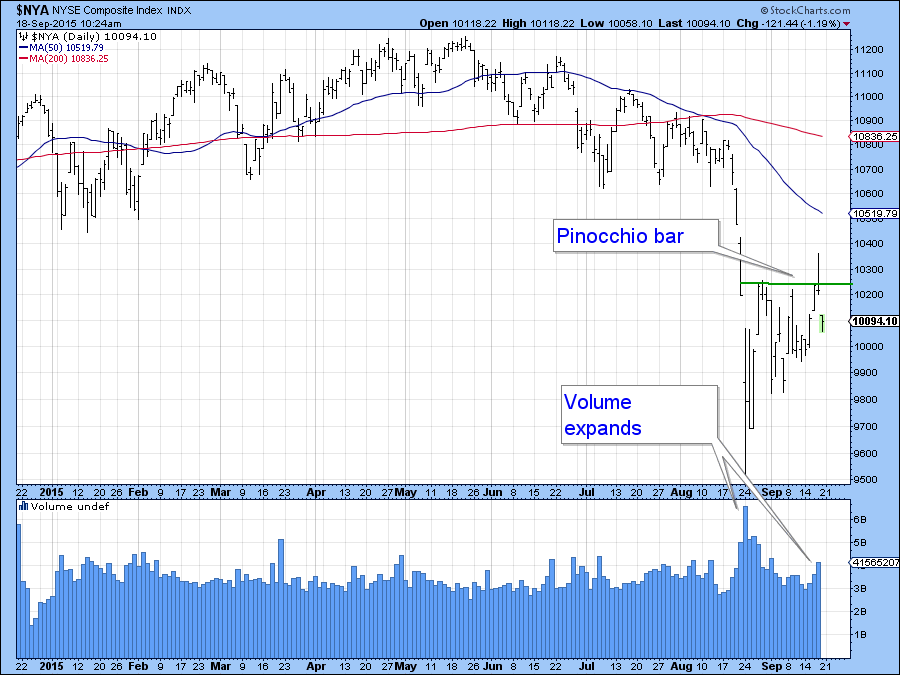
Chart 2
I like to see Pinocchio bars confirmed by subsequent price action so that we can have greater confidence in the signal. In this case that would be a break above the post August 24 up trendline as shown in Chart 3. At present the line is resting around 1980, so a decisive break would come with a daily close say below 1970. You can also see from the chart that the KST for the SPY has just gone bullish, which suggests to me that the August low is likely to hold. Remember, the Pinocchio is really a short-term technical phenomenon and, if it works, is only expected to have a negative effect on prices for about 5-10 days.
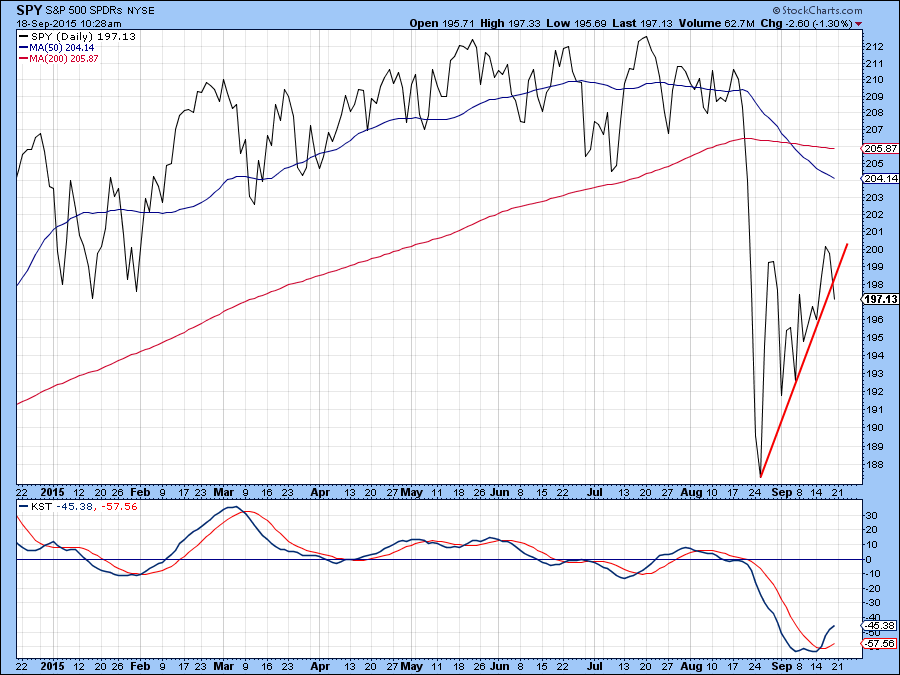
Chart 3
To put some perspective into this situation, Chart 4 compares two ROC’s, one with a 15- and another with a 30-day time frame. You can see that the 30-day series is still basing out from an oversold level not unlike the KST, whereas the 15-day series is peaking-out from an overbought condition. This reflects the battle between very short-term (bearish) and intermediate (bullish) forces that is currently underway.
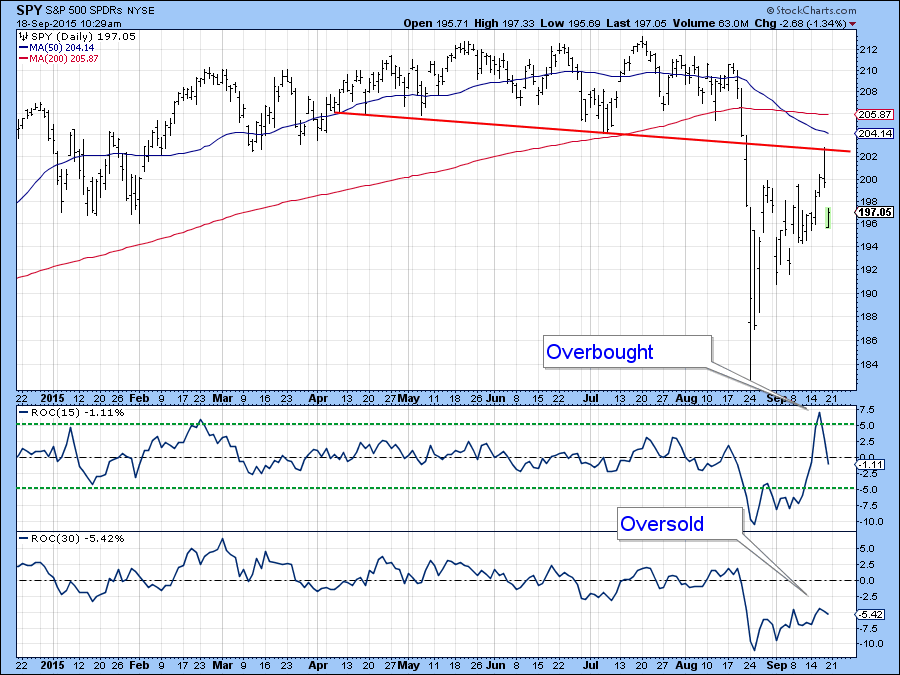
Chart 4
Chart 5 shows that the Pinocchio characteristic was not just limited to the US as the MSCI World Stock ETF, the ACWI, experienced similar action.
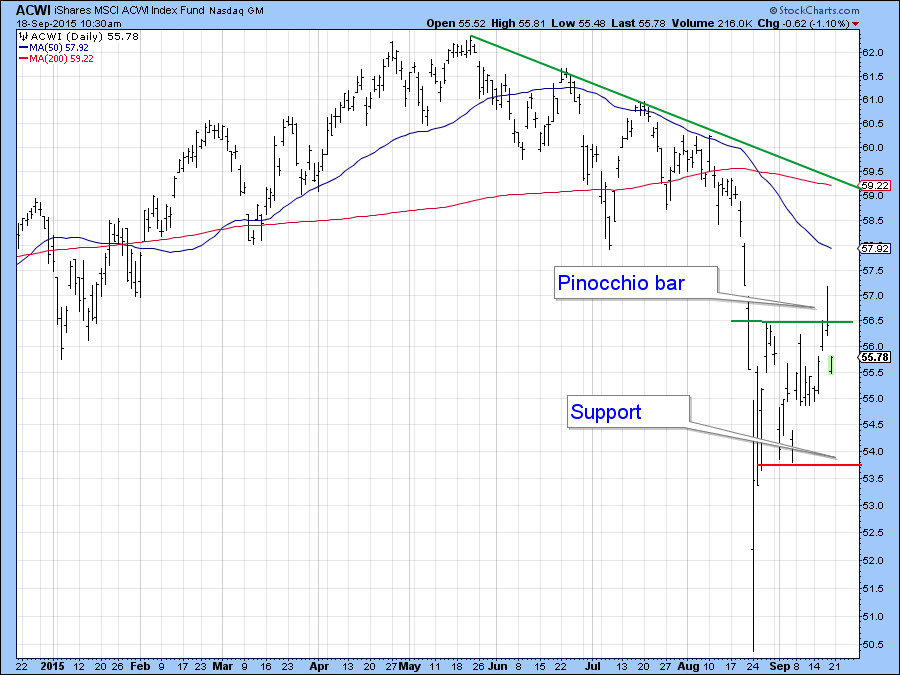
Chart 5
I wrote that part of the article last night and this morning we find that the Pinocchio is working. The good news though is that today’s sharp down move has left a gap on the charts between yesterday’s low and today’s trading. That gap may or may not be closed today but, working on the assumption that it will be closed, is more indicative of a test of the August rather than having it taken out.
Long-term Indicators
Stepping back a bit we need to take note of the fact that the primary trend indicators remain negative and are likely to remain that way into the end of the month. Chart 6 sets the scene with a comparison of the S&P Composite ($SPX) with its long-term KST. The two previous bear markets were signaled when a bearish KST was confirmed by a trendline break and negative 12-month MA crossover by the S&P Composite itself. We see a similar combo break in the current cycle, which, in my view confirms a primary bear market. Nothing is perfect in the world of technical analysis as you can see from the false negative triggered in 2011. While unlikely, there is nothing in the rule book that says a similar whipsaw type move might develop in the current situation. That’s why we need to keep an eye out for the possibility of a decisive rally above the 12-month MA at 2060. In the meantime, as the earlier charts indicated the odds of a test of the August low have increased and will increase even more in the event of a closing price below 1970.
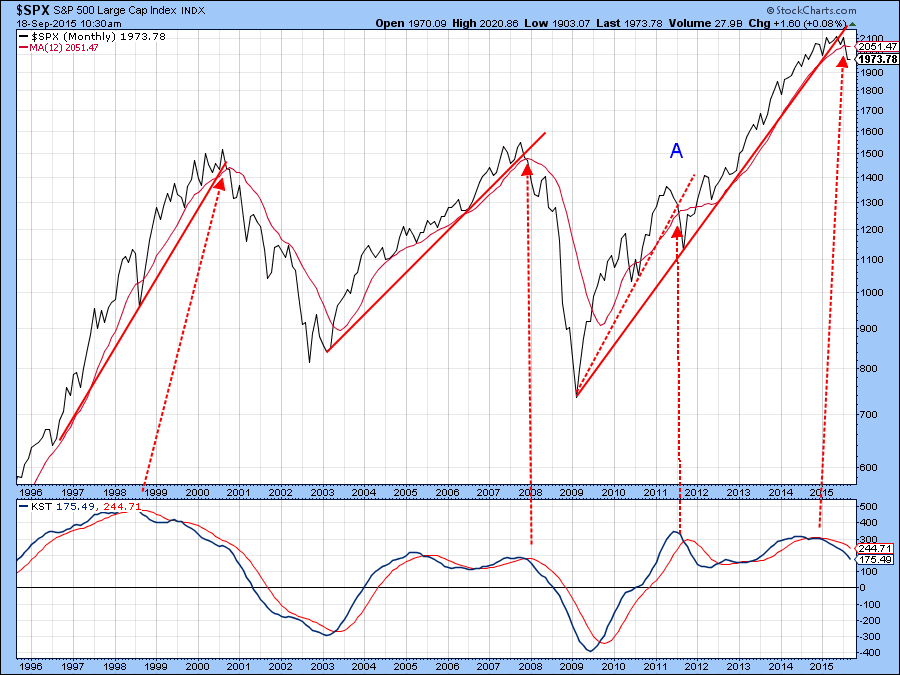
Chart 6
Things to watch for in Friday’s trading
I have to admit that when I started writing about the Pinocchio last night I was not expecting such a sharply lower opening that we got this morning. However, it does not necessarily mean the end of the world as there could be a silver lining, depending on where prices close. That’s because the sharp move from Thursday’s intraday high to Friday’s opening offers up the possibility that the session’s trading could end up as an exhaustion day. That would occur if Friday’s trading range is a wide one and if the close turns out to be significantly higher than the 1957 opening on the SPY. It would also be important for volume to build on Thursday’s high number. Such action would suggest that buyers again have the upper hand and that a move to Thursday’s intraday high is possible next week. We also need to watch that 1970 level again.
However, if the close is significantly lower than the open this will tell us nothing except that the Pinocchio bar formed on Thursday is “working” and working in the same direction as the bearish long-term indicators.
Good luck and good charting,
Martin J. Pring
The views expressed in this article are those of the author and do not necessarily reflect the position or opinion of Pring Turner Capital Group or its affiliates.


