US Stock Market Successfully Tests its August 24 Low
- 8/16 PPO triggers a buy signal for the S&P Composite
- Resource-based stocks showing signs of improving relative action
- Bonds experience an exhaustion day
Earlier in the week I noted that the market was getting pretty close to the August lows but that the indicator that I usually rely on for signaling short-term reversals had temporarily lost its ability to do so since the market gyrations had recently begun to speed up. As a result, the slow moving KST would likely be less accurate than normal. Instead, I suggested monitoring the PPO for the S&P, using the 8/16 parameters. The default is usually 12/26. Friday saw the indicator edge above its 8-day MA PPO. I have placed a question mark by the arrow because this is not yet a decisive crossover.
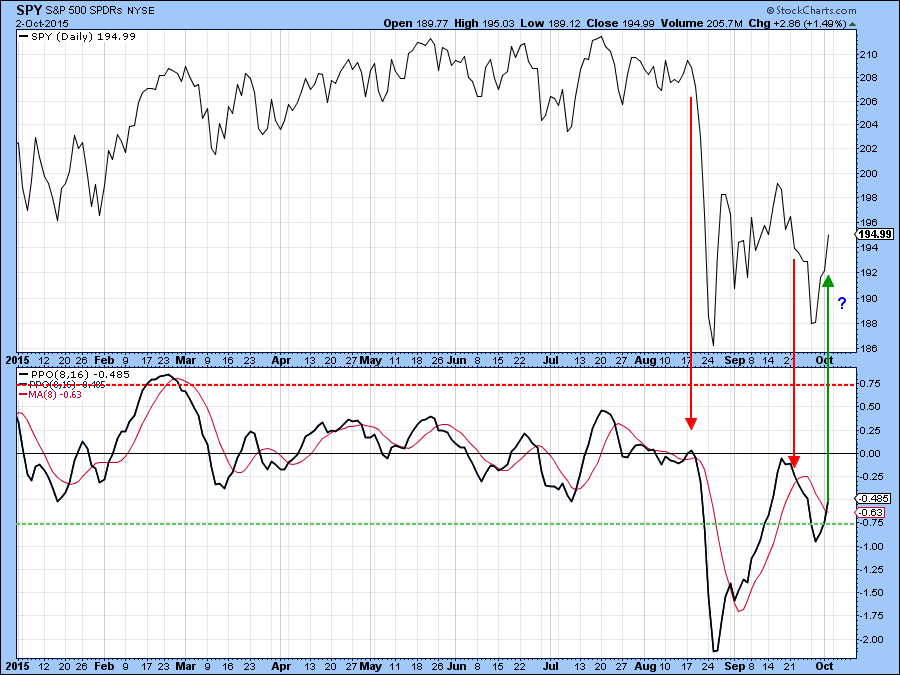
Chart 1
What is interesting is the fact that the KST, in Chart 2, appears to be reversing as well. Again the evidence is not yet decisive, but any strength from here would certainly succeed in triggering a bullish reversal. One thing that encourages me is the fact that the action on Friday represents a bullish outside bar. These one-day patterns completely encompass the trading range of the previous bar and close near to the high for the day. They reflect a one bar battle between buyers and sellers. At the start of Friday the sellers were in complete control as participants reacted adversely to the Employment Report. However, by the end of the session buyers had regained the upper hand. The effect of these one-day formations can normally be expected to last for between 5-10-sessions, enough in this case, to give the PPO and the KST a bit of a push higher.
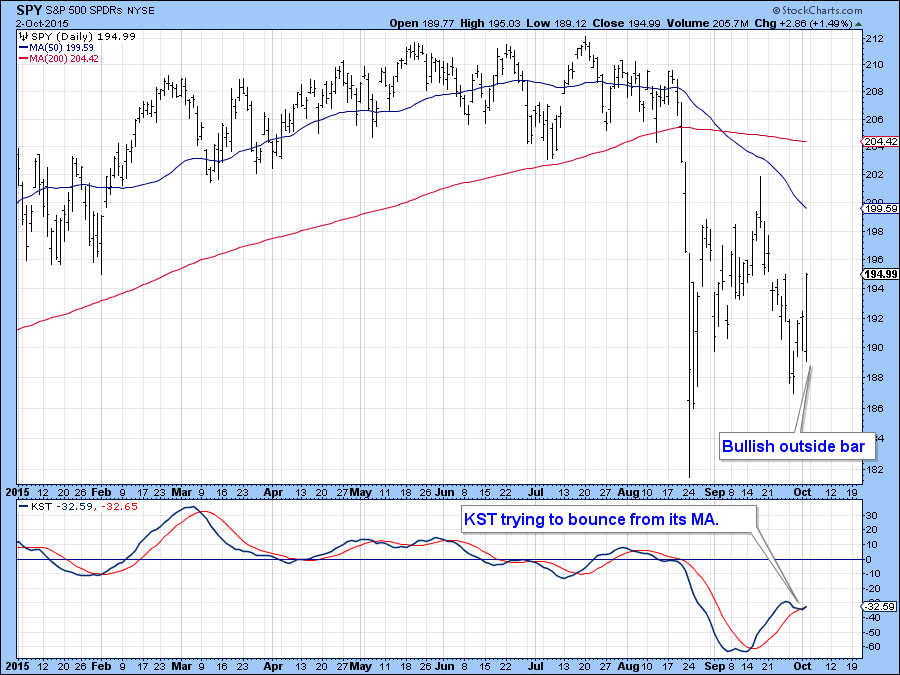
Chart 2
Chart 3 shows that reversals in the PPO using the 8/16 parameter setting, has usually resulted in a meaningful rally. The dotted green line marks a significant oversold level and a break back above is a nice signal. The problem with the current signal, of course, is that just like the one signaled in late August, it is being generated in a bear market where short-term rallies can be sub-par and very deceptive.
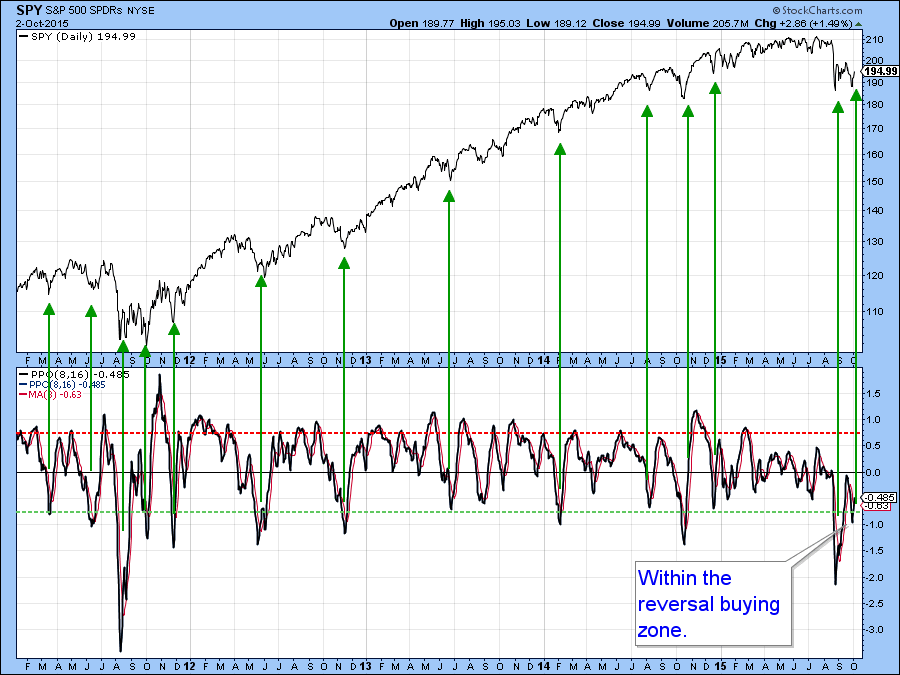
Chart 3
Which sectors are likely to benefit if the market rallies
One of my favorite key relationships is to compare a deflation (defensive) ETF with an inflation (earnings driven) sensitive one. A rising ratio then indicates that inflation beneficiaries are likely to out-perform and vice versa. The two ETF’s in question are the Goldman Sachs Natural Resource versus the Spider Consumer Staples, or the IGE versus the XLP. Chart 4 shows that the ratio has been in a long-term deflationary decline. However, things may be beginning to change. If so, the question of whether it would be a basic reversal or a counter-cyclical one would have to await new evidence.
The ratio itself experienced a very large outside day on Friday. The action not only encompassed the previous day but the six previous ones, a very big victory for the inflation sectors. So far the green trend line remains intact but there are reasons for suspecting it will soon be penetrated on the upside. The first comes from the buy signal in the PPO in the lower panel of the chart.
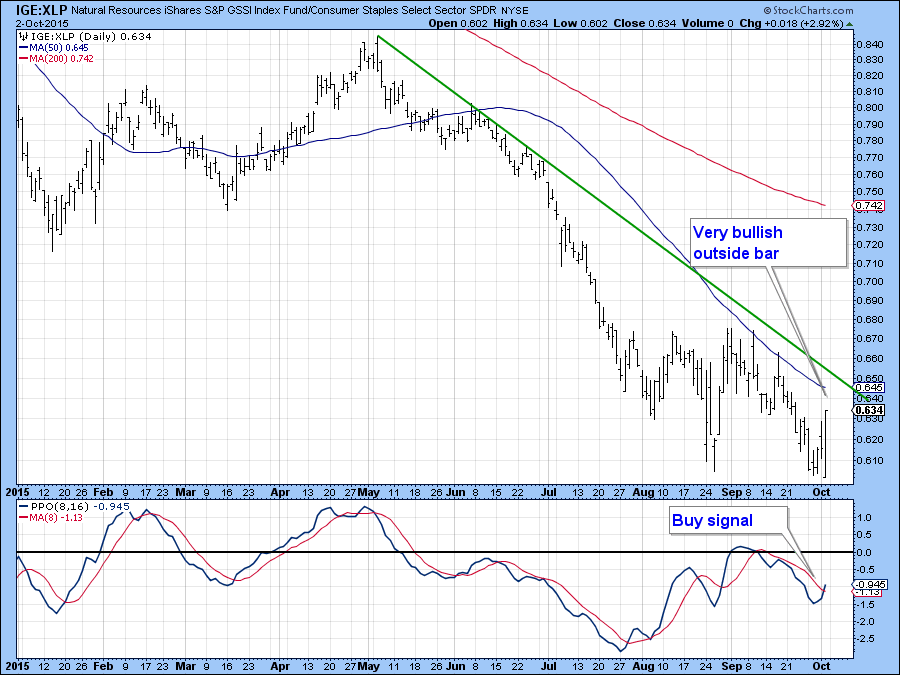
Chart 4
Another comes from Chart 5, which features recent price action in candlestick format. In retrospect, Friday’s action represents a very bullish belt hold. A belt hold is an exceptionally long real body, which often signals that a powerful move is under foot. Note that the lower part of the belt hold took it temporarily below the red support trendline, but that move proved to be a false signal of weakness. This again is the kind of action that is often followed by an above average price move.
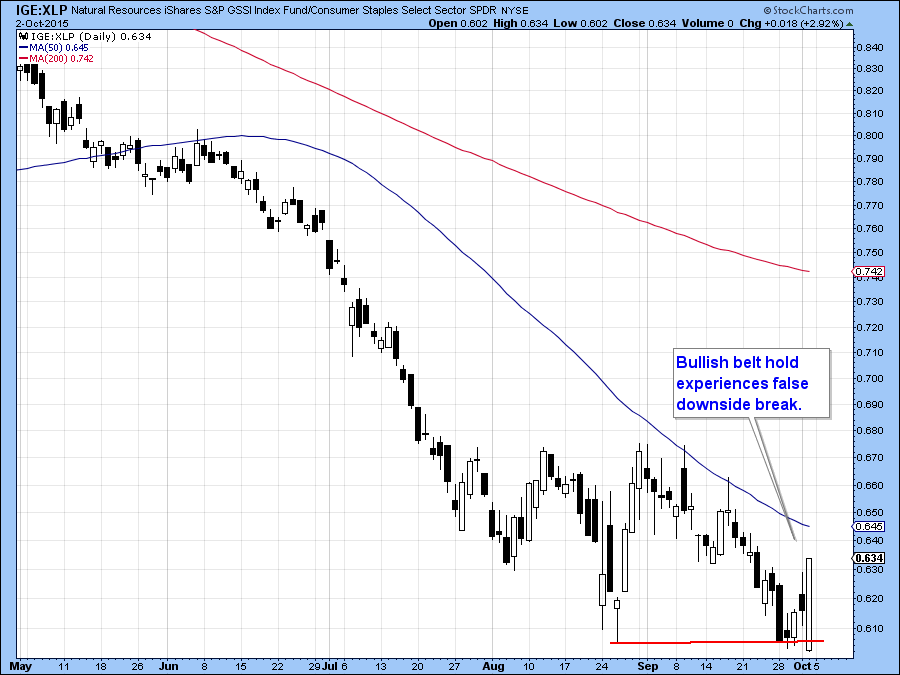
Chart 5
Chart 6 shows the ratio on a close only basis, where you can see that it may, and I do want to emphasize the word may, be in the process of forming a broadening formation with a flat top, otherwise known as a bullish right angled broadening formation. If completed, with a decisive break above the horizontal trendline, the rule book says a very powerful move could follow. Since the “deflation” trade has been a very rewarding and pervasive one over the course of the last year or so it would not be at all surprising to discover that a huge number of traders would be caught on the wrong side i.e. under invested in resource based stocks. If that proved to be the case, then a repositioning in favor of inflation beneficiaries, either through short covering or moving from an underweight position, would likely result in a powerful inflationary rally. It’s too early to say whether such a move would be counter-cyclical in nature or the start of something bigger, but the unwinding of such positions could certainly give the inflation shorts a bad night or two.
There certainly seems to be no justification economically for a commodity type rally as most global economic indicators continue to soften. However, with instability growing in the Middle East it would not be surprising to find commodities getting a psychological lift from a perceived or actual increase in hostilities.
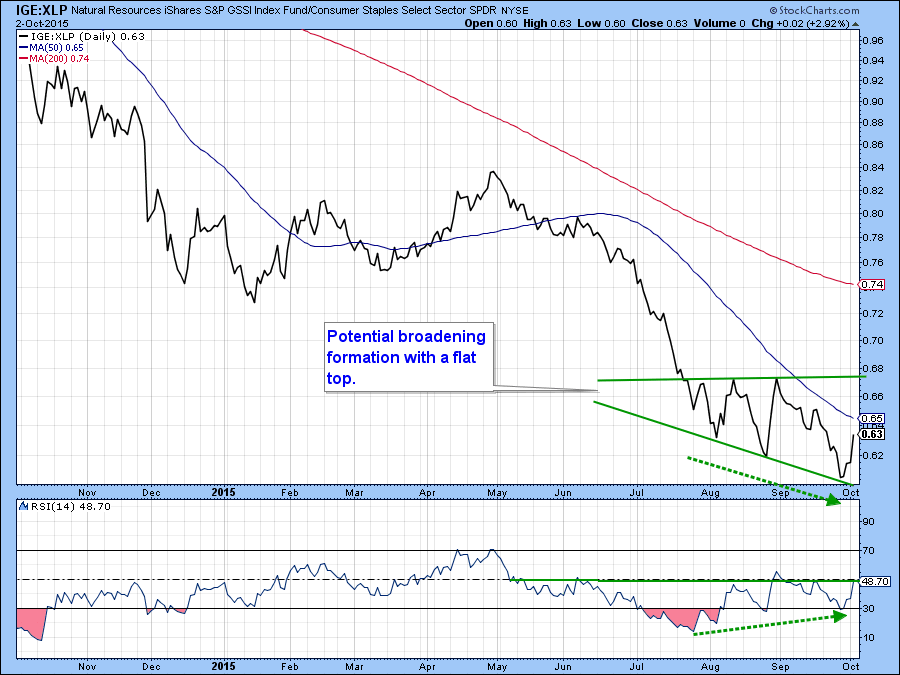
Chart 6
Charts 7, 8 and 9 show three inflation beneficiaries that have started to show some improving relative strength. Chart 8 features the Natural Resources iShares ETF (IGE). In absolute price terms, it remains below the down-trend line but relative action indicates a distinctive break to the upside. That break should enable the KST for relative action, which has just started to flatten, to reverse to the upside.
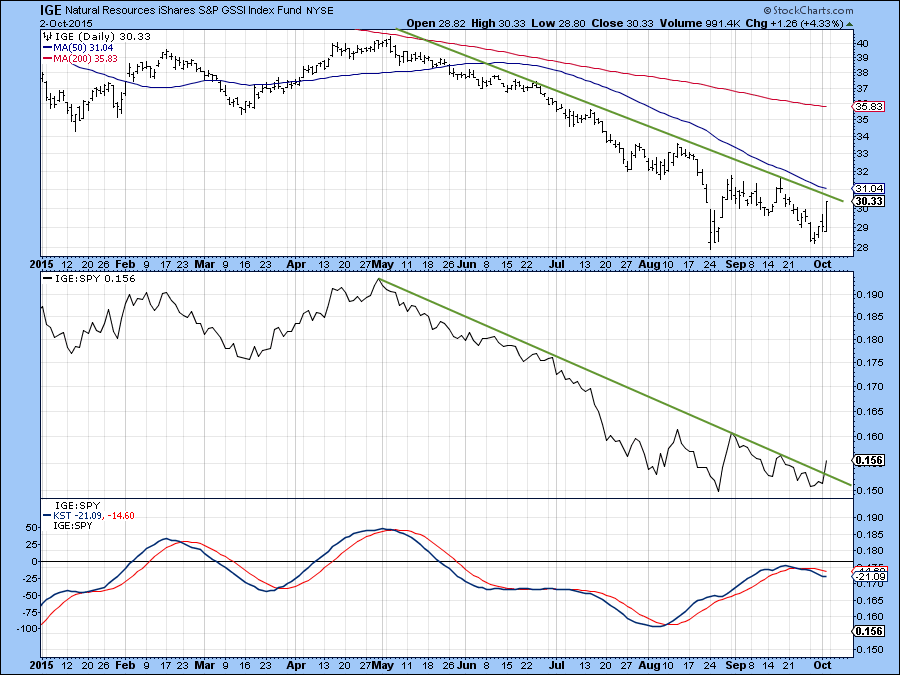
Chart 7
Chart 8 presents the Spider Energy ETF (XLE). It too is showing a similar technical pattern with a strong relative breakout. This is promising but not yet bullish, absolute price behavior. What is needed is a break above the down-trend line. That could well come since the price experienced an outside day on Friday.
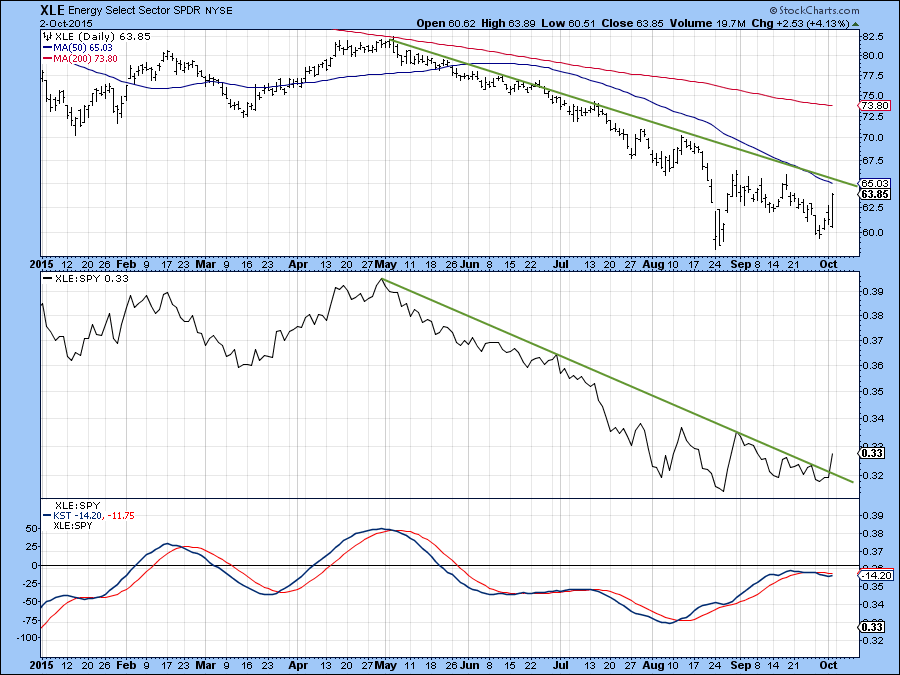
Chart 8
Finally, Chart 9 shows the GDX with a very positive relative breakout. The KST for relative action is also slightly positive and the GDX has tentatively violated its down-trend line. It’s not enough to call a break yet but certainly looks promising.
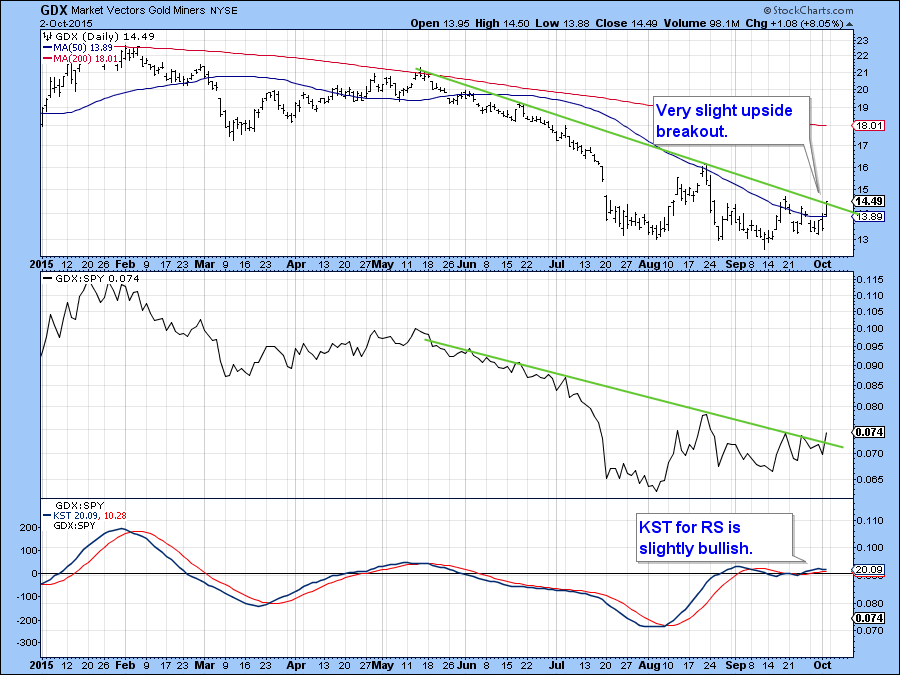
Chart 9
Bonds experience a Friday reversal
Chart 10 shows that bonds were moving in exactly the opposite direction to stocks on Friday. They initially responded in a favorable light to the employment report by gapping up at the open. However, by the end of the day they had given up pretty well all of their gains. Chart 10 clearly shows that the Barclays 20-year Trust, the TLT, experienced a false break to the upside. Friday's action is very reminiscent of that of August 24 where an exhaustion day also developed. The KST is still rising but Friday’s turn around action suggests that bonds will be under pressure for the next week or two, enough pressure perhaps to push the KST lower. The trick will be to see whether the false breakout is confirmed with a break below the red up-trend line with say, a drop below $123.
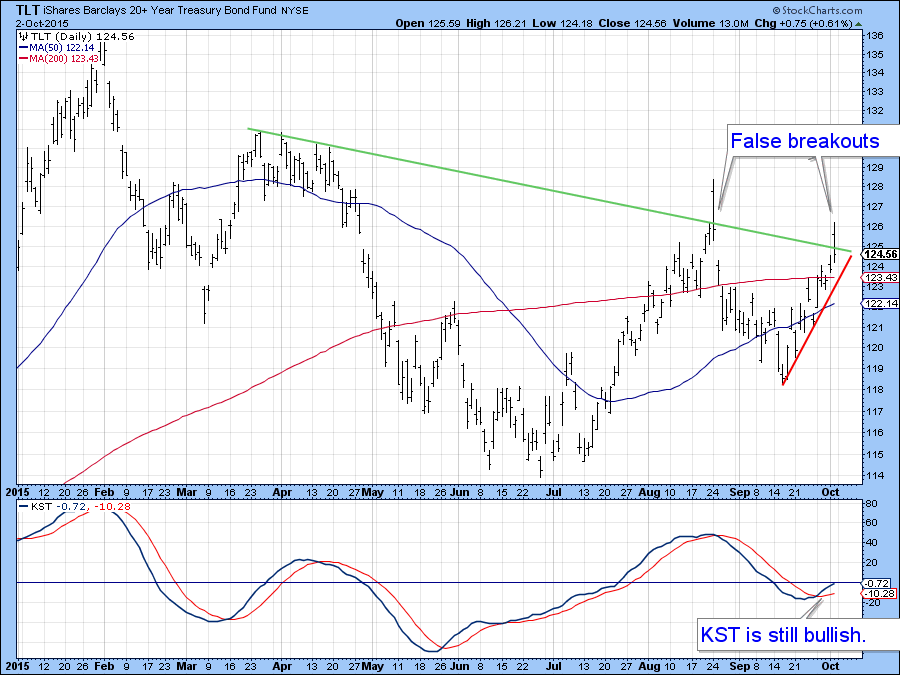
Chart 10
Good luck and good charting,
Martin J. Pring
The views expressed in this article are those of the author and do not necessarily reflect the position or opinion of Pring Turner Capital Group or its affiliates.


