A Bear Market Rally Looks As If It Is Underway
Several key short/intermediate indicators reverse from oversold conditions
Gold ETF very close to violating its bear market trendline
The intermediate Indicators are bottoming
Internal market action in the last week is starting to confirm the possibility of an intermediate low that I laid out last week. That’s because many of the indicators I cited have begun to turn positive. Some of them have also fallen to the kind of an extreme level that has consistently been followed by a rally of some kind. The question is what kind of rally should we expect? First, if you do not buy the bear market scenario and believe we are in a bull market the kind of readings we are seeing in many short-term indicators and some intermediate ones are screaming out as an exceptionally strong buy, likely to be followed by a very powerful advance. On the other hand, if we are in a bear market then a volatile rally or trading range should still be expected. The difference is that bear market rallies are notoriously deceptive and difficult to play, whereas in a bull market all boats rise with the incoming tide.
Chart 1 shows that the net new high numbers for the NYSE fell to a really oversold level last week and have rebounded almost to zero. The green arrows show similar reversals that developed in bull markets and the red ones under the context of a bear trend. You can also see that the 2015 August example was followed by a retracement almost back to the old highs. The failure to register a new peak is itself a sign of a bear market.
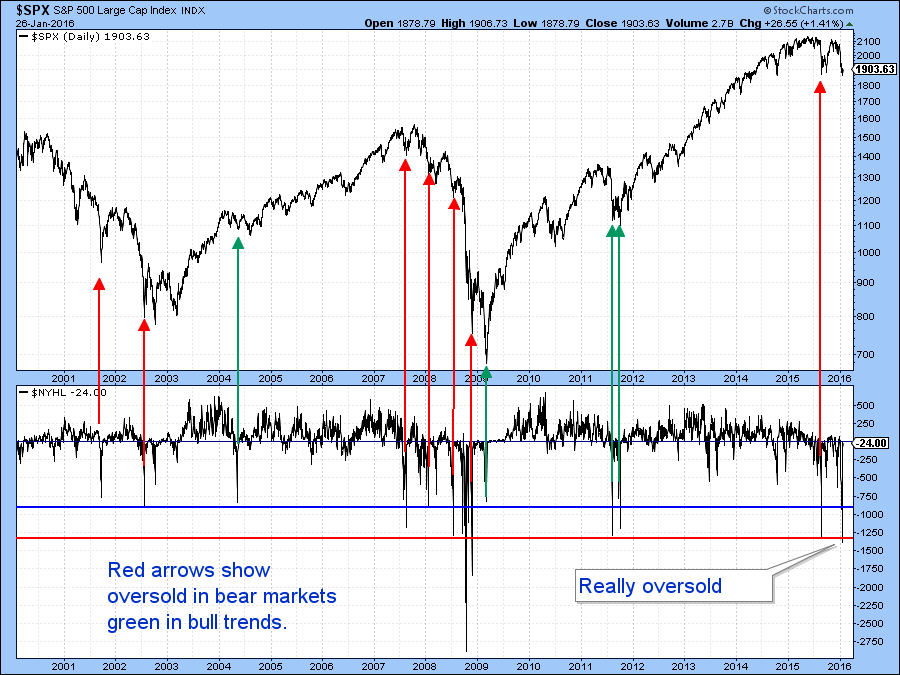
Chart 1
More evidence of a low is being given in Chart 2, where we see that the PVO recently peaked from an overbought level. That overbought level reflected an expansion in volume following a decline, so it’s a classic selling climax. The green arrows flag previous climaxes and each was followed by a rally of some kind. The red arrows indicate buying climaxes where the oscillator peaks following a rally.
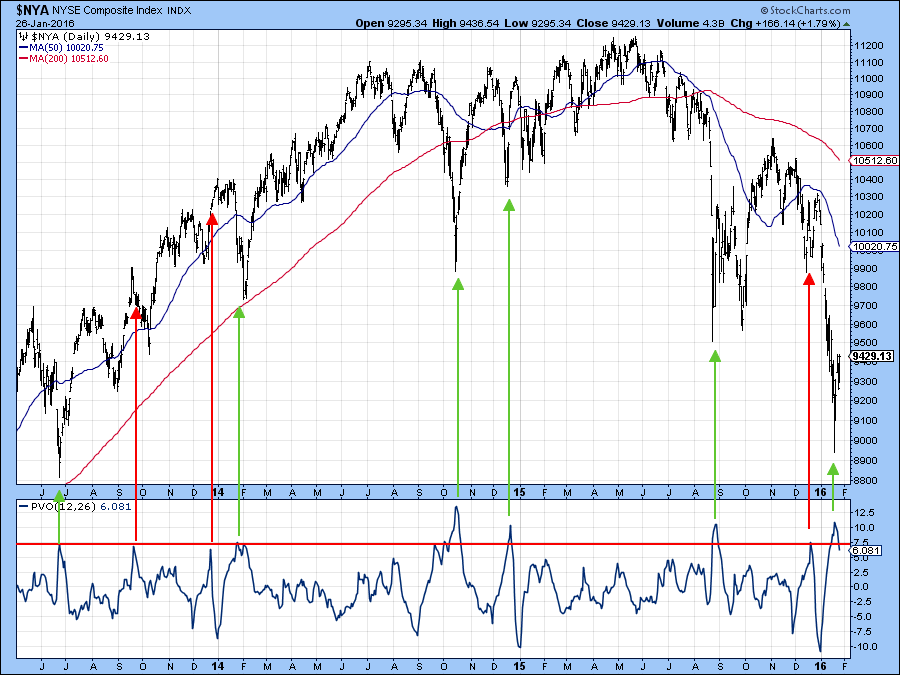
Chart 2
Chart 3 compares the 12 to the 26-day MA of the SPY in PPO format. Once again we can see that the indicator has reversed from a deeply oversold level. The recent low in the PPO at around -2 seems to fit a profile established during the 2007-8 bear market. This period is featured in Chart 4, where the oversold reading for the PPO has been set at -2. Note that the first three rallies in that bear market developed when it fell to that approximate same level. Of course it got much lower as the bear market developed, but certainly -2 could well launch a rally in the current early bear market environment. Even if prices have bottomed for a while we should not overlook the fact that price action going forward is likely to continue to be volatile. The shaded areas in Chart 4 offer an example of the type of thing to expect. Consequently, if a sell-off develops in the period ahead, even temporarily taking out last week’s low, we should not be surprised as it will not disturb the case for a bear market rally.
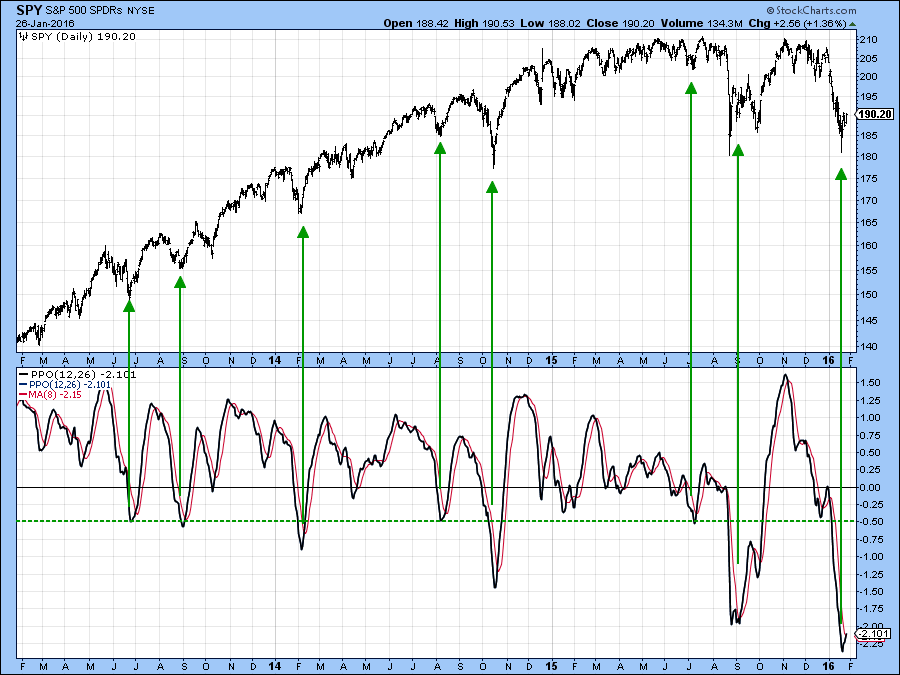
Chart 3
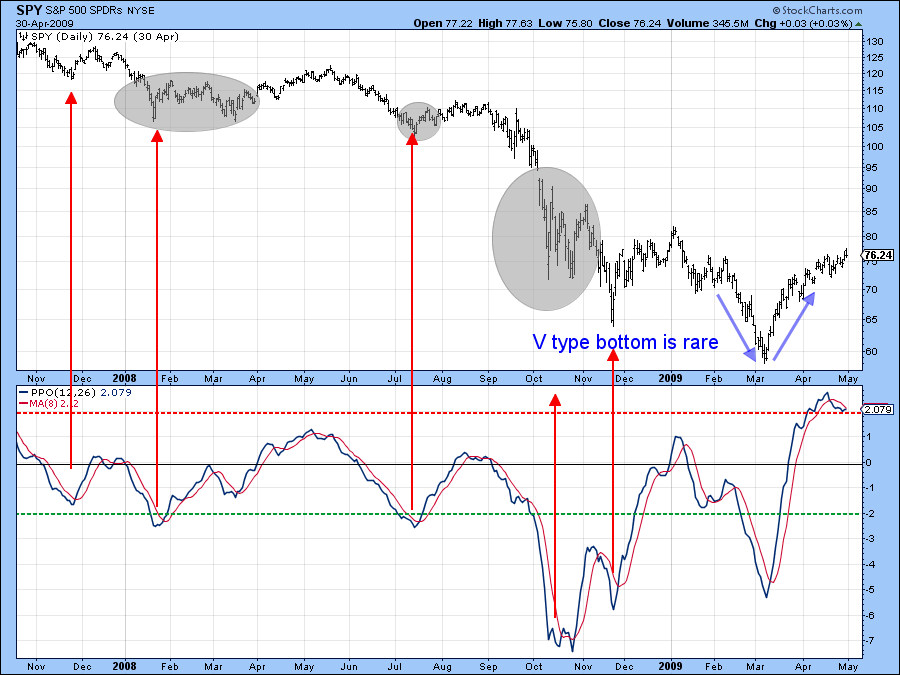
Chart 4
Charts 5 and 6 compare the number of NASDAQ stocks above their 50-day MA’s to those above their 200-day MA. A downward reversal from a high level signals intermediate rallies. Recent examples have been flagged by the green arrows in Chart 5. Chart 6 shows the same thing, except that the reversal can be seen in greater detail. The indicator recently peaked from a relatively high reading, where close to seven times as many stocks were above their 50 as opposed to their 200-day MA’s. The indicator gains its relevance from the fact that a high ratio, such as that seen at major lows, can only develop when the two individual numbers themselves are both extremely depressed, thereby pointing up a very oversold condition.
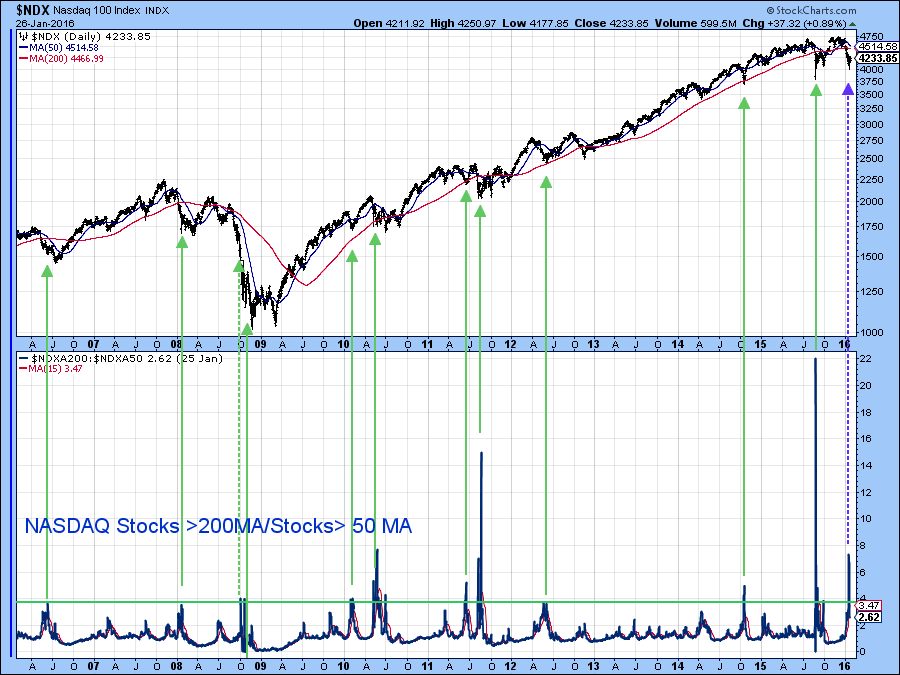
Chart 5
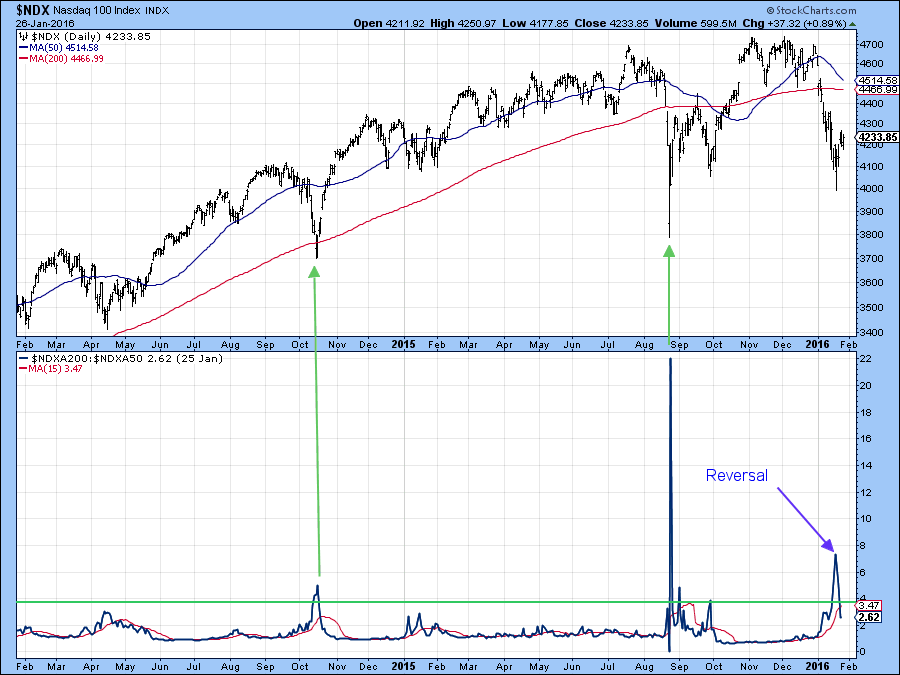
Chart 6
Finally in the oversold category, Chart 7 features my Bottom Fisher indicator. This one only has a license for picking bottoms, not tops. That occurs when it falls to, or below the green “fishing” line and subsequently turns up. This internal measure of breath transitional momentum is at an extremely low level, but has not yet turned. Data for January 26 had not been updated at publication, so you might want to keep an eye on it as it is likely to turn at any time. The symbol is !PRBFISH.
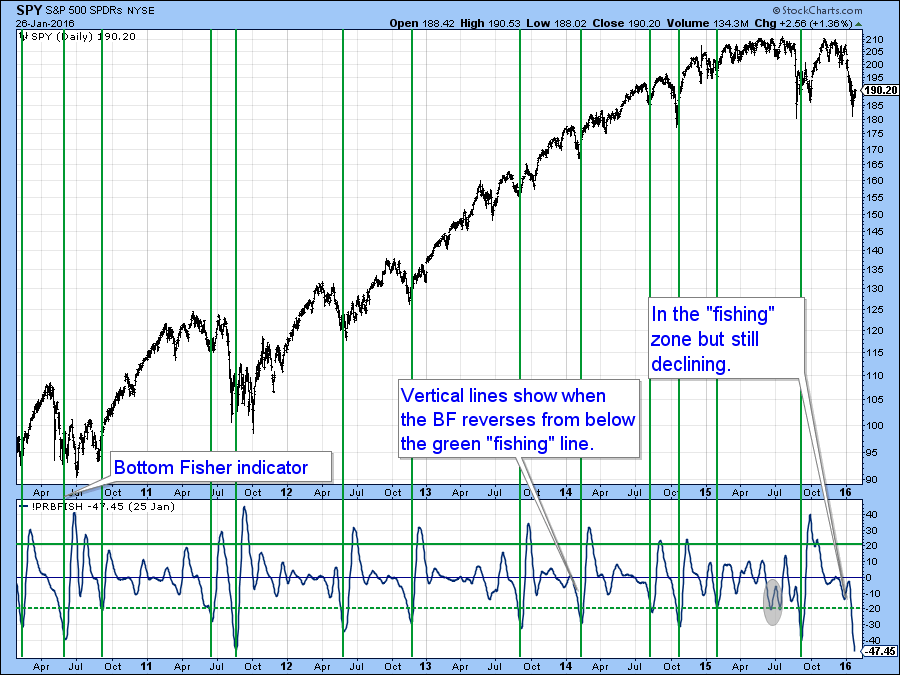
Chart 7
Chart 8 offers some ideas on how far the rally might go. The most bullish twist so far is the existence of a large gap in the $200 area for the SPY (2000 for the S&P Composite). Gaps are usually filled as investors revisit the previous emotion that initially caused them to develop. The problem, is that we do not know how long the gap filling process or an attempt at filling it will take. There are also rare occasions when a gap is not filled. However, the main point is that if the SPY does challenge that gap that would be an excellent place for anticipating the end of any bear market rally. So too would the $196 level since that would represent a 50% retracement from the November 2015 peak and the January low.
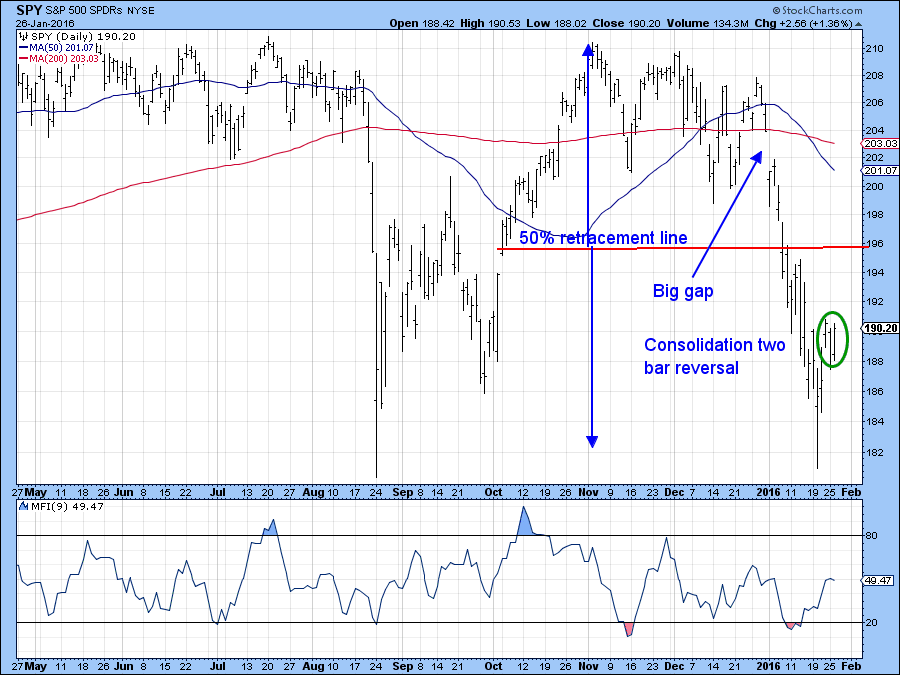
Chart 8
And what about gold?
Last week at the webinar I came down hard on the Gold Share ETF, the GDX, because it had completed and broken down from a bearish consolidation head and shoulders. Well, as you can see from Chart 9, the drop looks in retrospect to have been a whipsaw move, as the price has now rallied back above the neckline.
The false break would be confirmed with a move above the green down trendline at around $14.75, but an even stronger signal would come with an advance above the early January intraday high at $15.
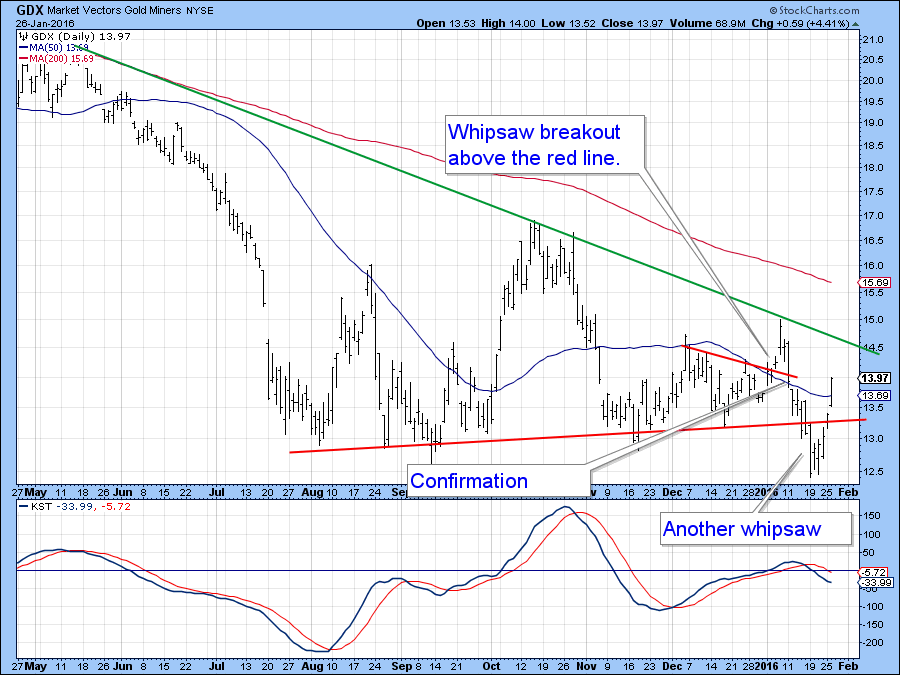
Chart 9
The SPDR Gold Trust ETF, the GLD, has been stronger recently and is currently resting right at its bear market trendline. Note that this is a monthly chart, so it requires a month-end plot. That will happen on Friday and the big number for a decisive breakout would be $110 as that would also clear the 12-month MA. Note that the long-term KST in the bottom window is already in a bullish and therefore supportive mode.
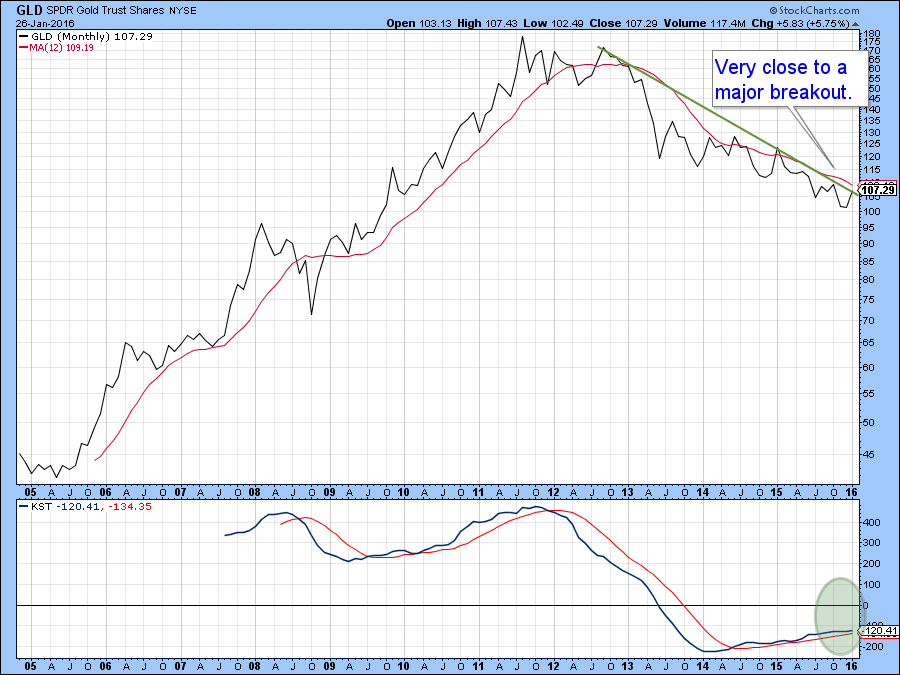
Chart 10
Good luck and good charting
Martin J. Pring
The views expressed in this article are those of the author and do not necessarily reflect the position or opinion of Pring Turner Capital Group or its affiliates.


