The BOJ Did Not Start The Trend - They Are Following It
- Global rates are in freefall
- Interest-sensitive sectors will continue to improve their relative action
- Two sectors that are likely to underperform
The recent move by the Bank of Japan (BOJ) confirmed what rates around the world have already been doing, i.e. moving lower. In Japan’s case, some rates have gone negative, which means that placing deposits in certain accounts no longer earns interest but costs the saver instead. It’s a consequence of the deflationary trend enveloping the world as governments have continued to borrow excessive amounts against their future growth. The idea is that by charging banks to hold deposits at the BOJ rather than paying them, this will encourage the banking institutions to earn money elsewhere by, for example, expanding their loan portfolios. It hasn’t worked that well in Europe, where negative rates have been in force for a while. There is no reason why we should expect it to work any better in Japan, which holds far more debt. But enough of the commentary, let’s take a look at the charts and try and get a grip on where rates around the globe are headed!
Chart 1 shows the situation with Japanese Government 10-year bonds (JGB’s). The yield has literally fallen off the chart!
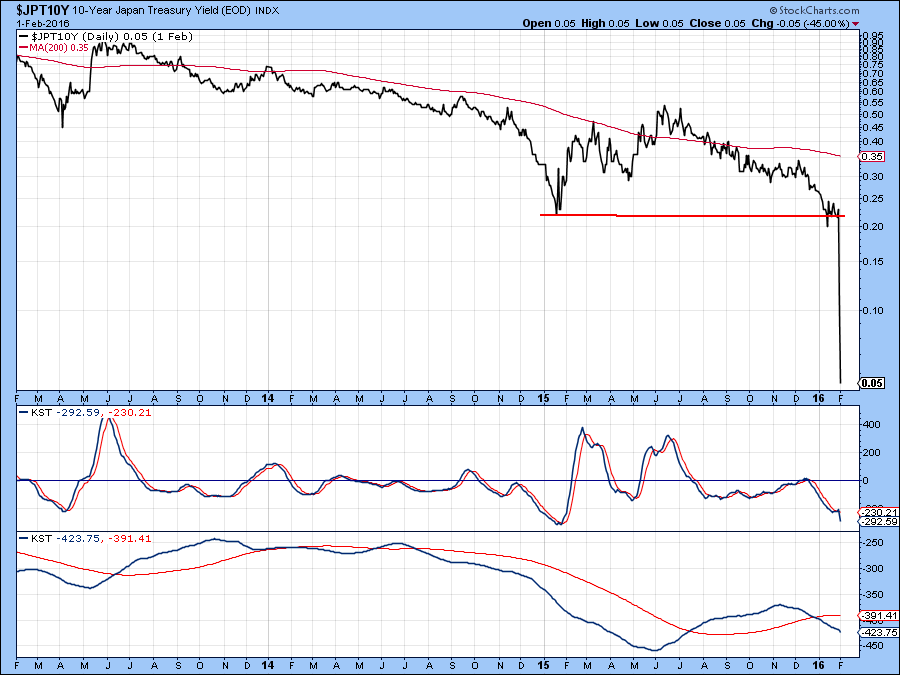
Chart 1
Chart 2 features the German 10-year yield ($DET10Y), which has also recently broken down from an important distribution formation. A similar situation has developed north of the English Channel for British Gilts. This is shown in Chart 3.
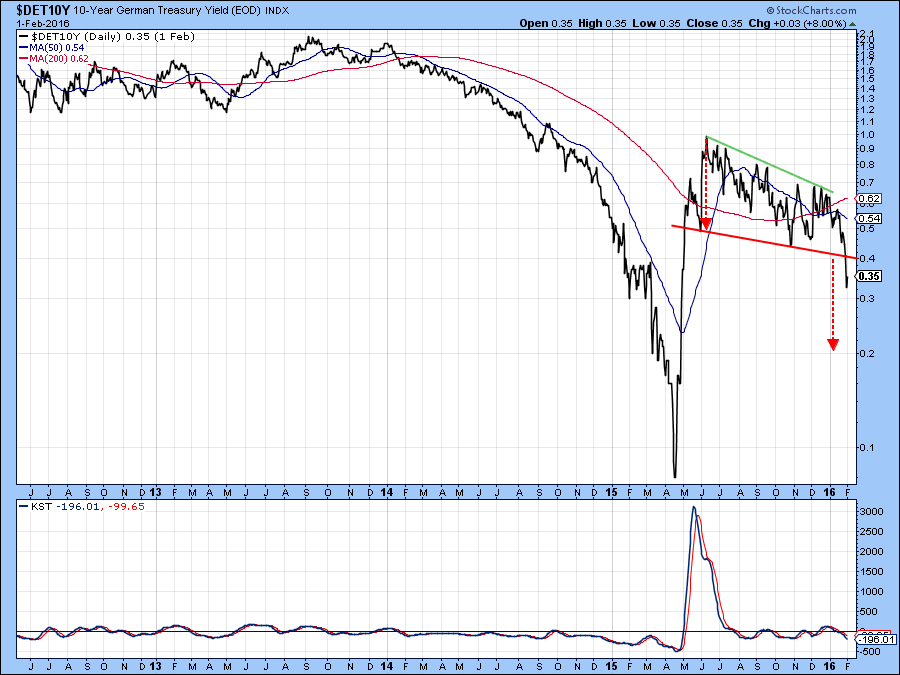
Chart 2
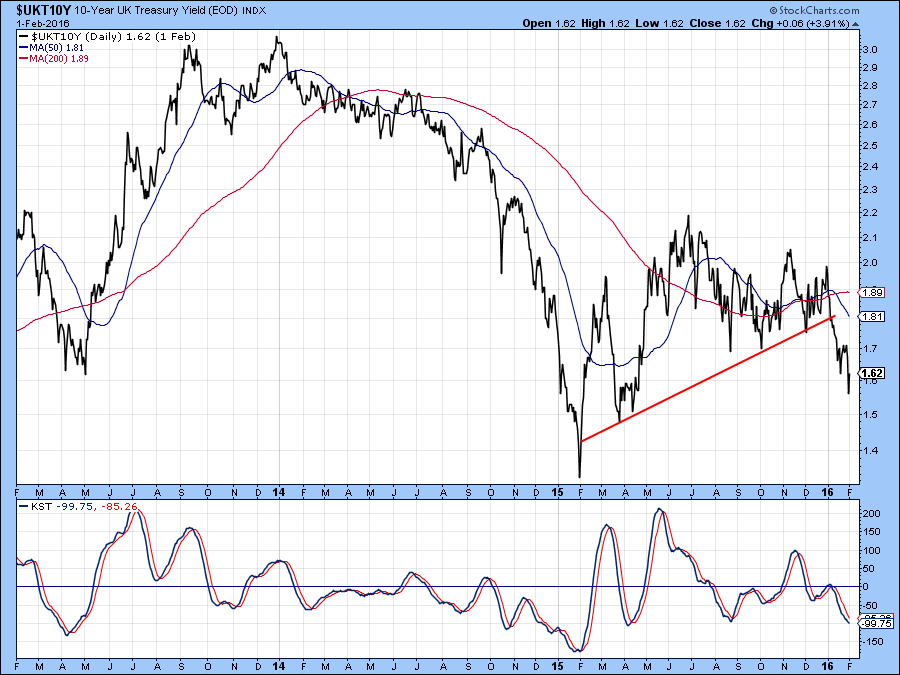
Chart 3
When we turn to the US we see something slightly different, as the 2-year yield ($UST2Y) has experienced a false breakout above the green resistance trendline. Whipsaws are often followed by above average moves as those caught on the wrong side of the trend are forced to re-position themselves. That’s why I like to see some confirmation that the move really is a false one, especially in this case as the intermediate KST is still rising. That confirmation would come with a break below the red up trendline at .66%.
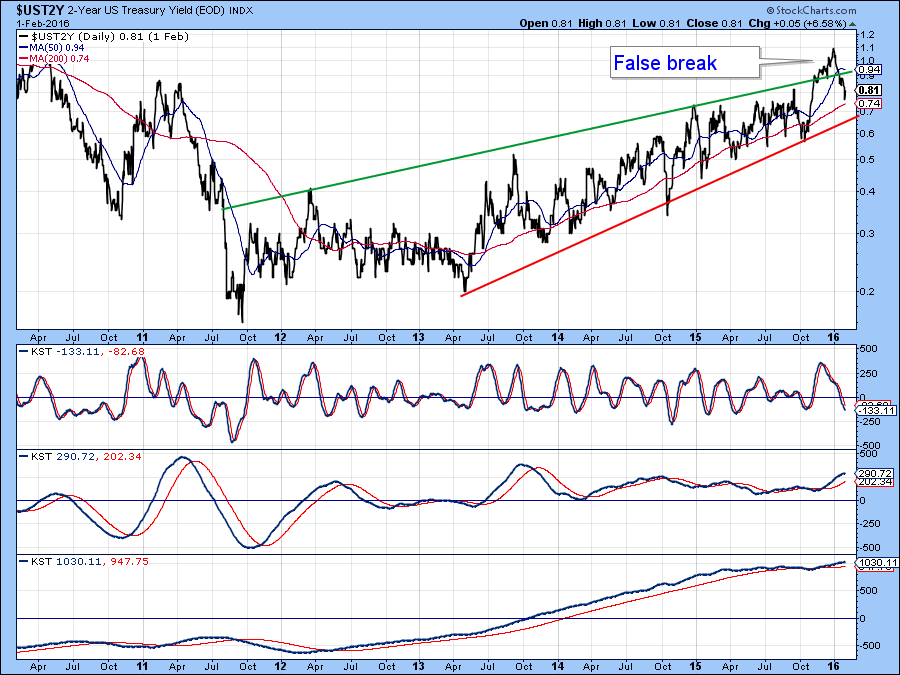
Chart 4
Chart 5 informs us that the 3-year yield ($UST3Y) also experienced a false breakout. This time above a 6-year more or less horizontal trendline. This line is not only long but has been touched or approached eight times. That means the upside breakout was significant, but the failure to hold above it is of even more significance. Note that this break has already been confirmed with a drop below the red up trendline. Although this line was temporarily violated last fall, the fact that it has been touched or approached on nine occasions re-enforces it as a very strong support level. Also, the very fact that the yield was unable to hold below the line at that time again re-enforces its role as a support zone.
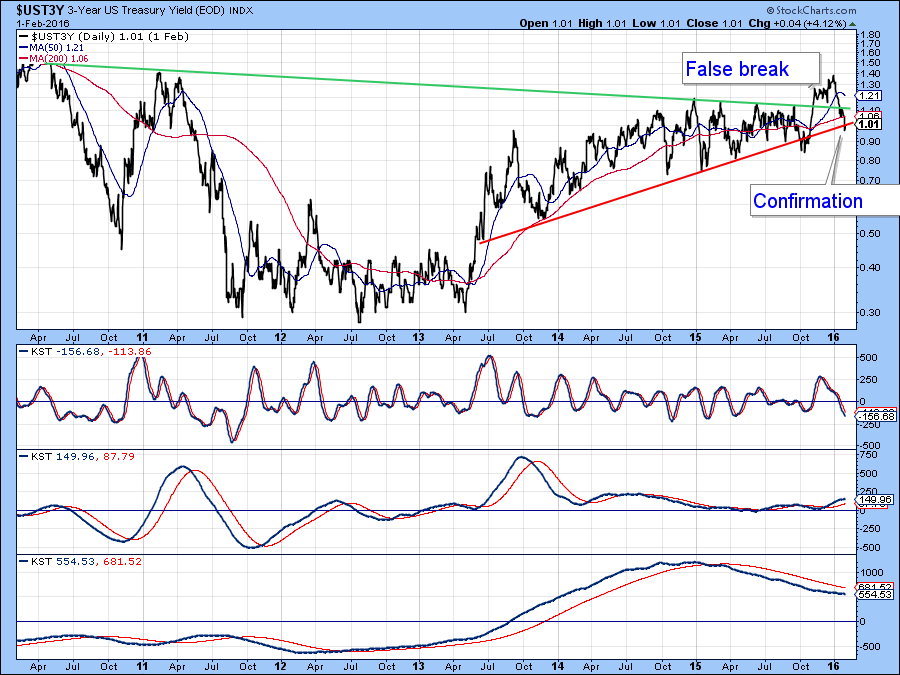
Chart 5
As we move further out, the 7-year yield ($UST7Y) can also be seen to have violated a key up trendline going all the way back to 2011. In this instance, the 7-year maturity was never able to rally above its green down trendline. Note that, unlike the shorter-term maturities we saw in the previous charts, the long-term KST is in a bearish mode for yields, thereby further supporting our case for lower yields.
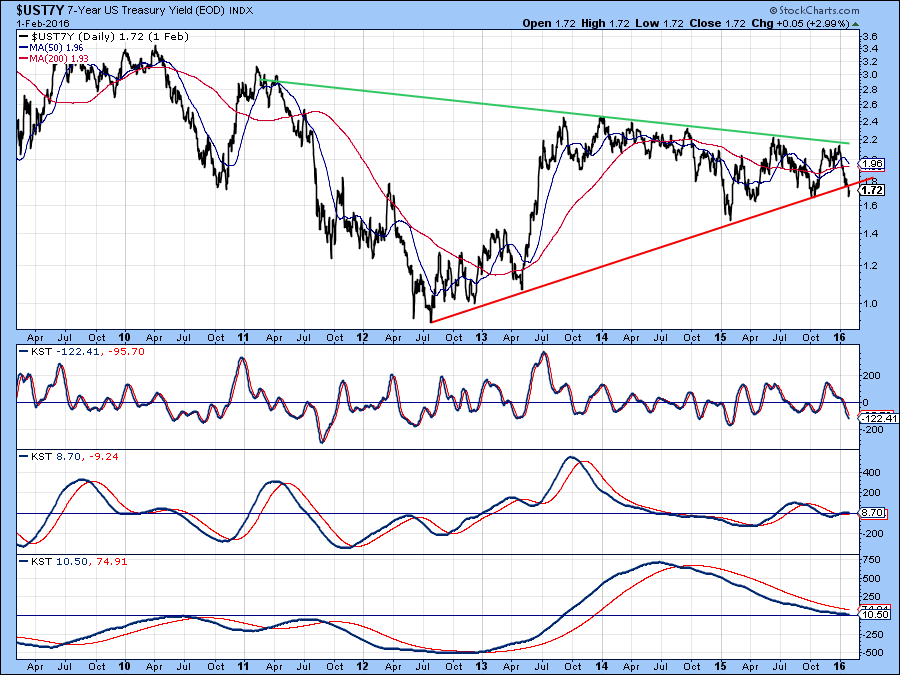
Chart 6
Chart 7 compares the 2-year ($UST2Y) to the 30-year ($TYX). We can see that the 2-year series started to anticipate Fed actions two years ago by rising. During that whole period the 30-year series, expecting more deflationary conditions, has looked through the rise in short-term rates and concluded that conditions are too weak to justify such an advance. The 30-year series ($UST30Y) recently broke down from an upward sloping head and shoulders pattern. Only the long-term KST is pointing to higher yields but this indicator is finely balanced, which means that any additional weakness will likely result is a sell signal for rates.
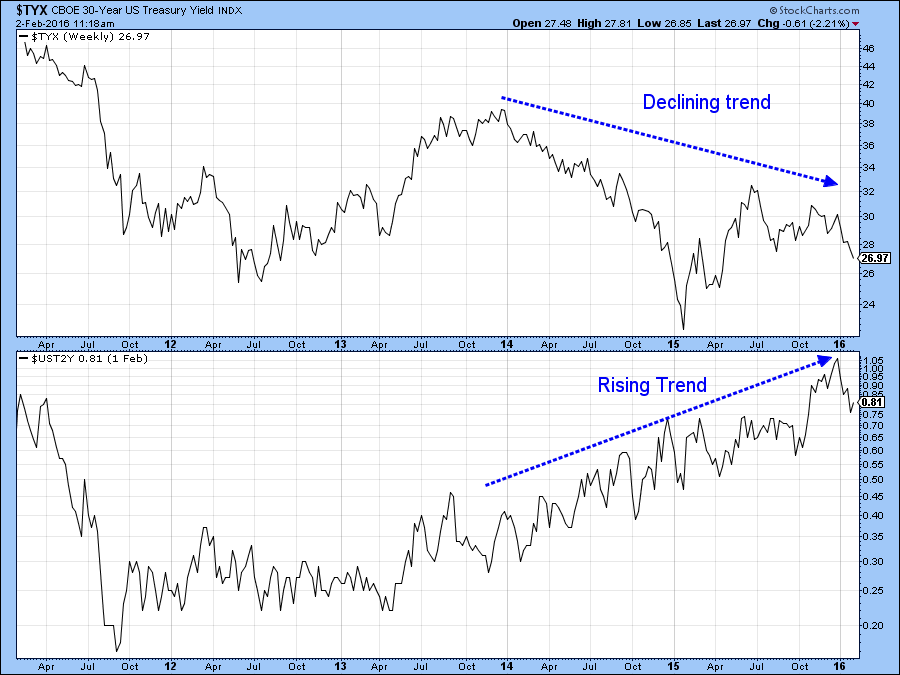
Chart 7
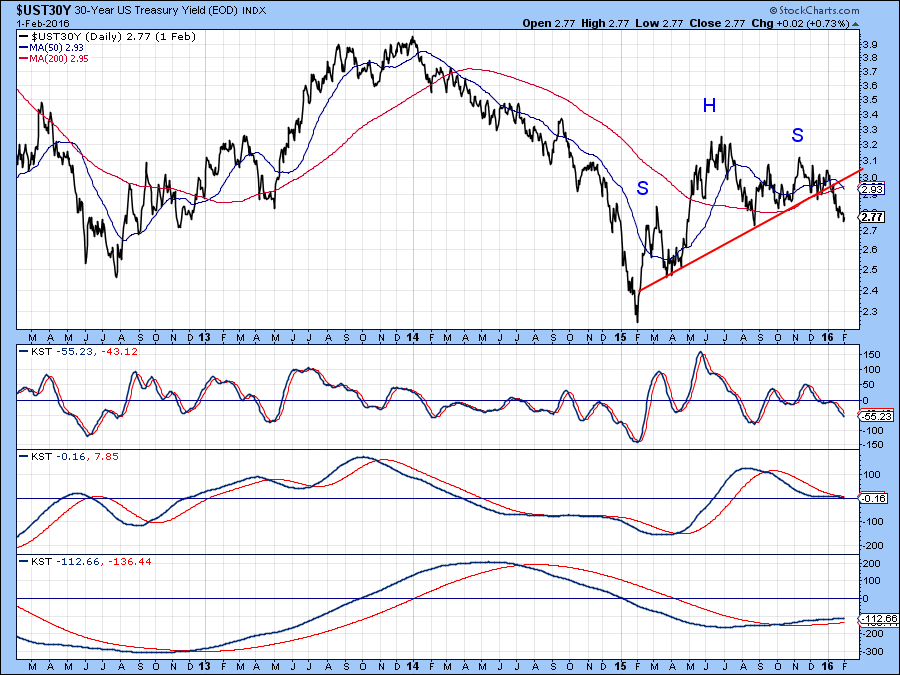
Chart 8
Interest-sensitive sectors showing superior relative strength
Let’s fast forward to the stock market and areas that will benefit from lower rates. One sector that recently stood out as impervious to the general decline is the Utilities, shown here in Chart 9. As you can see the Spider Utilities (XLU) have just completed a reverse head and shoulders pattern. It’s true that its long-term KST is bearish, but whatever happens, this ETF is likely to out-perform the market. We can see that possibility from the huge breakout by the relative line above its 2009-2016 down trendline. Note that the KST for relative action has gone bullish and is by no means overextended on the upside.
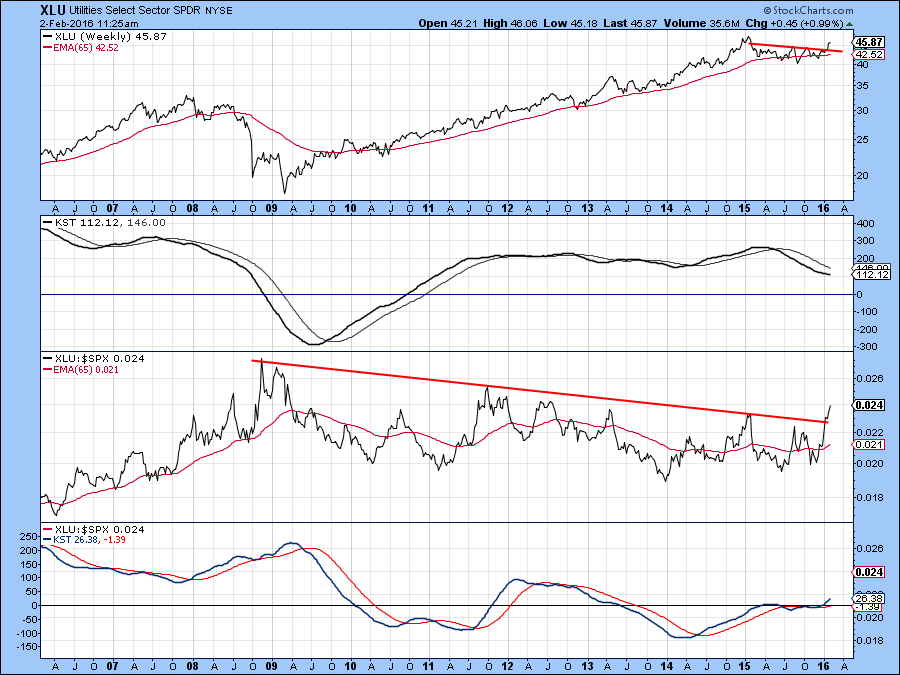
Chart 9
REITs are another beneficiary of lower rates and Chart 10 shows one of the better acting ETF’s. This is the FTSE NAREIT Residential ETF (REZ). Note that this series has recently broken out from a small inverse head and shoulders and the long-term KST for relative action is bullish.
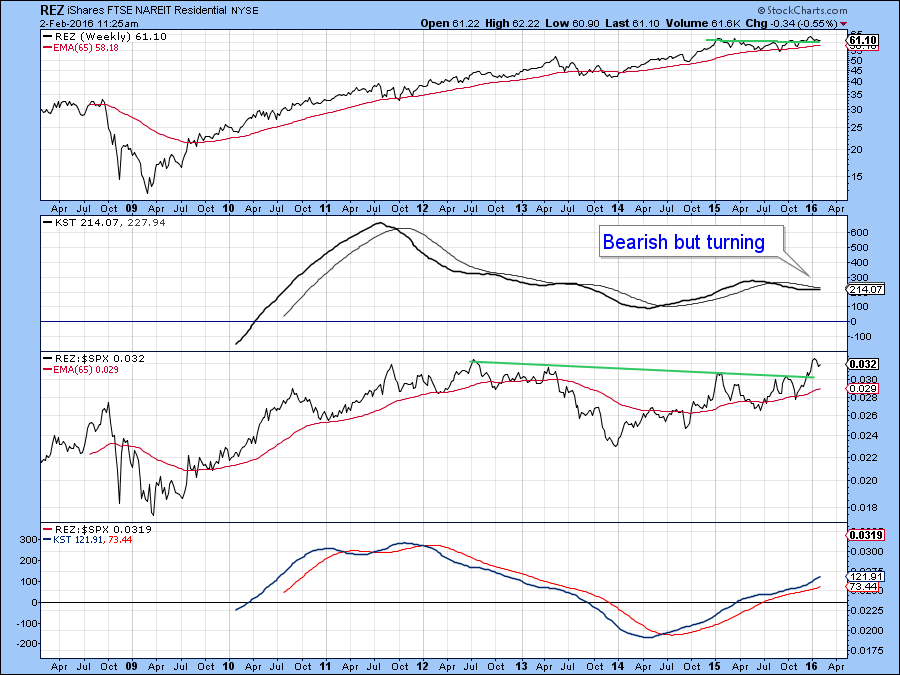
Chart 10
Two sectors showing deteriorating relative action
The relative action of utilities may have broken a long-term down trendline but financials, in the form of the Dow Jones Financial RTF, the IYF, have experienced a completely different technical event. That’s because the RS line has just experienced a violation of its 2009-2016 up trendline. This is likely to turn the long-term KST for relative action into a bearish mode. Note also, that the price itself violated its bull market trendline some time ago and has recently completed a 2-year top. The long-term KST is also in trouble, all of which suggests that financials should be avoided.
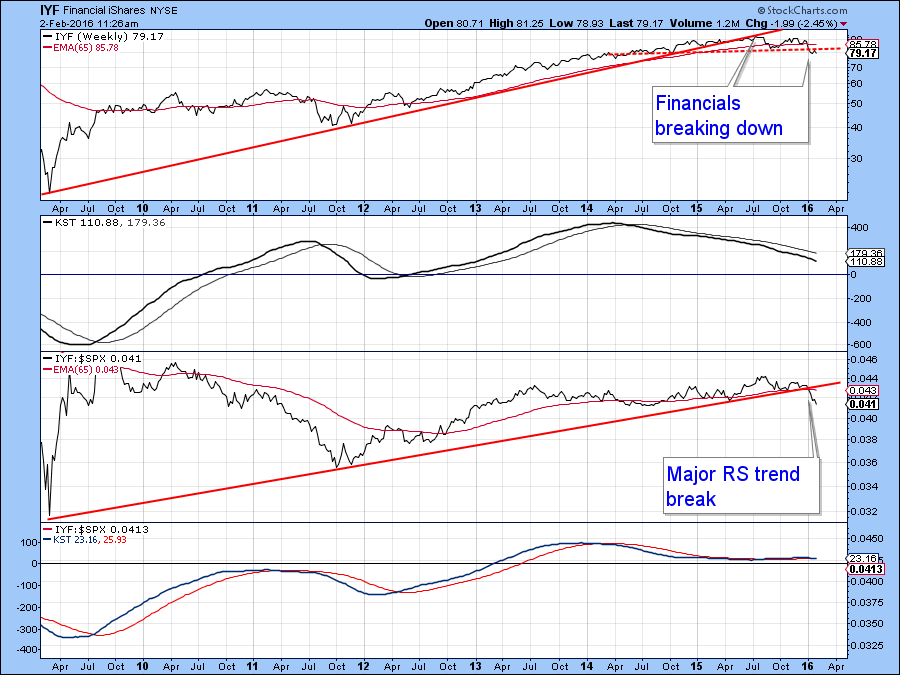
Chart 11
Healthcare has been a stalwart performer for many years but the RS line for the Spider Healthcare ETF, the XLV, has recently penetrated its 2011-16 up trendlines. The price itself has also violated a similar line and completed a top. Since both long-term KSTs are in a bearish mode it seems likely that this sector will also under-perform in the period ahead.
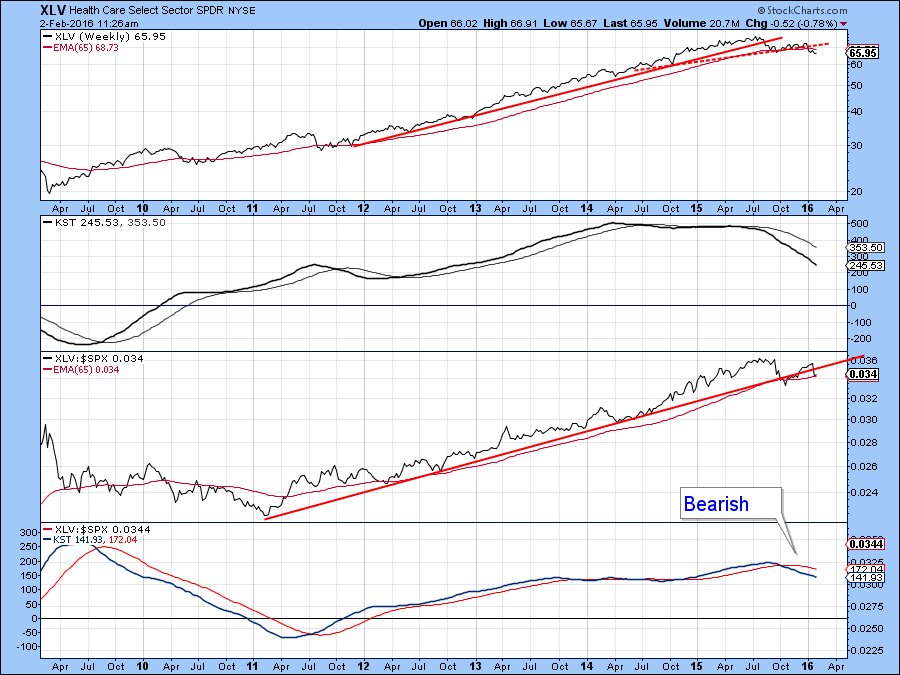
Chart 12
I will be presenting more information on my Market Round-Up webinar on Tuesday (today) at 5 PM EST. Click here to register. Market Round Up - Live.
Good luck and good charting,
Martin J. Pring
The views expressed in this article are those of the author and do not necessarily reflect the position or opinion of Pring Turner Capital Group or its affiliates.


