Turnaround Thursday: Several Markets Reverse On The Day: What Are The Implications?
- Stocks show signs of a near-term reversal
- What about those bonds?
- Gold showing signs of tiredness
Stocks show signs of near-term reversal
On Thursday, several markets started off strongly in one direction but by the end of the day, these same markets reversed course. Normally when one market or an isolated sector experiences this type of phenomenon, it only influences the securities concerned. However, when a number of sectors experience the same phenomenon, the significance of the move increases with numbers. One thing we do need to bear in mind though, is that one day’s action does not a new trend make. However, one and two bar price patterns such as those that developed on Thursday can have an effect for between five and ten sessions and can tip the balance of an otherwise indecisive trend.
Chart 1 for instance, shows that Thursday’s action for the S&P Composite ($SPX), when viewed through the lens of Japanese candlesticks, was an engulfing day. I think the signal would have been more credible had the volume expanded to any great degree but you can’t have everything. There is no doubt that Thursday’s open and close engulfed those for Wednesday. The $64,000 question is whether the engulfment will be strong enough to allow prices to rise sufficiently to reverse the recent KST sell signal. If so, we may well see the price re-assert the early June breakout. In the immediate future, you can see that the opens and closes of the last few days have been caught between the two parallel lines. I would say that if an open or close takes place below the red line then all near-term bullish bets would be off. On the other hand, a rally through the green line on an open or close basis would confirm the bullish action of the engulfing pattern.
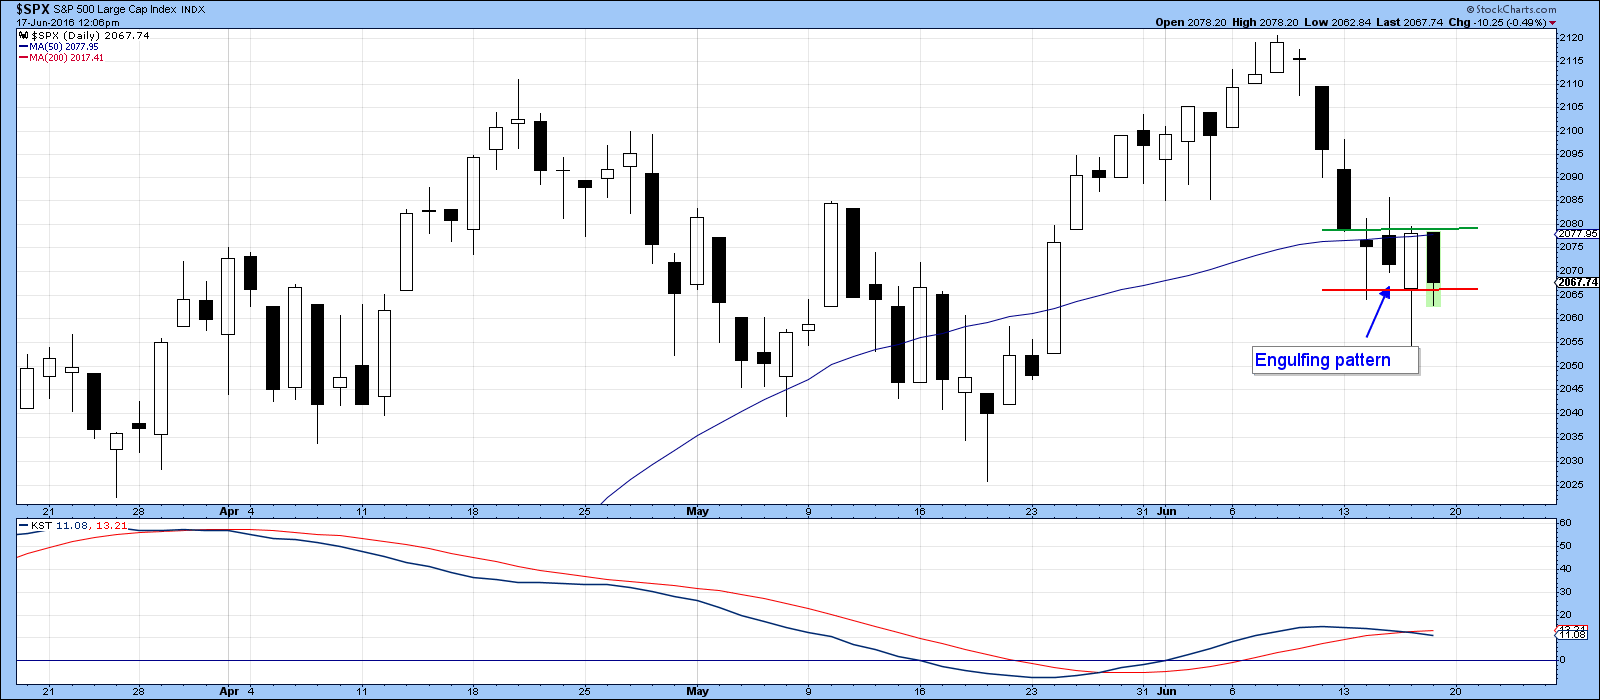
Chart 1
Chart 2 features the NYSE Composite ($NYA). Here again, we see a fine balance between the opens and closes in the green rectangle. However, a gap appeared on the chart 6-days ago. Gaps are almost always filled, or at least a worthwhile attempt is made to do so. Generally, that gap closing event develops within a relatively short period of time, which suggests higher prices may materialize from the engulfing reversal.
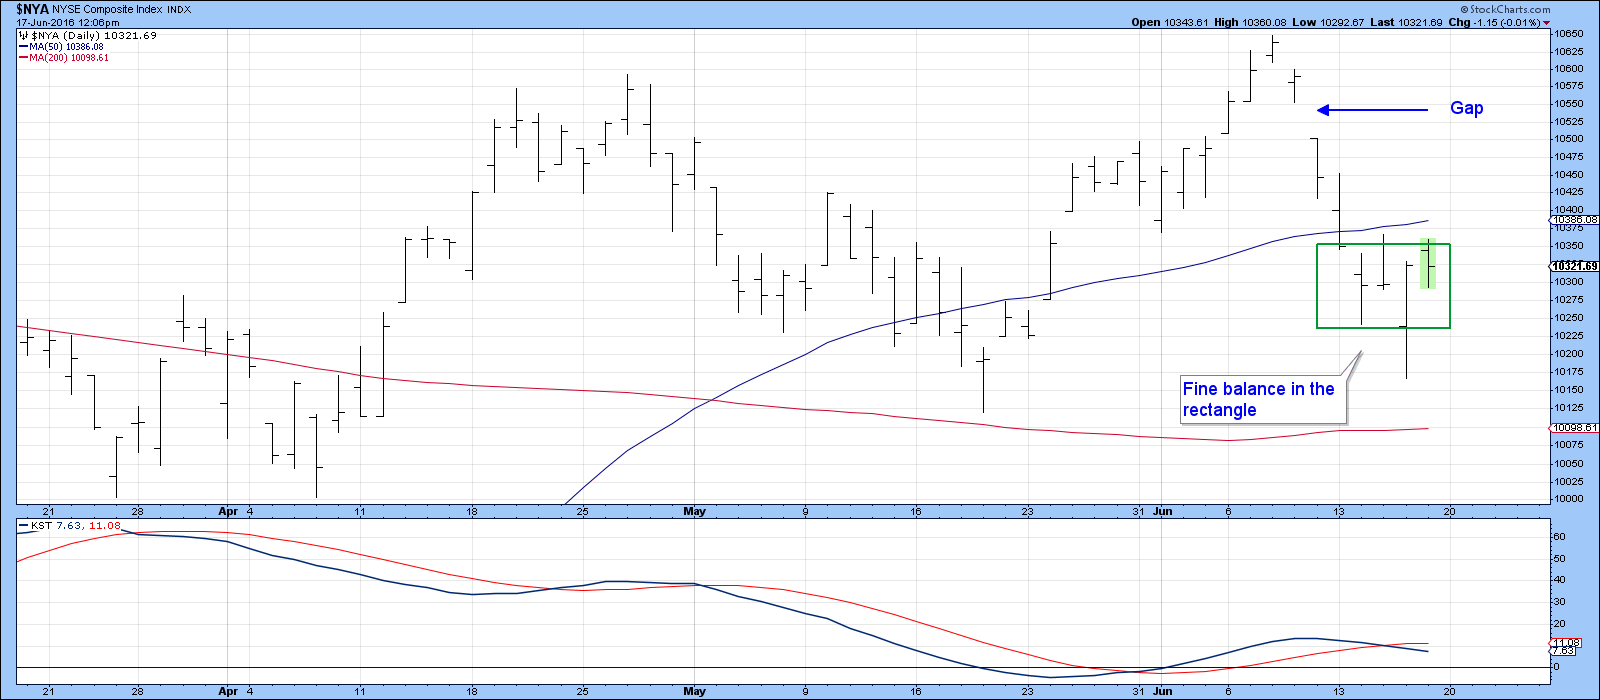
Chart 2
Chart 3 shows some reversal phenomena for the Dow Jones Transports ($TRAN), a doji and a bullish shooting star. These patterns are not significant enough from which we could call a major rally, but they are certainly sufficient to tip that very fine balance in the short-term KST to the bullish side.
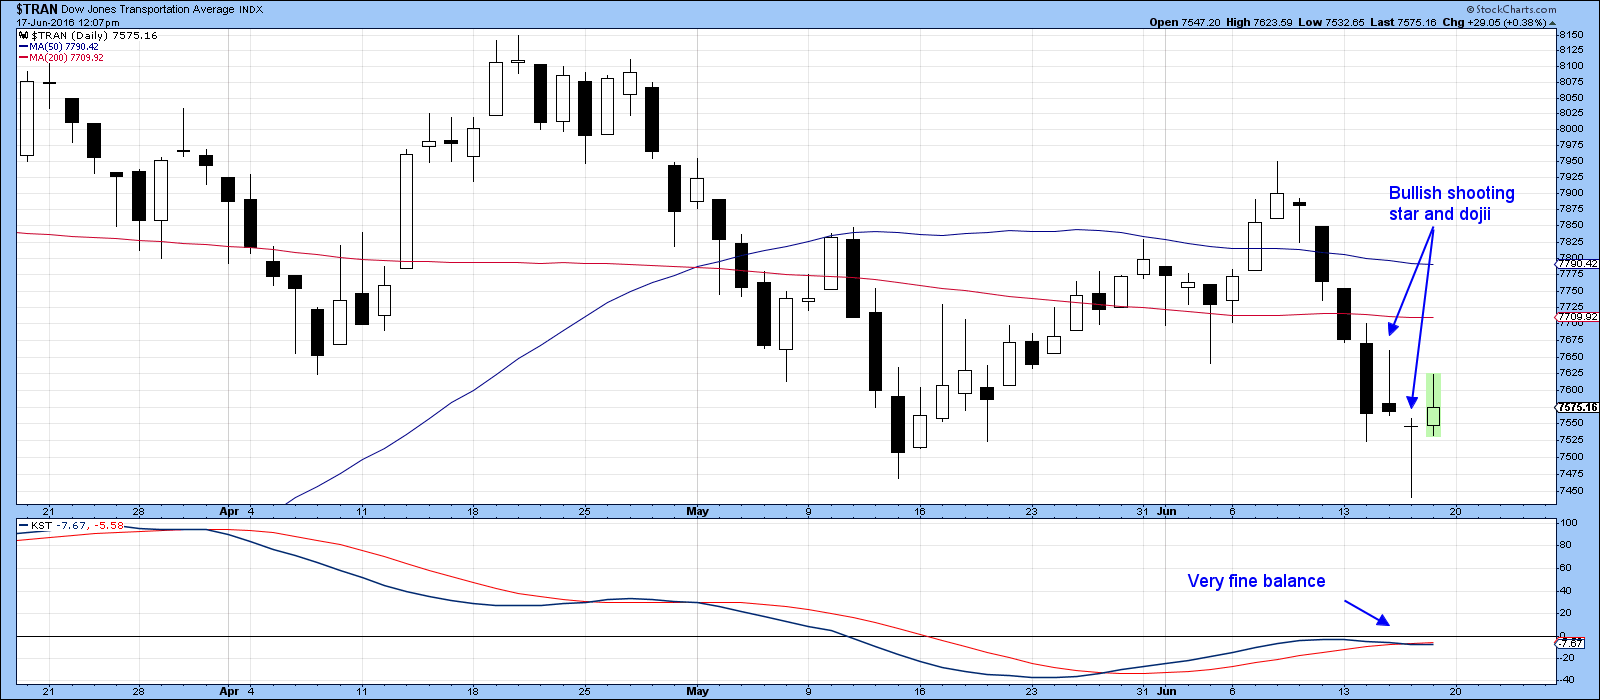
Chart 3
Chart 4 shows the longer-term picture where it is evident that the S&P, NY Composite and MSCI World Stock Indexes (ACWI) may be in the process of tracing out large inverse head and shoulder patterns. If they do, that would obviously be very bullish. It is not impossible that the reversal phenomena in the first four charts could have sufficient power to launch a rally of sufficient strength that would at least challenge those potential green necklines.
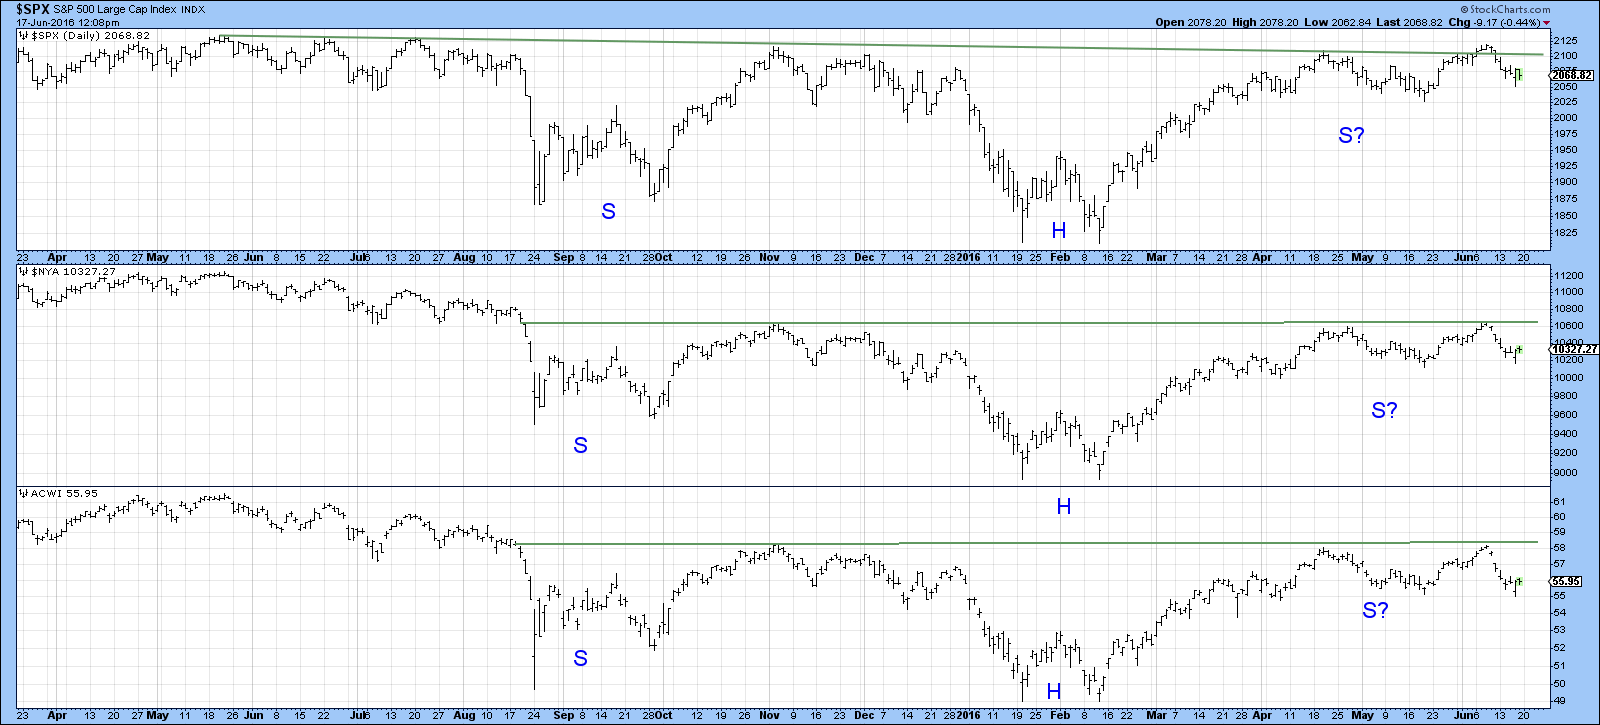
Chart 4
What about those bonds?
Chart 5 examines the technical picture of the 7-10-year treasury ETF, the IEF. Bonds have recently had a tendency to move in the opposite direction to equities, so Thursday’s exhaustion bar is consistent with the bullish action of stocks. We can also see that Thursday’s trading, whilst not record shattering, was definitely heavier than recent sessions. Strong volume on an exhaustion day adds to the significance of the pattern because it means that more buyers are locked in with a loss than if the level of activity was lower. Note that the KST has started to stall a bit. If I am correct about bonds experiencing a very near-term correction, that should result in a sell signal for this momentum indicator. Finally, the chart shows that the price experienced a large gap at the beginning of June. According to the rules that gap is likely to be closed at some point.
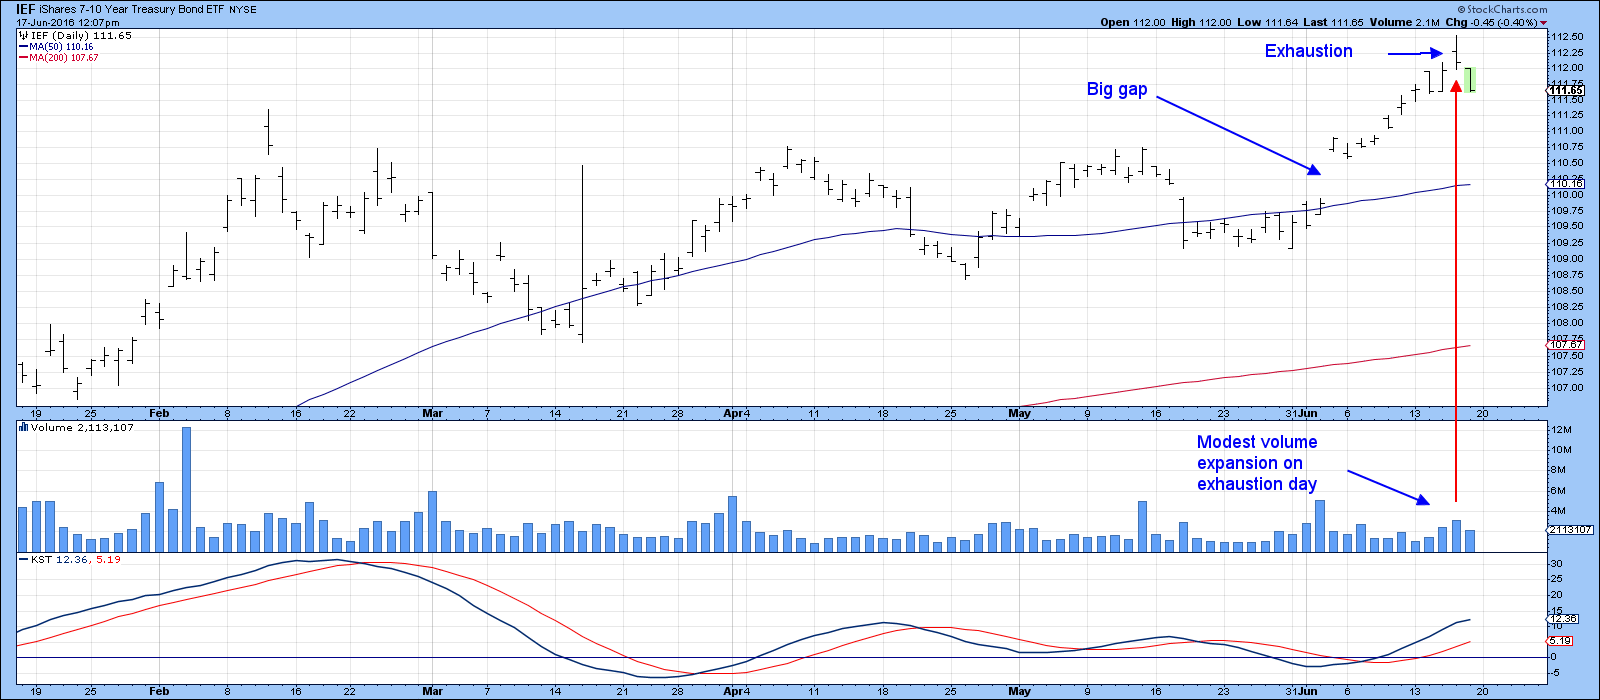
Chart 5
Chart 6, of the Barclays 20-year Trust (TLT), confirms the bearish action of the IEF in that Thursday’s action for the TLT takes the form of a bearish shooting star. I have used the western bar chart format in this instance because it brings out the fact that the price has now violated the June up trendline. It’s not a very significant line in and of itself. However, when combined with the shooting star, it does suggest that the price will experience a downward or sideways correction. Either would be sufficient to cause the overbought KST to reverse to the downside.
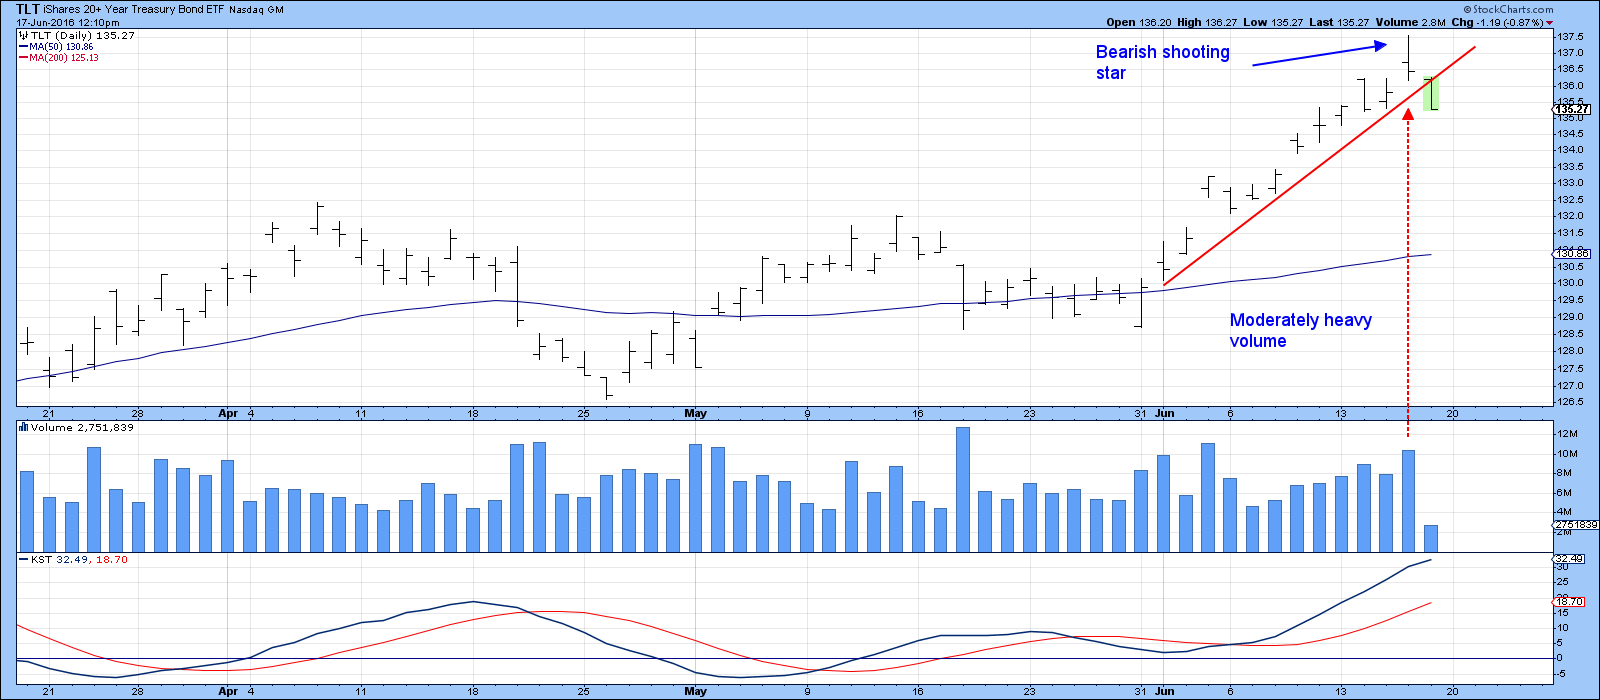
Chart 6
Gold showing signs of tiredness
Chart 7 features the Spider Gold Shares ETF, the GLD. It experienced an outside day on Thursday. It was a significant pattern because the trading range was very wide when compared to its predecessors. Generally speaking, the wider the bar the greater the battle between buyers and sellers and therefore the greater the implied victory. Since the bar was also accompanied by exceptionally heavy volume that again adds to its significance. Having said that, these formations, on their own, do not have a long-term impact. Consequently, I would look for a correction that closes at least one of the gaps highlighted in the chart. This action has no implications for the long-term trend, which remains bullish.
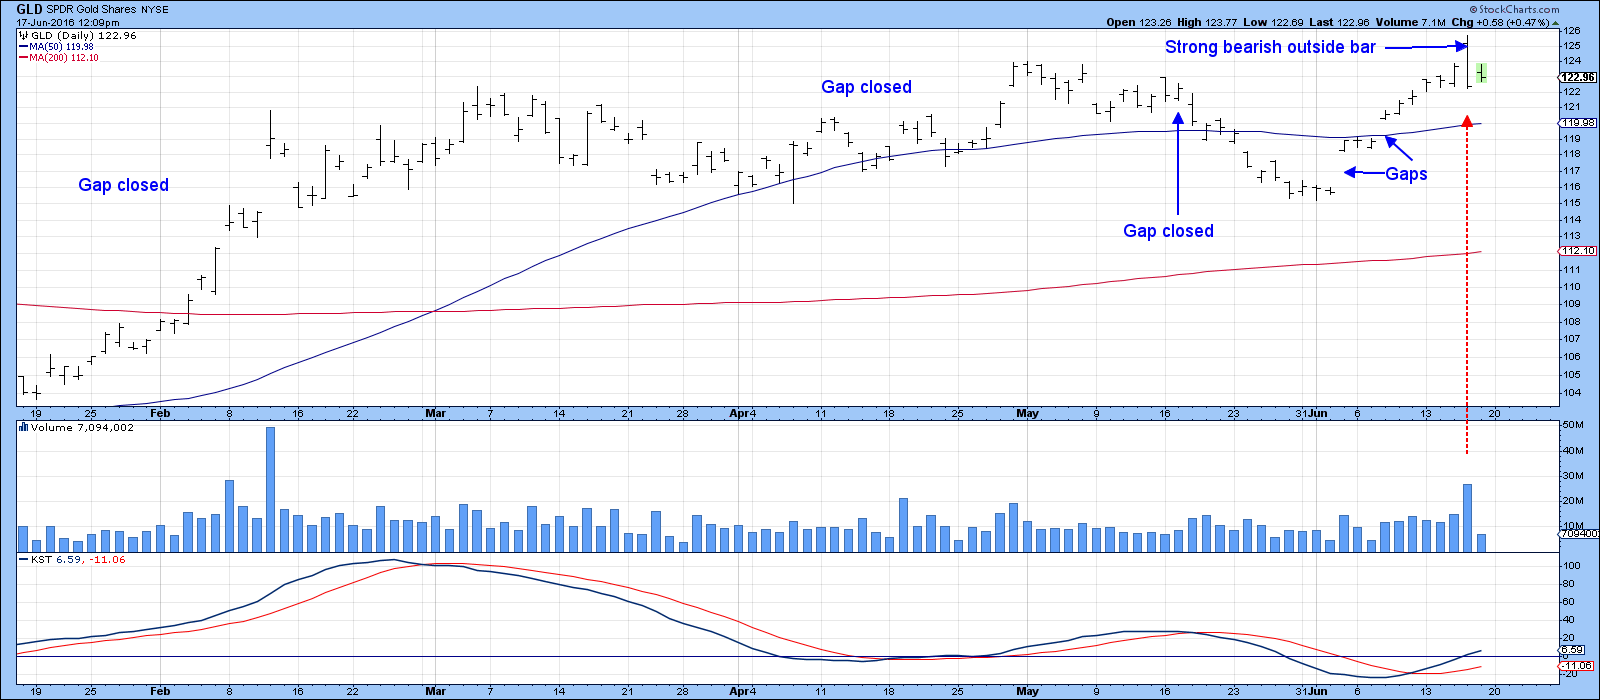
Chart 7
During the recent rally, the Junior Gold ETF, the GDXJ, has been a stronger performer than its GDX counterpart. However, Thursday’s action seems to confirm the negative experience of the gold price itself. First, the price experienced a false break above the green resistance trendline. Second, Japanese candlesticks show that Wednesday and Thursday combined to form a bearish dark cloud cover. These patterns develop when, following an advance, the second candle (Thursday) opens beyond the trading day of the first (i.e. Wednesday) and closes more than halfway down the real body of the first. That certainly happened with the GDXJ and it now looks as if it will soon challenge its' 2016 (red) up trendline and 50-day MA. That line is currently just under $36.
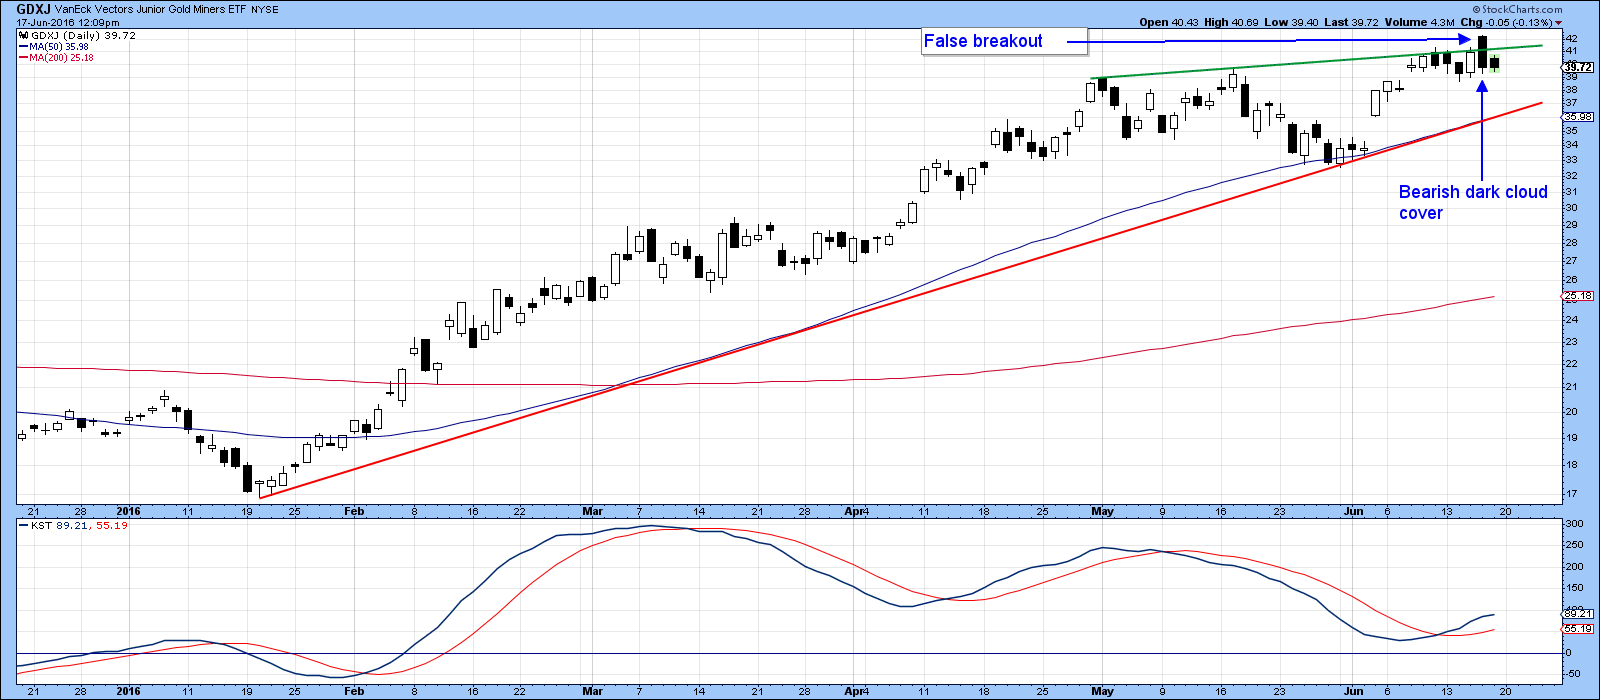
Chart 8
Good luck and good charting,
Martin J. Pring
The views expressed in this article are those of the author and do not necessarily reflect the position or opinion of Pring Turner Capital Group or its affiliates.


