Are Commodities About To Take Off?
- The long-term trend
- Shorter-term aspects
- The stock market’s view
Several weeks ago I suggested that commodity prices were likely to experience a correction of some kind. I also felt that any digestive process might well take the form of the right shoulder of an inverse head and shoulders pattern that seemed to be developing for most commodity indicators. Well, we have seen a bit of a correction play out since then, so it’s time to review that right shoulder possibility again.
The long-term trend
First let’s take a look at the long-term trend, where pretty well all of the indicators are pointing to a primary bull market. For example, Chart 1 shows that the Coppock Indicator for the CRB Composite. It’s by no means perfect, but sub-zero reversals to the upside have had a pretty consistent record of being correct since the 1960’s. I count 14 initial decisive reversals, of which only 3 were failures. They developed in 1967,1985 and 1991. A rising Coppock does not guarantee a bull market but it does put the odds in favor of one.
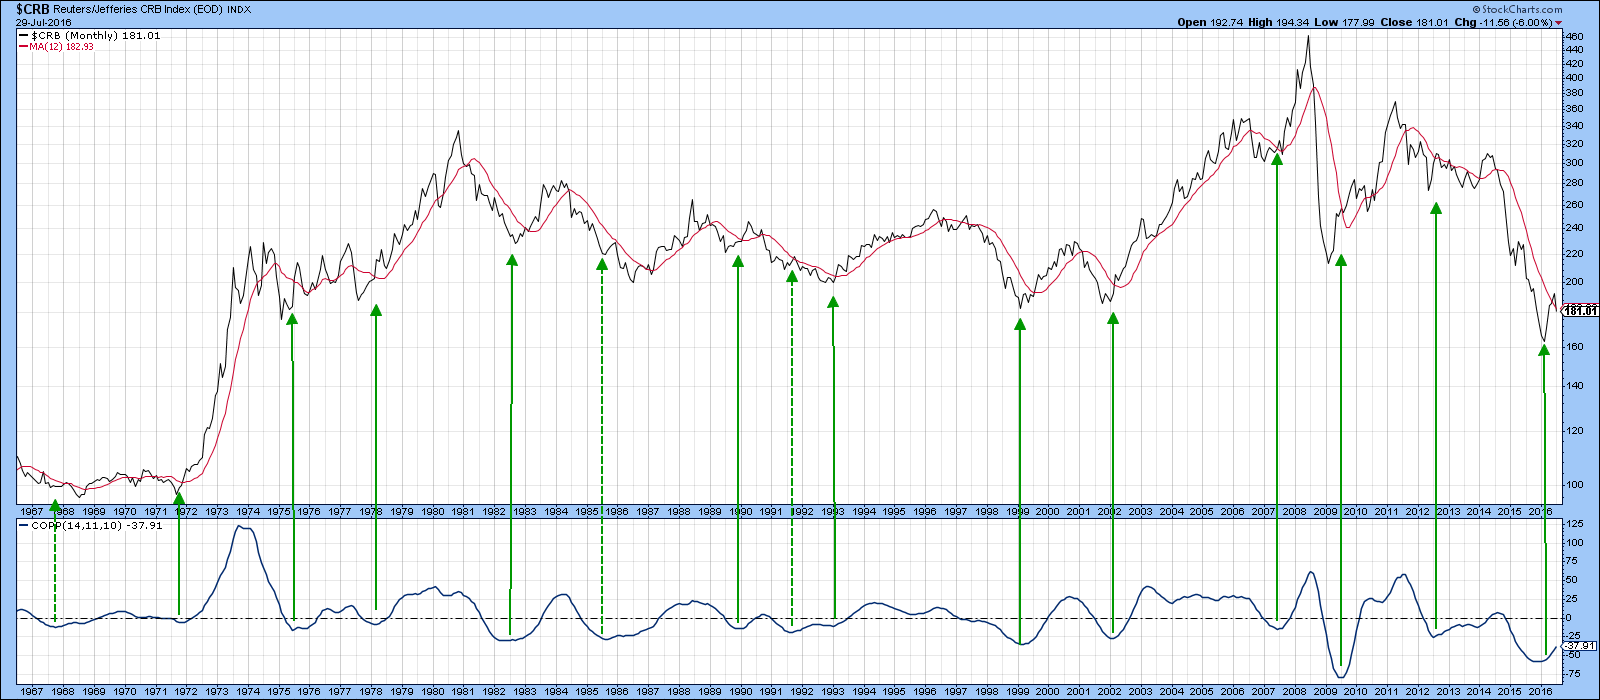
Chart 1
Second, my Special K (SPK) indicator, has given a long-term buy signal by achieving two things. First, we have seen a violation of the 2014-16 down trendline for both the price and the SPK. Previous combinations shown on the chart have mostly been followed by worthwhile rallies and declines. One noticeable exception developed in 2014, and that was followed by a very weak, false rally. Second, the green arrows show when the SPK has crossed above its MA. That MA is a 100-day SMA, smoothed by another 100-day MA. We have seen five other signals of this nature since 2002 with only one failure, that of early 2014 again. Right now it looks as if the SPK may be in the process of tracing out a reverse head and shoulders pattern, but only time will tell on that one.
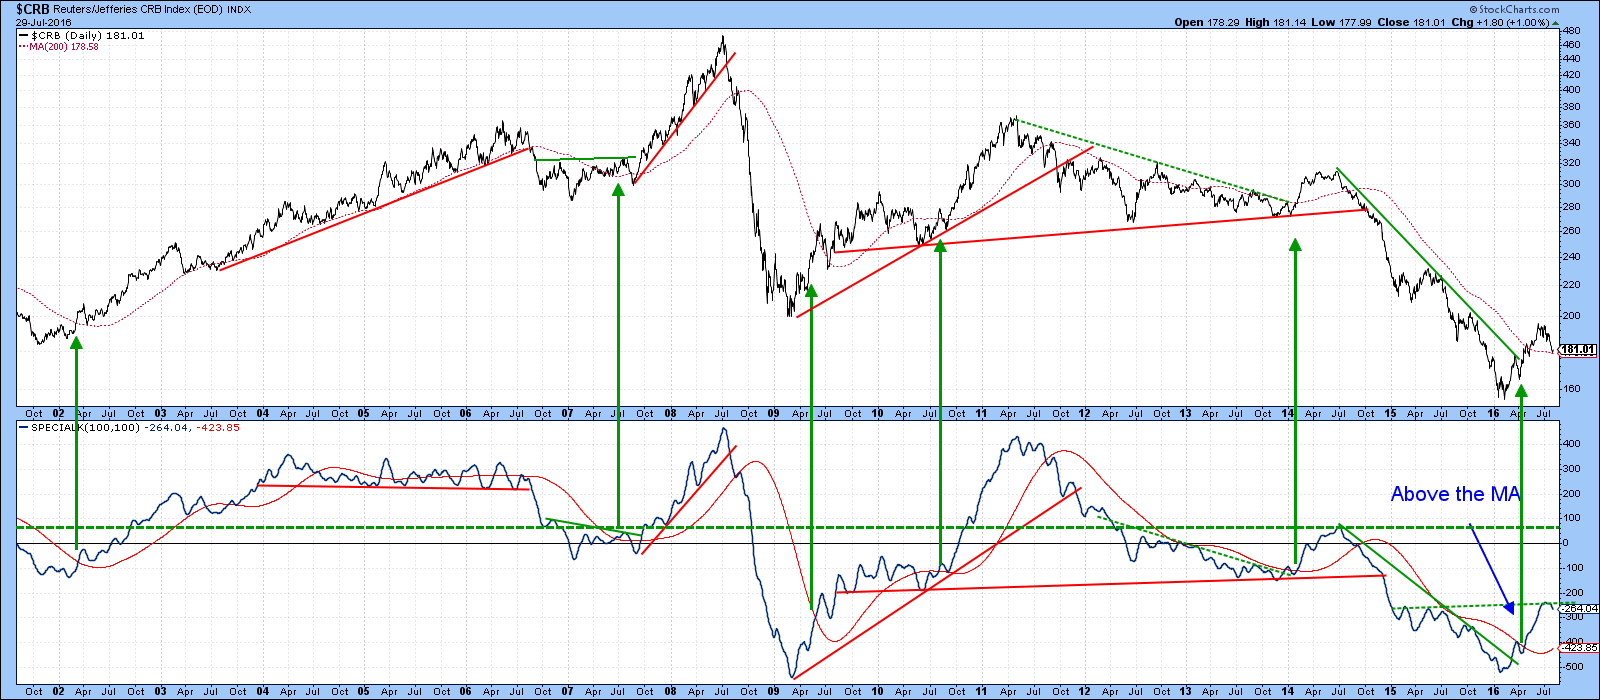
Chart 2
Finally, Chart 3 compares the CRB Spot Raw Industrials to an 18-month ROC. The arrows indicate those rare occasions when the Index has fallen to or below the -20% level and subsequently reversed to the upside. There have been 10 instances since the 1940’s, of which only 2, in 1999 and 2012 failed to deliver a primary bull market. In those examples, the price advanced for a while and then went sideways for a year or two. An eleventh signal was triggered late last year, which again suggests that commodity indexes, whether broadly based such as the CRB Composite, or those confined to economically sensitive commodities, as included in the CRB Spot, are in a primary bull market.
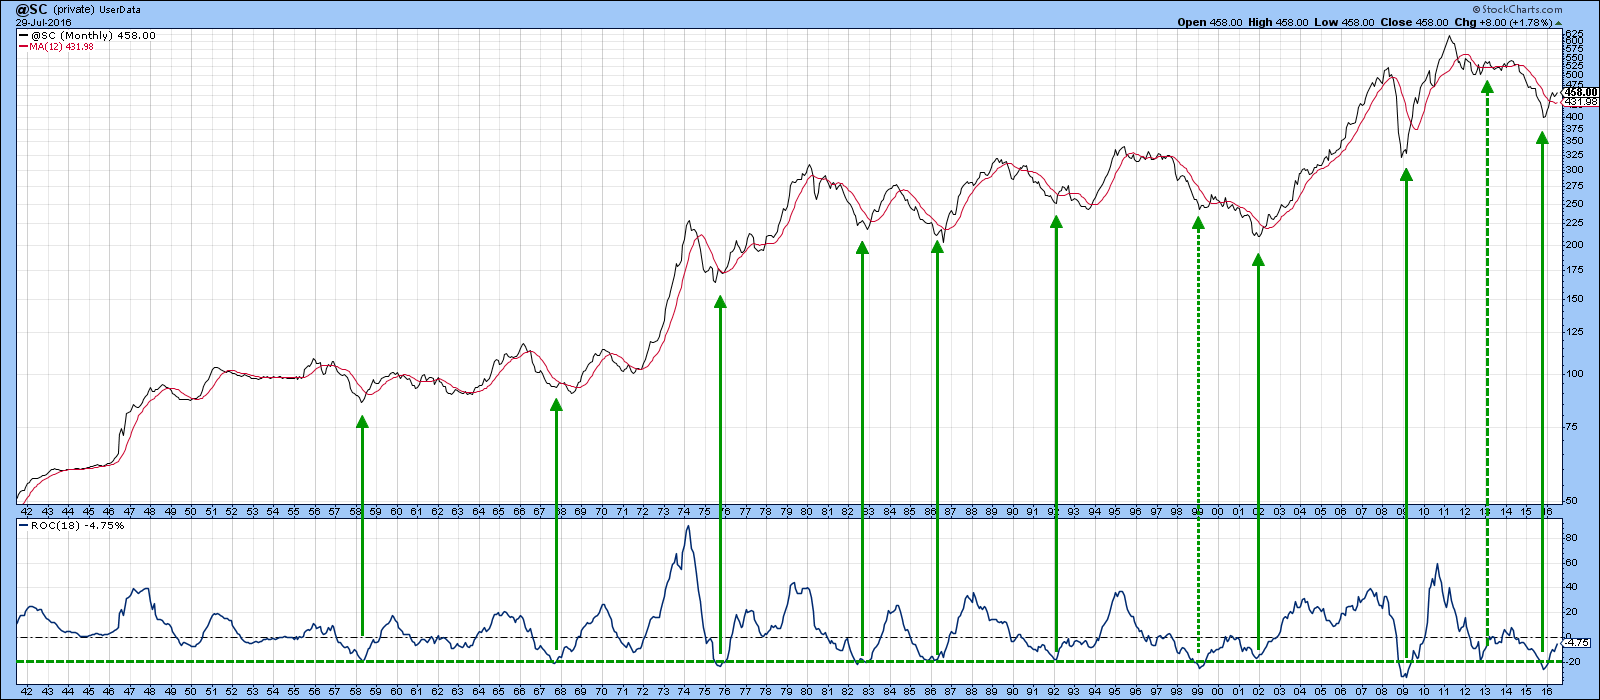
Chart 3
Shorter-term aspects
Now let’s take a look at some shorter-term charts to see whether there is a chance that the commodity correction is over. Chart 4 focuses on the DB Commodity ETF (DBC). It looks as though it may be in the process of tracing out a reverse head and shoulders pattern. Of course, looking like and actually doing are two distinct things. That’s because a completion would require a decisive daily close above the green potential neckline at $15.50. Currently, the KST is bearish and moderately oversold but the price is also below the dashed red up trendline, which is a negative. However, an important test is likely to develop in the very near future. First, the price is just a bit above its 200-day MA, where it should find support. If it breaks decisively below the MA that would be unfortunate, because such action would be slightly out of character with a bull market scenario painted earlier.
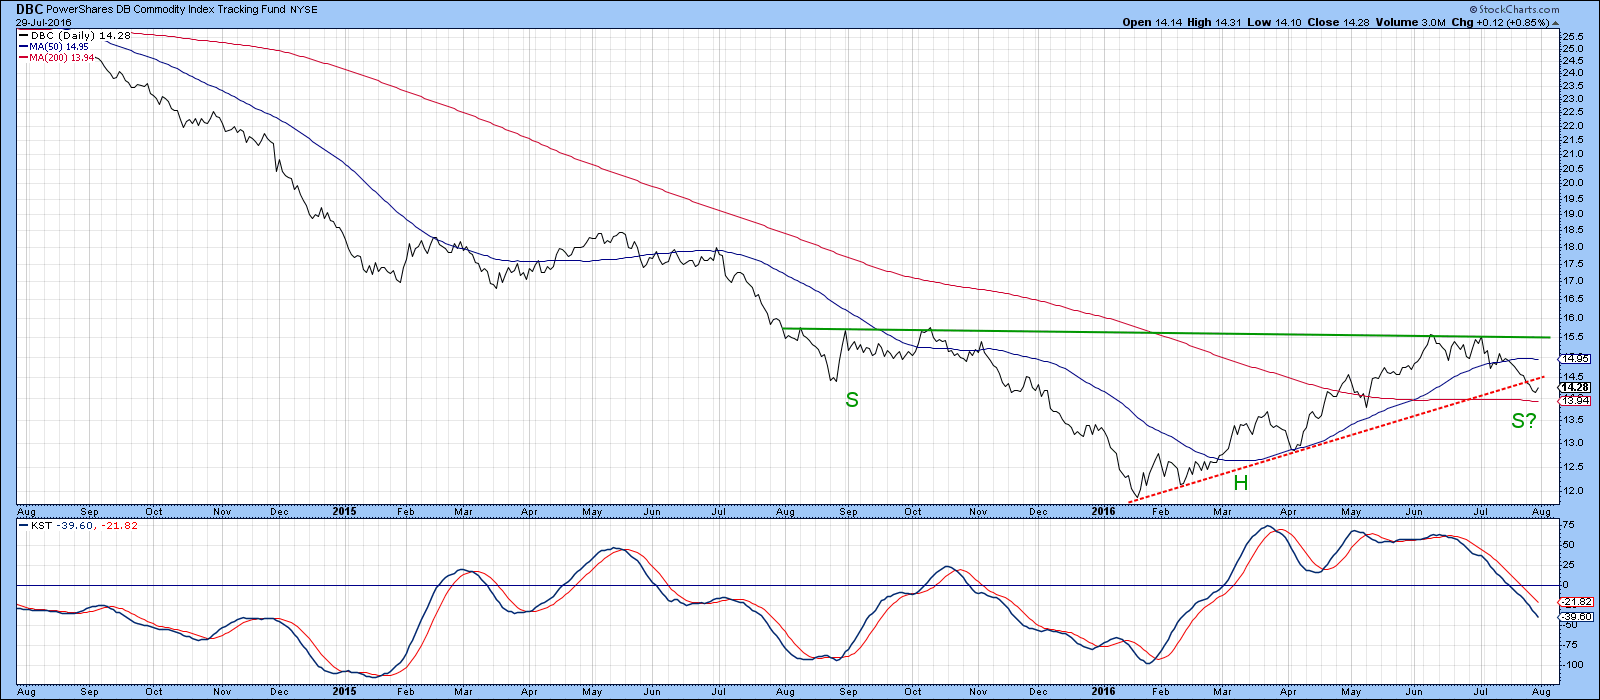
Chart 4
Charts 5 and 6 though, show that things may be about to turn. That’s because both the CRB Composite and the DBC experienced outside days on Friday. In the case of the CRB, we can also see that the price, having opened below the MA, closed substantially above it. This action only has a positive effect for 5-10-days under normal circumstances but that should mean that the PPO in the lower window experiences a much stronger reversal.
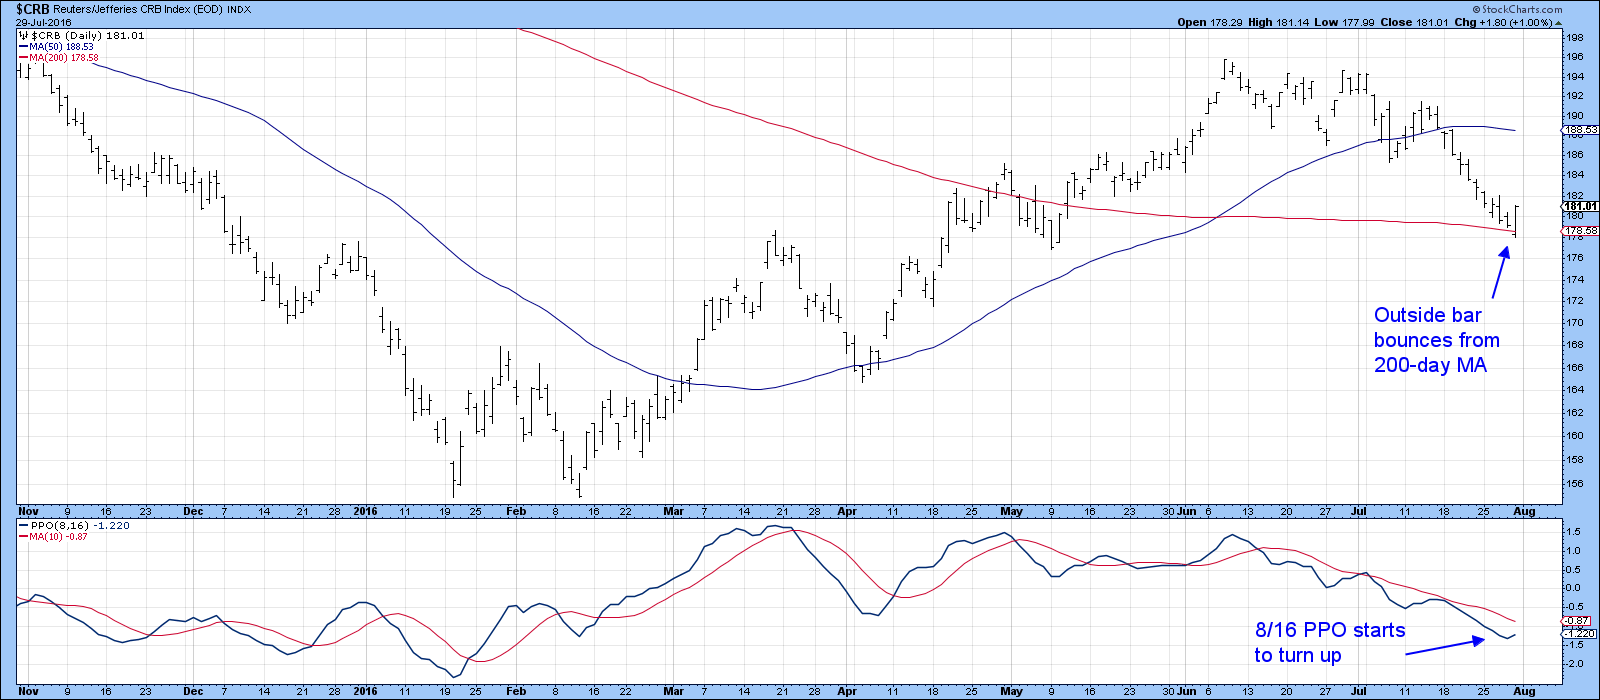
Chart 5
Chart 6 shows that the DBC also experienced an outside day in which volume picked up, thereby adding slightly to its significance. In the case of the DBC, the price is still above the 200-day MA but remains below the July down trendline as does its 12-day ROC. I believe that the opening week in August could be a pivotal one for commodities. If the two trendlines in Chart 6 are violated on the upside, this will validate the outside days and suggest that prices are headed higher. On the other hand, a drop below Friday’s low would nullify the outside day and argue for lower prices.
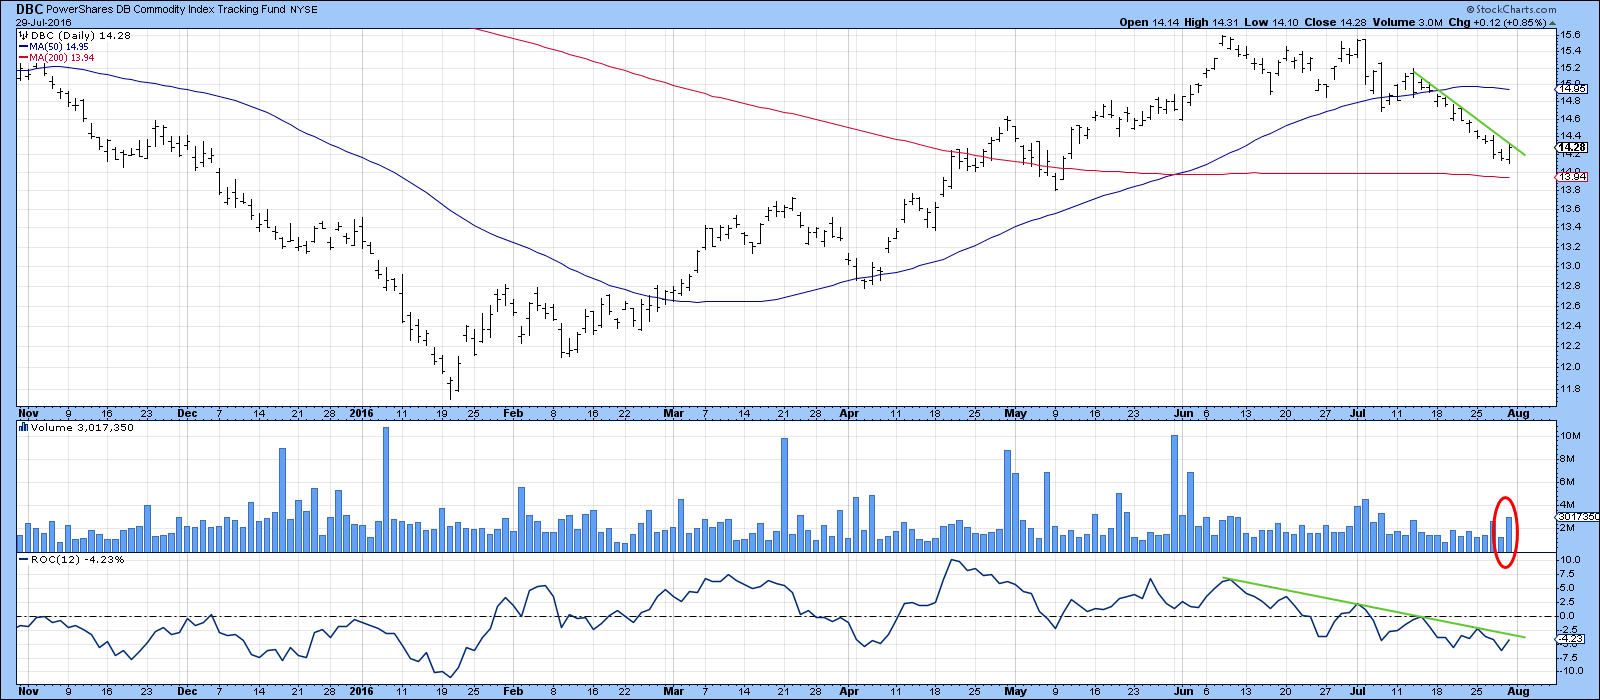
Chart 6
Chart 7 features the Bloomberg Commodity ETN, the DJP. It is also showing signs of bottoming, but in its case in the form of a three bar reversal. These patterns consist of two wide bars separated by a narrow one. The first wide bar opened on Wednesday near its high but closed near the low. Thursday was very evenly matched as things were very quiet. On Friday prices opened near their low and closed near the high. This indicated a complete switch from bears being on control on Wednesday to a strong bullish undertone by Friday’s close. Once again these patterns have a short-term effect but that may just be long enough for the net new high indicator in the lower panel, to reverse to the upside. A long shot perhaps, but certainly worth looking out for. Remember, if this is a bull market one important characteristic is that corrections are often very mild, quite the reverse from bear markets.
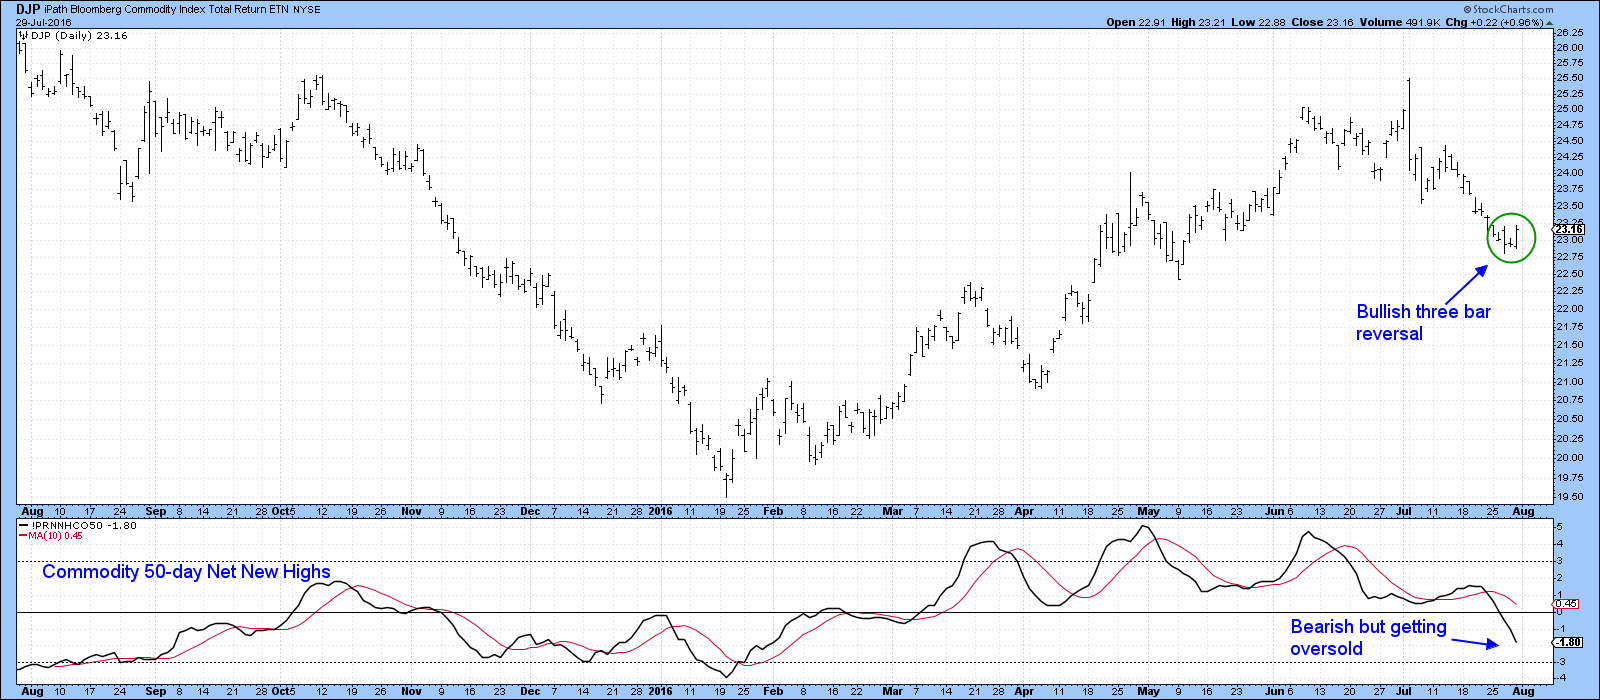
Chart 7
The stock market’s view
Finally, Chart 8 offers the stock market’s view of things. The upper panel features the DBC and the others, two stock market inflation/deflation relationships. The first is the ratio between the Goldman Sachs Natural Resource ETF (IGE) and the Spider Consumer Staples (XLP). The second is the ratio between my Inflation and Deflation Indexes. This series pits an index consisting of inflation sensitive S&P groups, such as mines and energy, to one that is more oriented to defensive areas, such as utilities and preferred shares. The chart shows that both series fluctuate in a similar way the DBC. Since the two stock market ratios are very close to an upside breakout they may well offer an advanced sign that commodities are about to break as well.
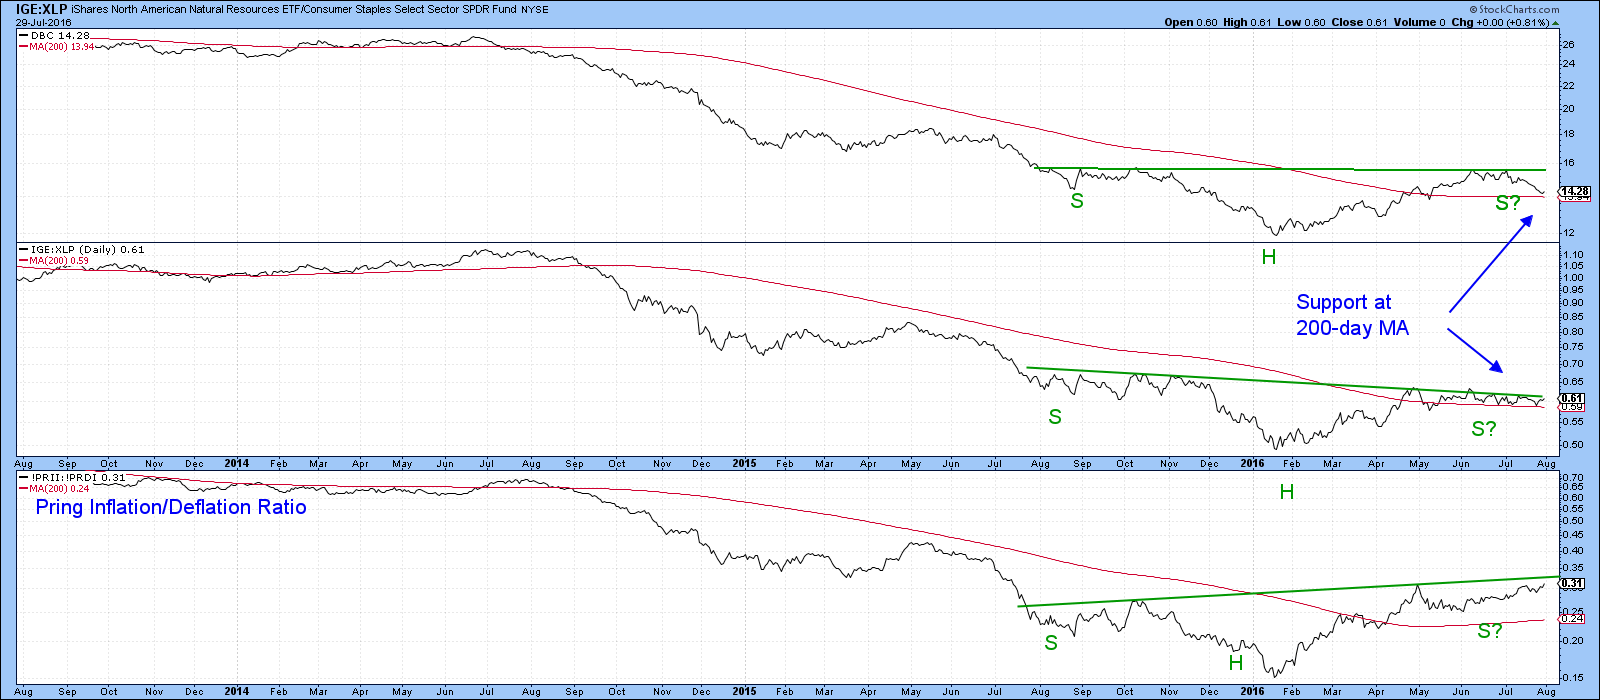
Chart 8
Good luck and good charting,
Martin J. Pring
The views expressed in this article are those of the author and do not necessarily reflect the position or opinion of Pring Turner Capital Group or its affiliates.


