It May Be Time To Get Bullish Again
- Broadening formation is still bullish
- What are the short-term indicators saying?
- What are important intermarket relationships saying about the recent drop?
- Is Dr. Copper about to make a house call?
On balance, the stock market has dropped since early last week, but peripheral price action has been constructive. That leads me to believe that bearish September seasonal tendencies will soon be overcome as prices base out and eventually move higher.
Broadening formation is still bullish
Some time ago I pointed out that the major averages had traced out consolidation broadening formations with a flat top. These are sometimes named right angled broadening formations. An example using the NYSE Composite ($NYA) is shown in Chart 1. The idea is that these formations run into a level of resistance, the right-angled part, and each successive rally is followed by a lower bottom. Thus, anyone trying to “buy” the market keeps getting stopped out as each bottom develops below its predecessor. In effect, it’s a pattern that ends with great pessimism. Since pessimism is the rocket fuel of rallies, this is normally a very bullish situation. Two characteristics of broadening formations such as this come to mind. First, they are very positive, usually having the potential to push prices well above normal expectations. They are really inverse head and shoulders where the price is so anxious to rise that it does not have enough time to form the right shoulder. Second, since there is rarely great reward without risk the ensuing breakout rally is often followed by sharp scary corrections. That’s what I think happened in the last few days.
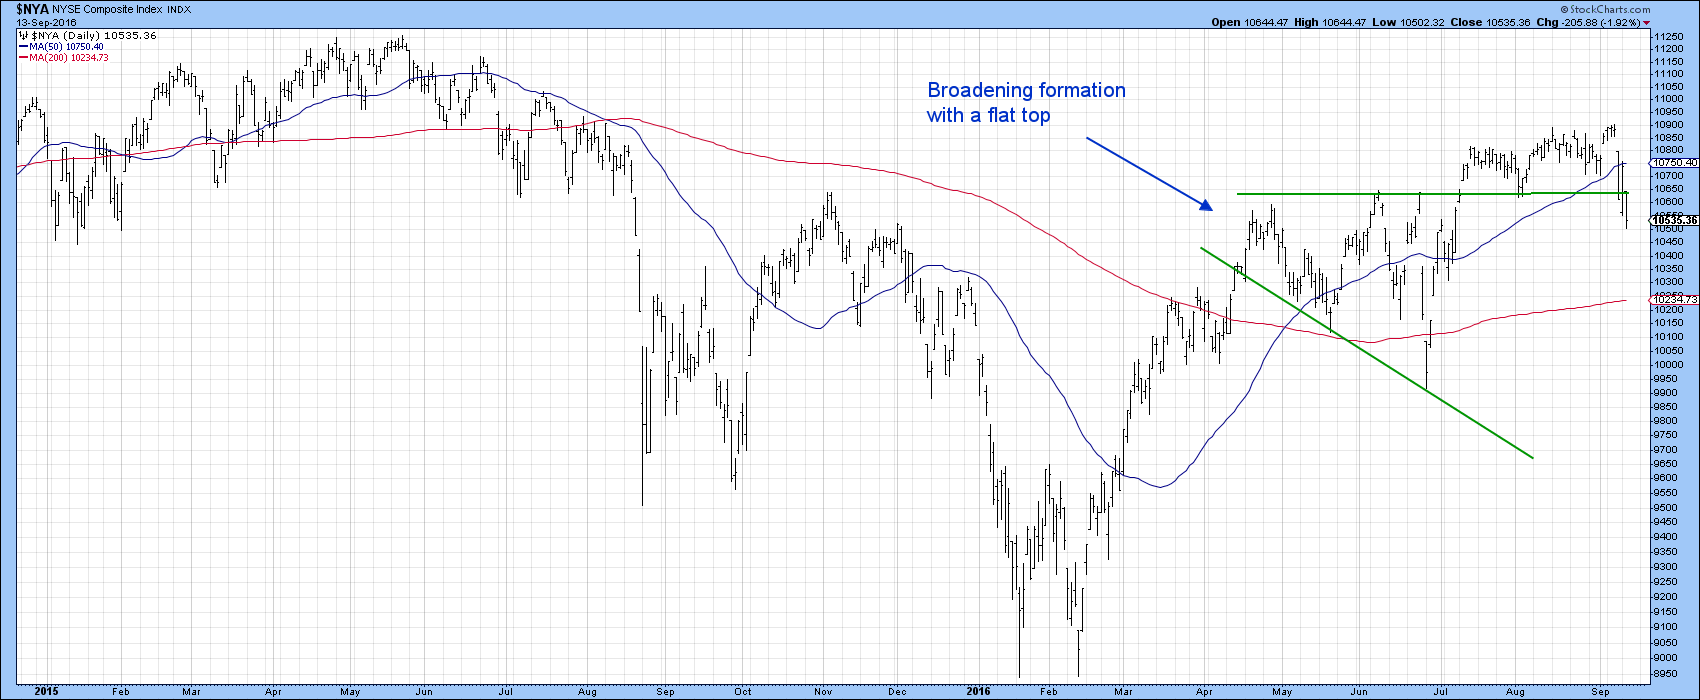
Chart 1
What are the short-term indicators saying?
I need to be a bit careful in this assessment because indicators such as my Dow Diffusion Indicator (!PRDIFDOW), featured in Chart 2 are nowhere near an oversold reading. If this is a bull market, which I believe to be the case, then short-term rallies can easily be signaled from the current type of neutral reading. You can also see that the Dow has reached support in the form of its extended breakout trendline and the 2016 up trendline.
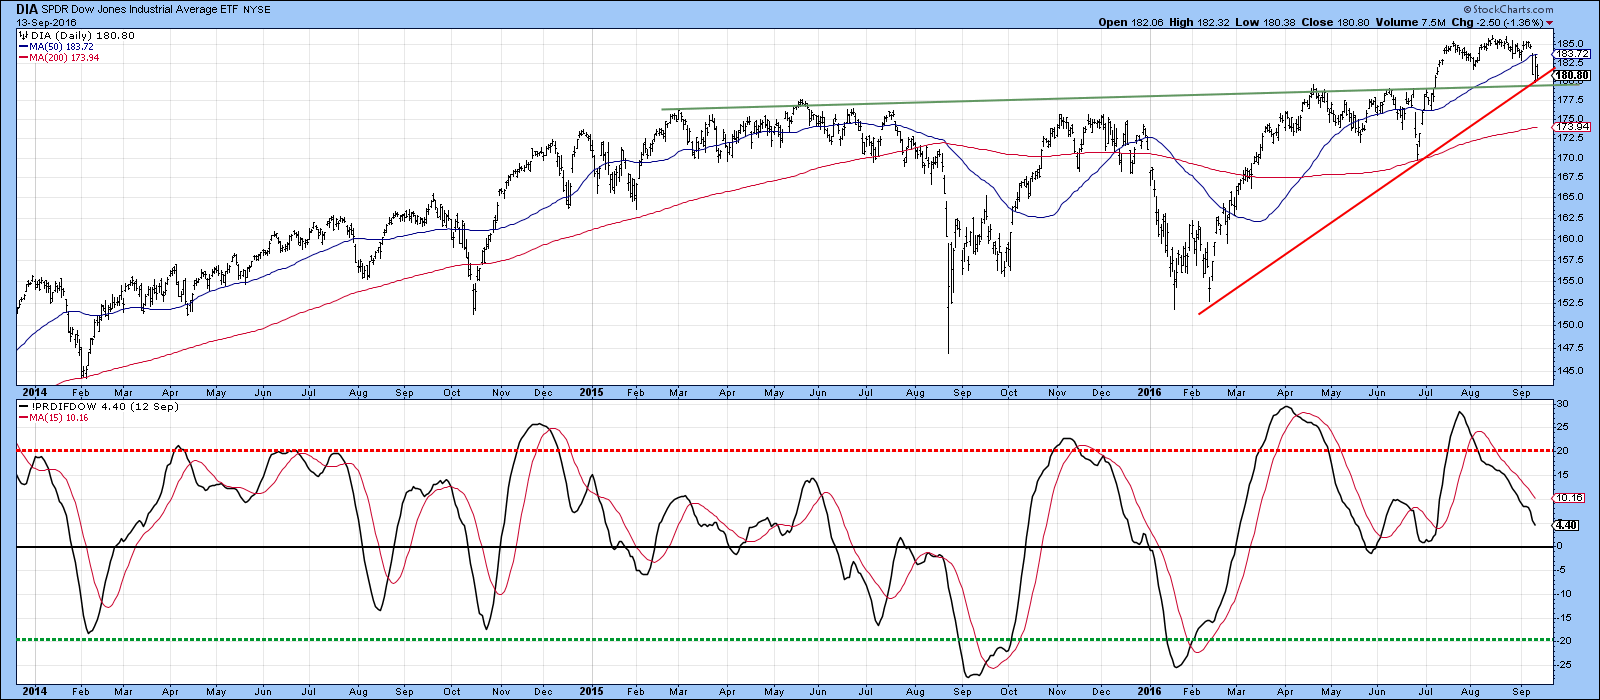
Chart 2
One favorable characteristic lies in the fact that volume has started to expand to selling climax proportions, as shown by the volume histograms. The PVO has also started to rise and is not far-off a serious selling climax reading. The green arrows in Chart 3 show recent climaxes, all of which were followed by a rally of some type. The red arrow flags a bearish-buying climax.
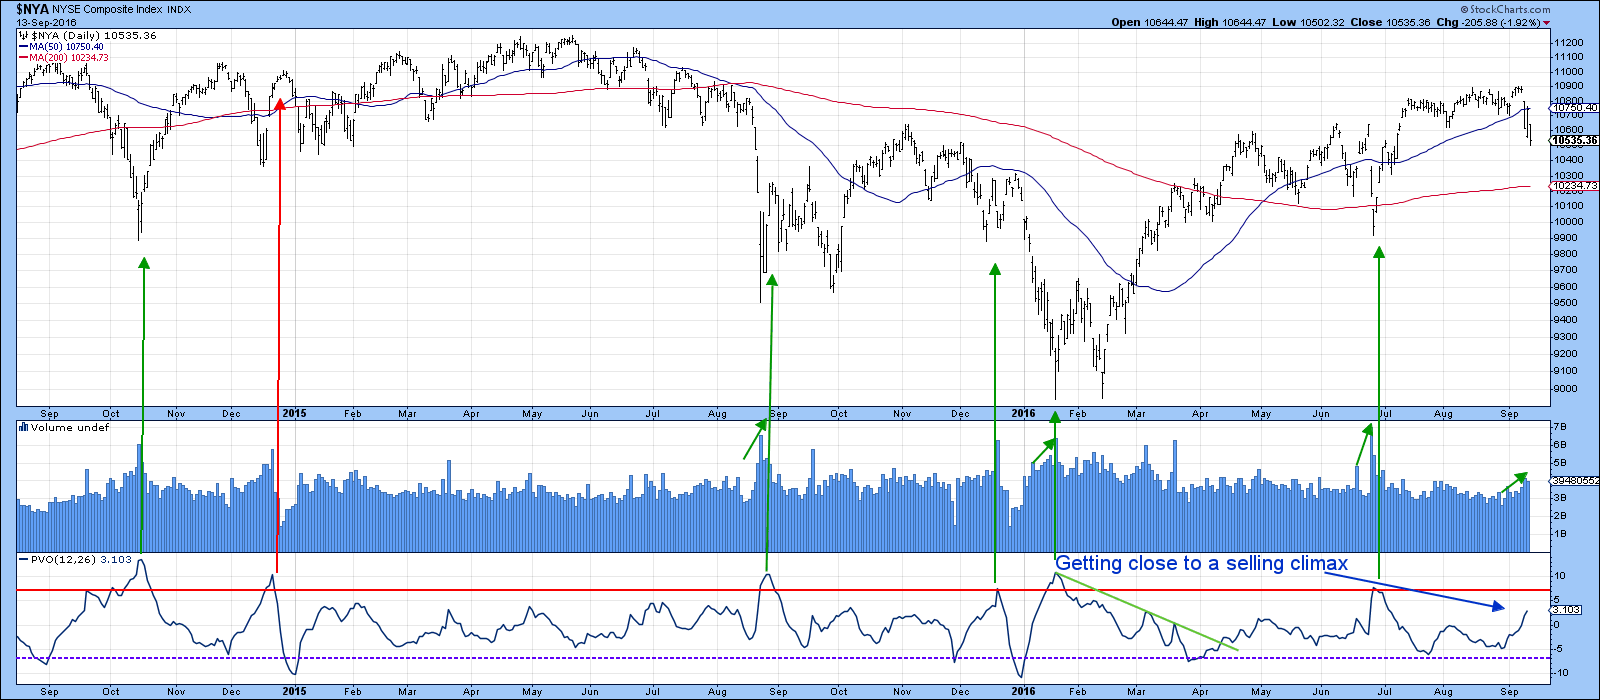
Chart 3
Another indicator that is poised to give us a positive signal is the McClellan Volume Oscillator (!VMCOSNYC), or rather the interaction between its 10-day (black) and 20-day(red) EMA. This is shown in Chart 4. Bullish indications (green arrows) are triggered when the 10-day series moves above its 20-day counterpart. Both are at identical levels currently, so it would not take much in the form of upside action to result in a signal. Note that the NYA, just like the Dow is resting on an important support trendline.
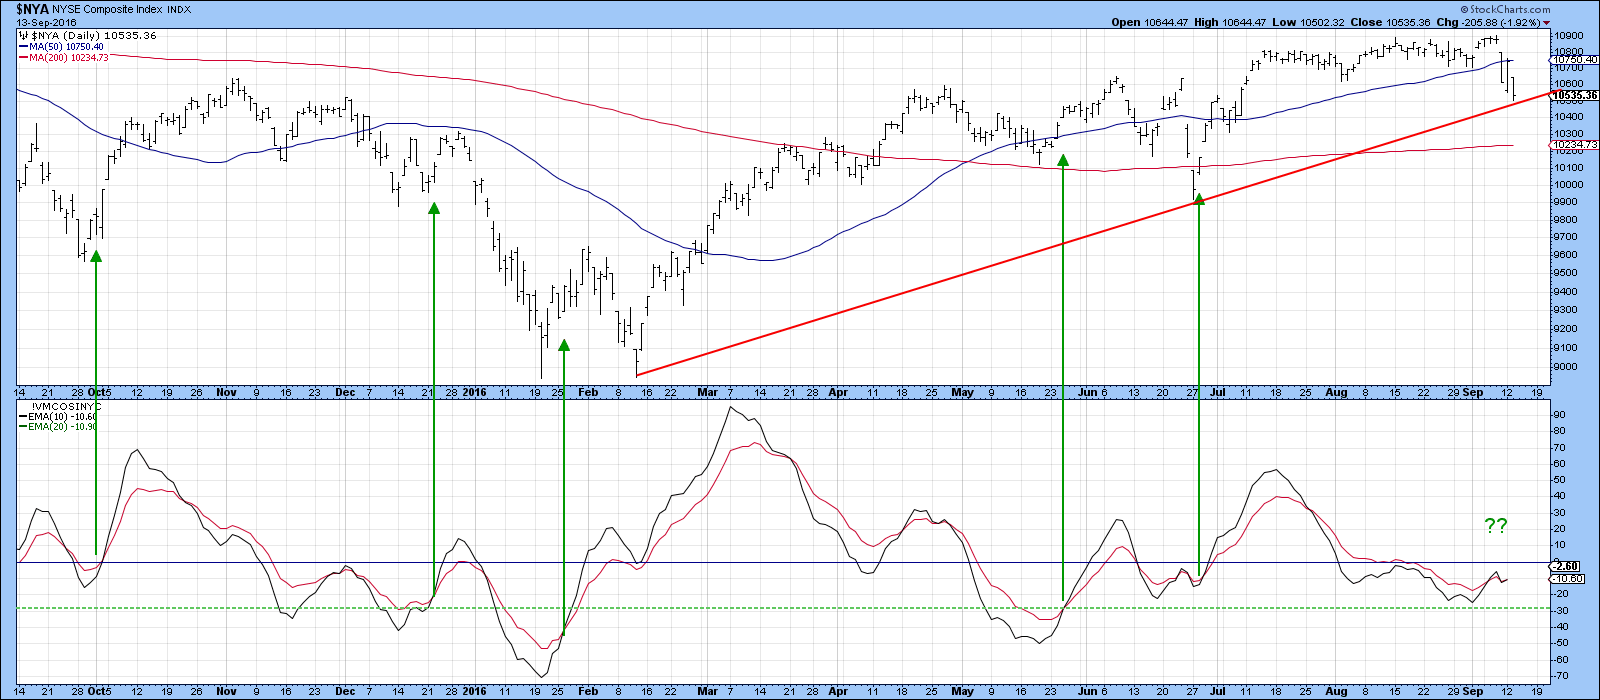
Chart 4
Finally, one other observation lies in the fact that Friday’s action opened with a large gap on the downside. Not all gaps are filled but the vast majority are, as traders go back and re-visit previous emotions.
What are important intermarket relationships saying about the recent drop?
On balance, the majority of intermarket relationships that measure confidence in the equity market, continue to look positive. For example, Chart 5 shows that the ratio between the S&P High-Beta and High-Quality ETF's (SPHB/SPHQ). As you can see, it recently broke out from a base favoring high beta. The ratio has hardly budged during the recent carnage, which indicates that the underlying sentiment as reflected in the bullish long-term KST, remains one of confidence. It is also trading above its 200-day MA. The numbers 1-3 reflect the fact that this relationship has led market turning points in both directions. Number 4 indicates another positive as the ratio has been rising in recent weeks, unlike the market, which has not.
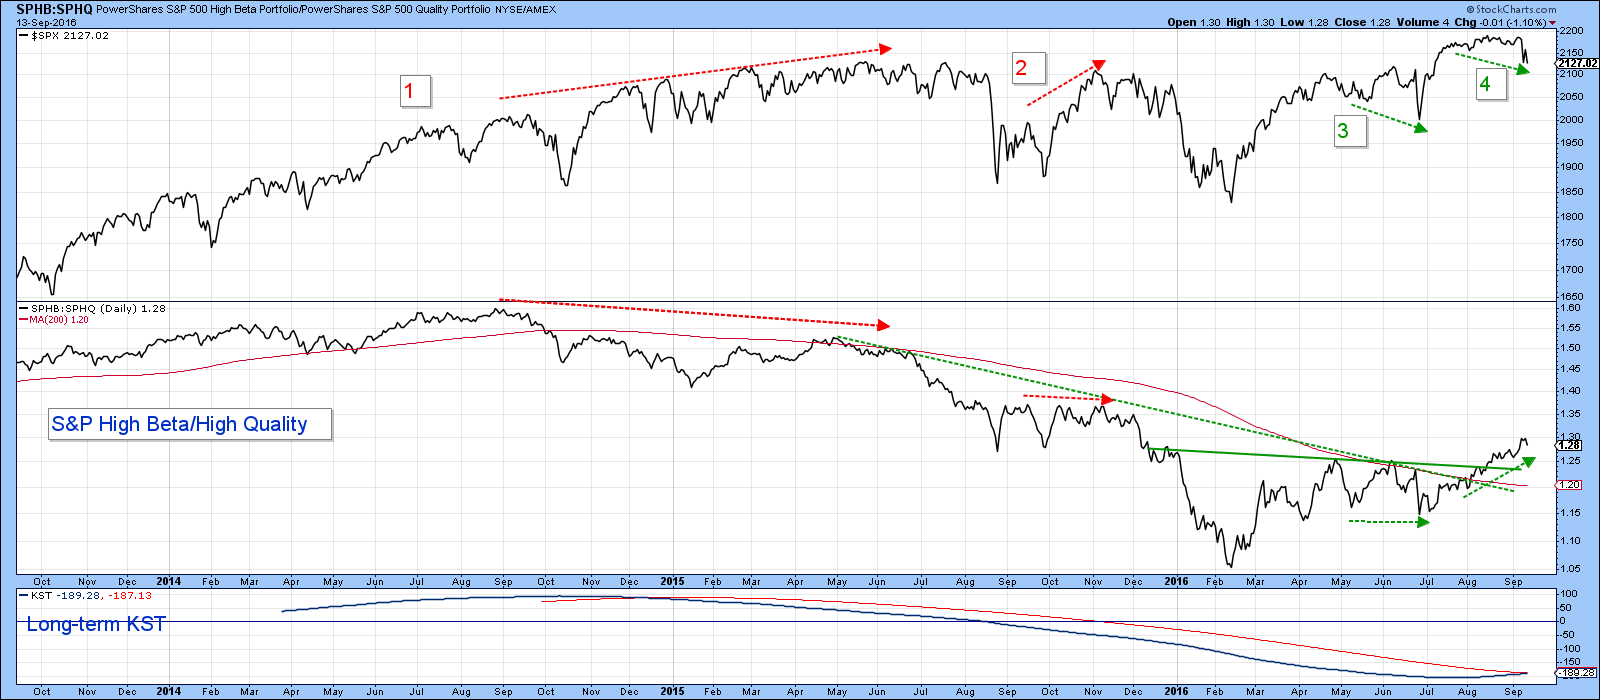
Chart 5
The same kind of action can be observed from the relationship between high yield bonds (HYG) and good quality treasuries (TLT) in Chart 6. This ratio recently broke out from a base and above its 200-day MA in favor of junk bonds. If investors were worried I would have expected to see this series decline, not rally sharply.
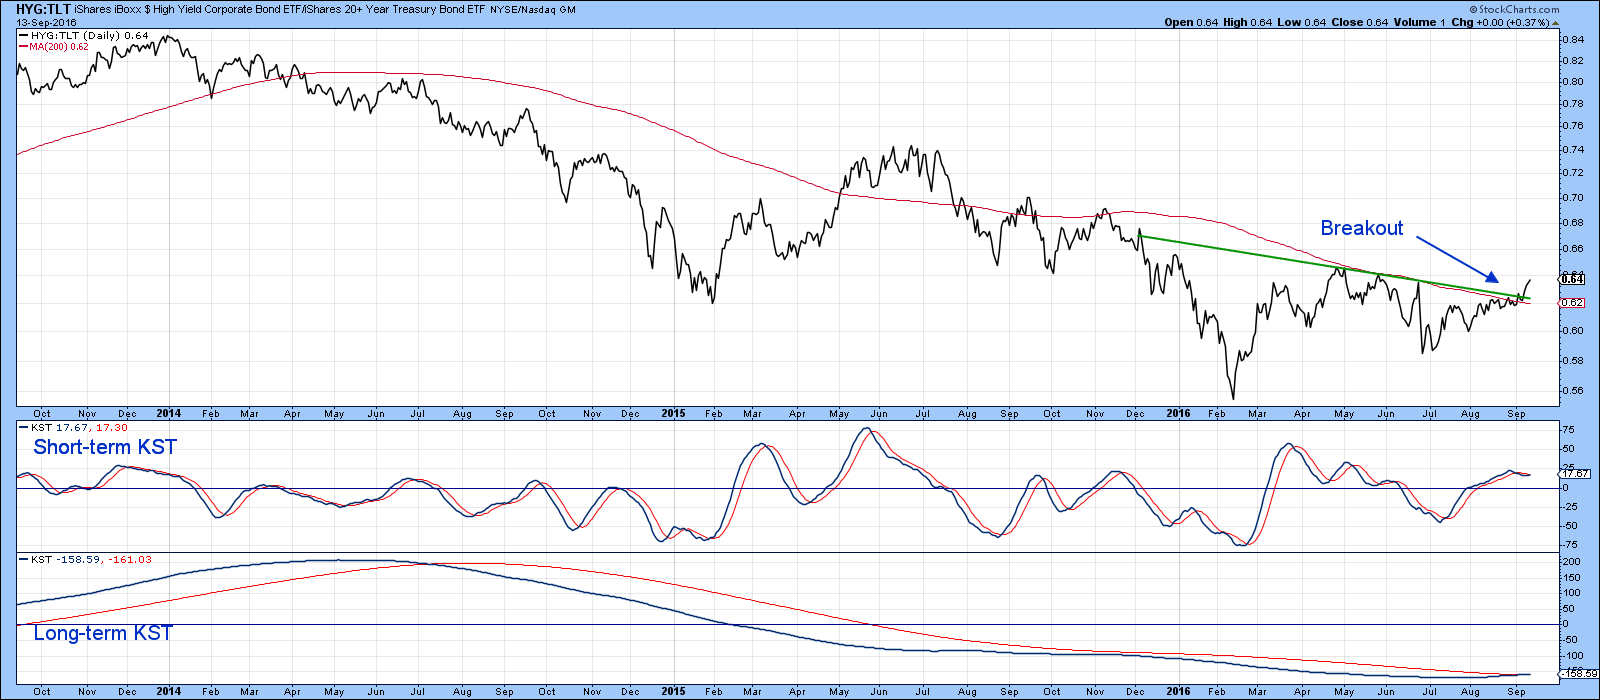
Chart 6
My take on the market is that we are in a primary bull trend, where the surprises will develop on the upside. Some indicators look pretty promising already, but some more corrective activity may be required in order to set things up for a really robust year-end rally.
Is Dr. Copper about to make a house call?
Copper has been a noticeable laggard amongst commodities since the February low in the major commodity indexes, but that may be about to change. Chart 7 shows that the price has been in a trading range for the bulk of 2016. Now the short-term KST is oversold and the price is resting on its 2016 up trendline. The technical situation is definitely very finely balanced as the intermediate indicator has been completely flat since May. The key benchmarks are $2.24 on the upside and $2.10 on the downside. Since the long-term KST is already bullish there is an excellent chance of an upside move. If so, the price would likely rally into the $3 area.
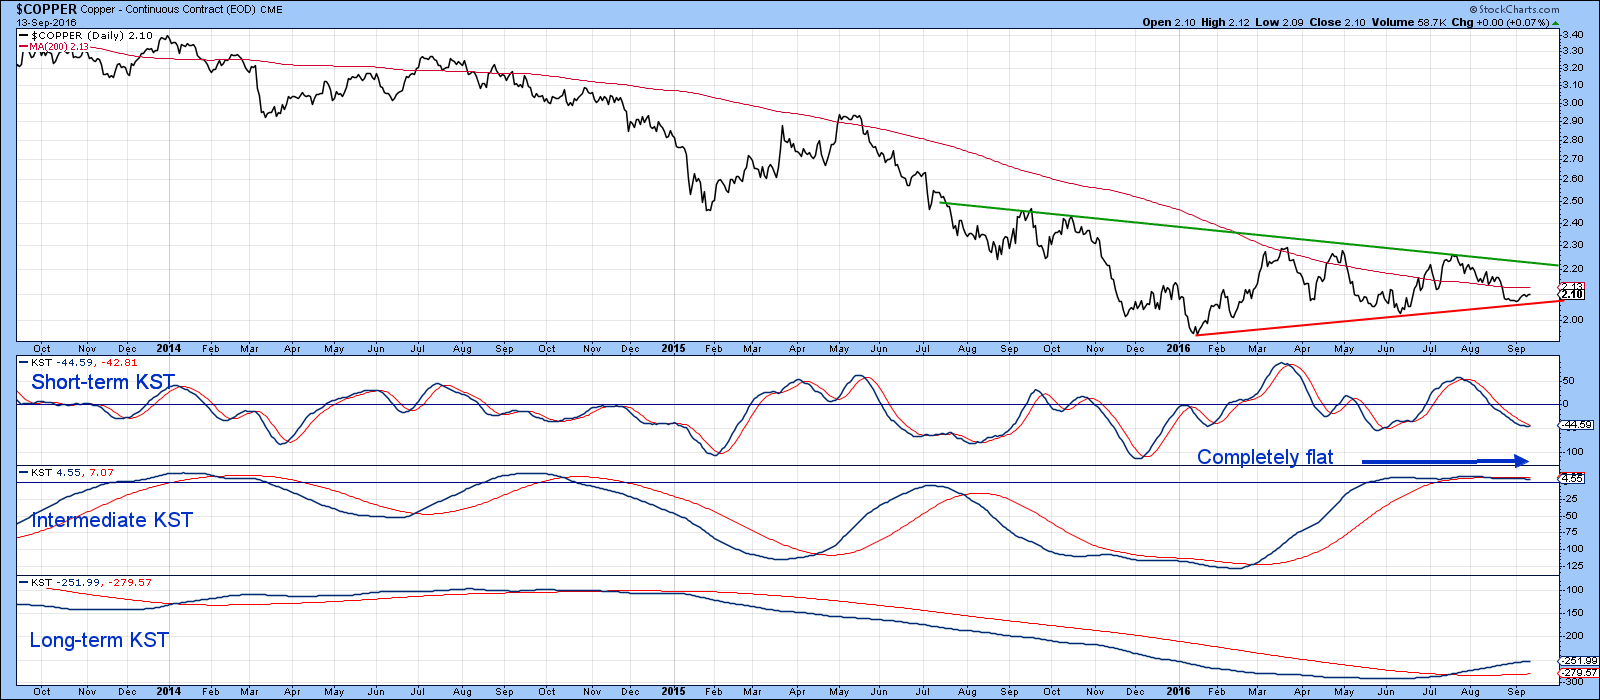
Chart 7
One area of encouragement comes from the fact that copper shares have been doing better recently than the metal. Equity investors have been voting for higher copper prices. Note that the AB trendline for the Copper ETF (COPX) has already been violated, whereas that for the metal has not.
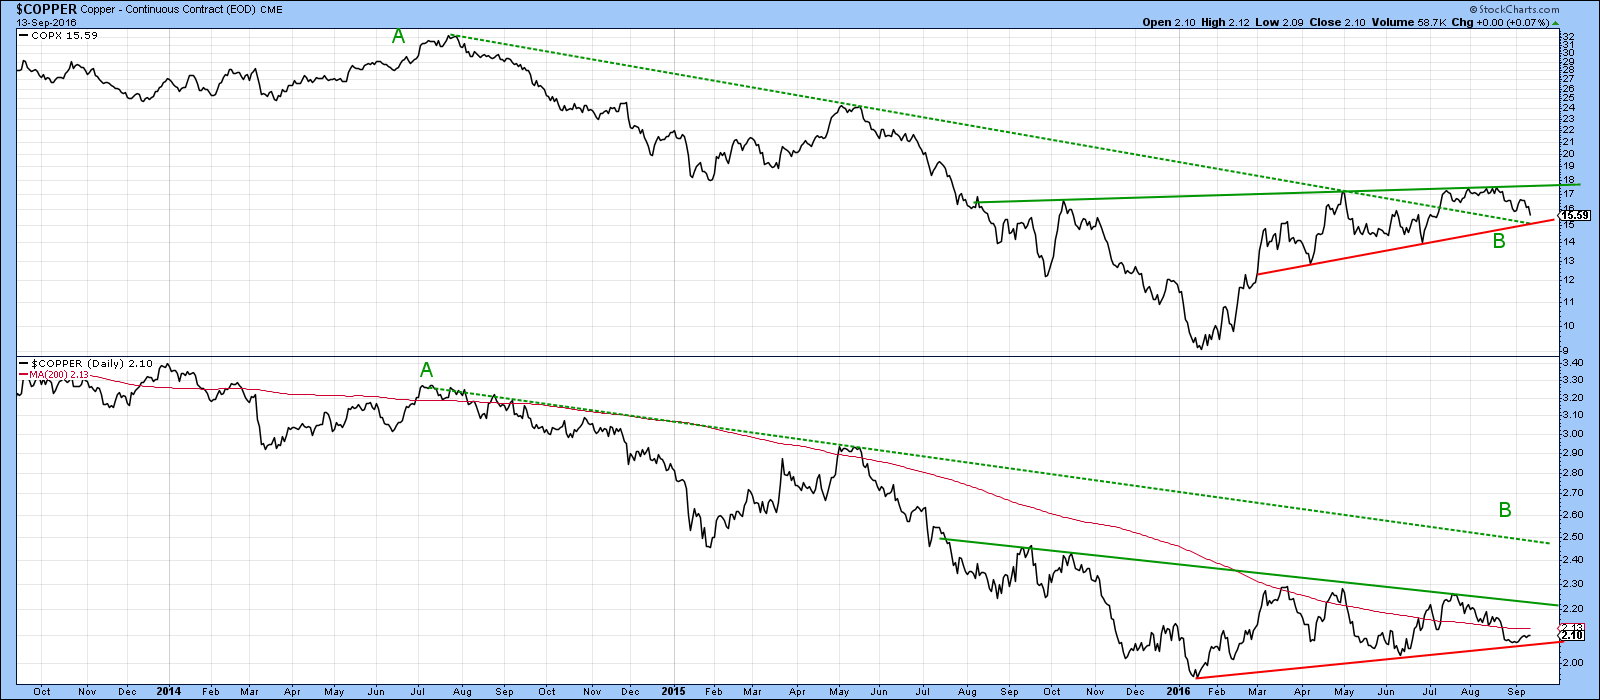
Chart 8
Finally, Chart 9 features the Bloomberg Copper ETN, the JJC together with recent MFI action. This indicator has just crossed above the oversold zone and its July/September down trendline. Two false oversold crossovers in 2015 warn us that this indicator is not perfect but combined with an outside day in the price on Monday, there is a sporting chance that Dr. Copper can mount a good faith attempt at the overhead resistance in the area of the trendline at just below $26.
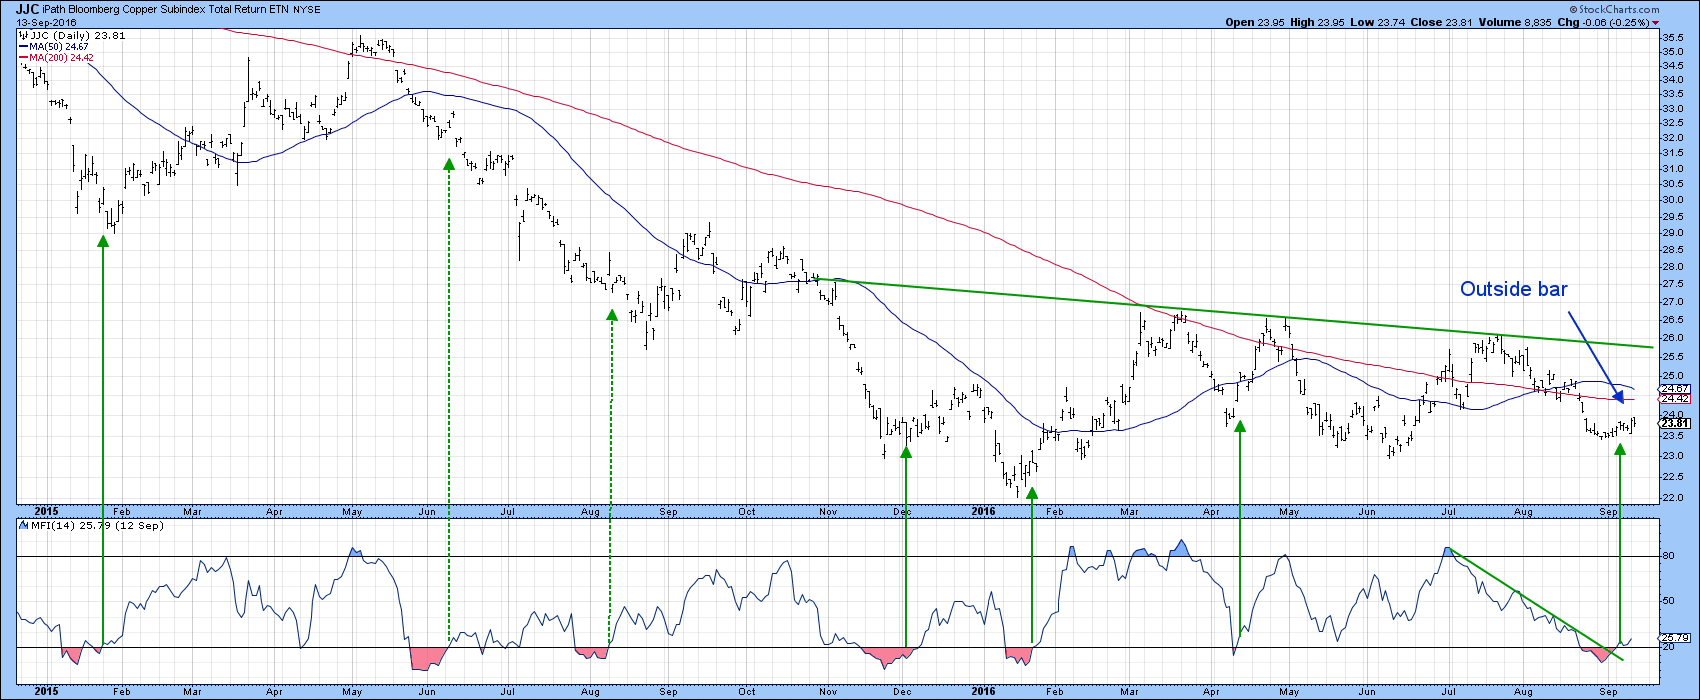
Chart 9
Good luck and good charting,
Martin J. Pring
The views expressed in this article are those of the author and do not necessarily reflect the position or opinion of Pring Turner Capital Group or its affiliates.


