Monday Triggers A Dow Theory Buy Signal
- A brief synopsis of Dow Theory
- Transports could be explosive
- Was there anything wrong with Monday’s rally?
- Market remains short-term oversold
- Good looking ETF’s
Monday's explosion in prices sent the Dow Transports well above their previous intermediate high. This price action confirms the buy signal already triggered by the Industrials last summer and generating an overall Dow Theory buy signal.
A brief synopsis of Dow Theory
For those not familiar with the theory, it is essentially a trend following device by which those companies producing goods (the DJ Industrials) are in technical agreement with those in the business of transporting them (DJ Transports). The idea is that when one average experiences a series of rising intermediate peaks and troughs and this is confirmed by the other experiencing similar action, the primary trend is declared bullish, at least by Dow Theory standards. It remains in a positive mode until both averages set up a series of declining intermediate peaks and troughs. One average reversing without the other does not count. Major questions revolve around what qualifies as an intermediate advance or decline. It’s possible to get hung up with the finer points, but generally speaking, intermediate price movements last between 6-weeks and 9-months (39-weeks). In Chart 1, I have laid out what I consider to be the intermediate moves for both series since 2014. The green waves indicate when the Dow Theory is bullish, according to my interpretation, and red when it is bearish. For example, we get a clear cut sell signal for the Transports in December of 2015 as the price drops below the September low. An industrial sell signal was triggered in February of this year as that low exceeded the one set in August 2016. It was unfortunate timing, as it came right at the bottom of the move. The subsequent industrial buy signal developed at the horizontal lime green line in July as this average exceeded its April 2016 intermediate peak. Fast forward to this week and you can see that the Transports leapt above their green trendline marking the May peak. Others may well disagree with my definition of the intermediate waves, but there can be little doubt that Dow Theory is now bullish.

Chart 1
Transports could be explosive
We often find a strong breakout occurs above a long, wide time frame when it is accompanied by strong price action with an acceleration in volume. Chart 2 shows this was the case for the Dow Jones Transport ETF, the IYT. Note also that the KST, in the bottom window, has just gone bullish and is certainly in the kind of position that can support higher prices.
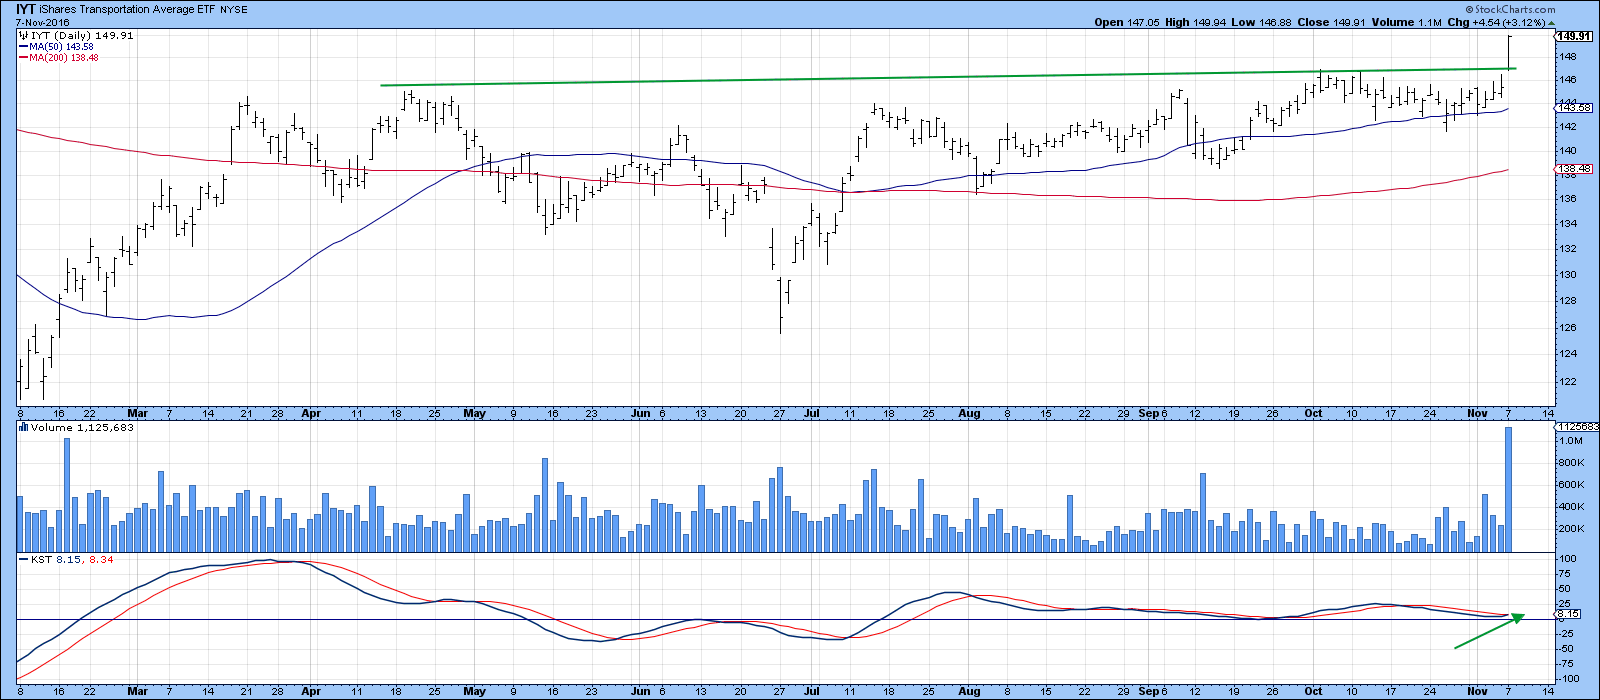
Chart 2
Finally on the transports, we can see from Chart 3 that the breakout is being supported by a recently generated long-term KST buy signal. The same is true for relative action where a rising relative strength (RS) line and RS KST combine to suggest that not only are the transports going to move higher, but are very likely to outperform the market as a whole.
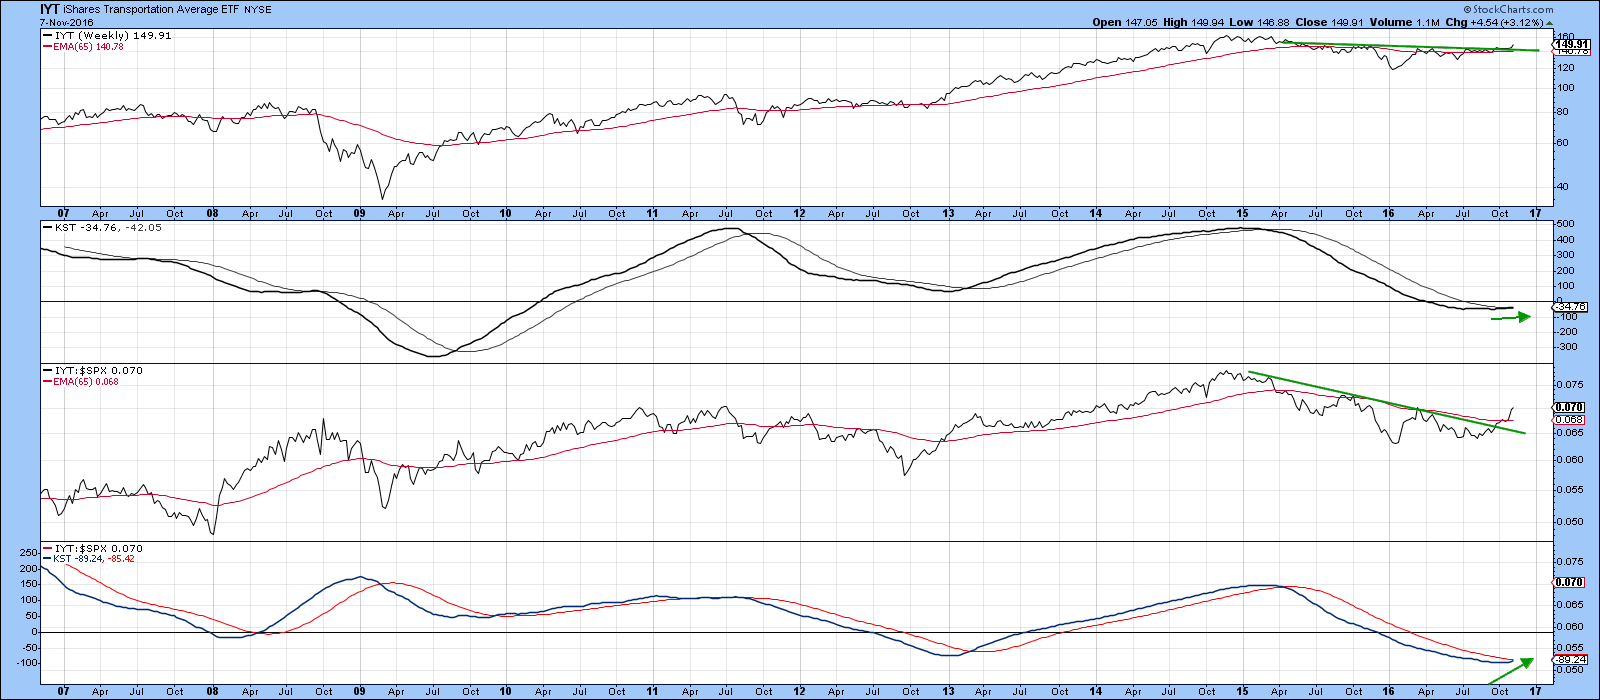
Chart 3
Was there anything wrong with Monday’s rally?
On the surface Monday’s 45-point S&P 500 ($SPX) rally looks pretty good, though volume was nothing to write home about. However, price action opened with a gap, which was never closed. Usually emotional openings such as this experience an attempt at closure within a few weeks, often less. Take the two downside gaps last summer flagged by the two green arrows. They were closed in three of four sessions. However, the red one has not yet been. One could argue though, that the early July three-day decline was a good faith effort at a closure. We are not talking big important stuff here, but it does open up the possibility of a test of Friday’s low. The kind of news that could generate such a reaction could be a “surprise” Trump victory. Were that to be the case, then I think such a reaction would provide a great buying opportunity. After all, the longer-term indicators are mostly bullish and the Dow Theory, as we have just discussed is also positive.
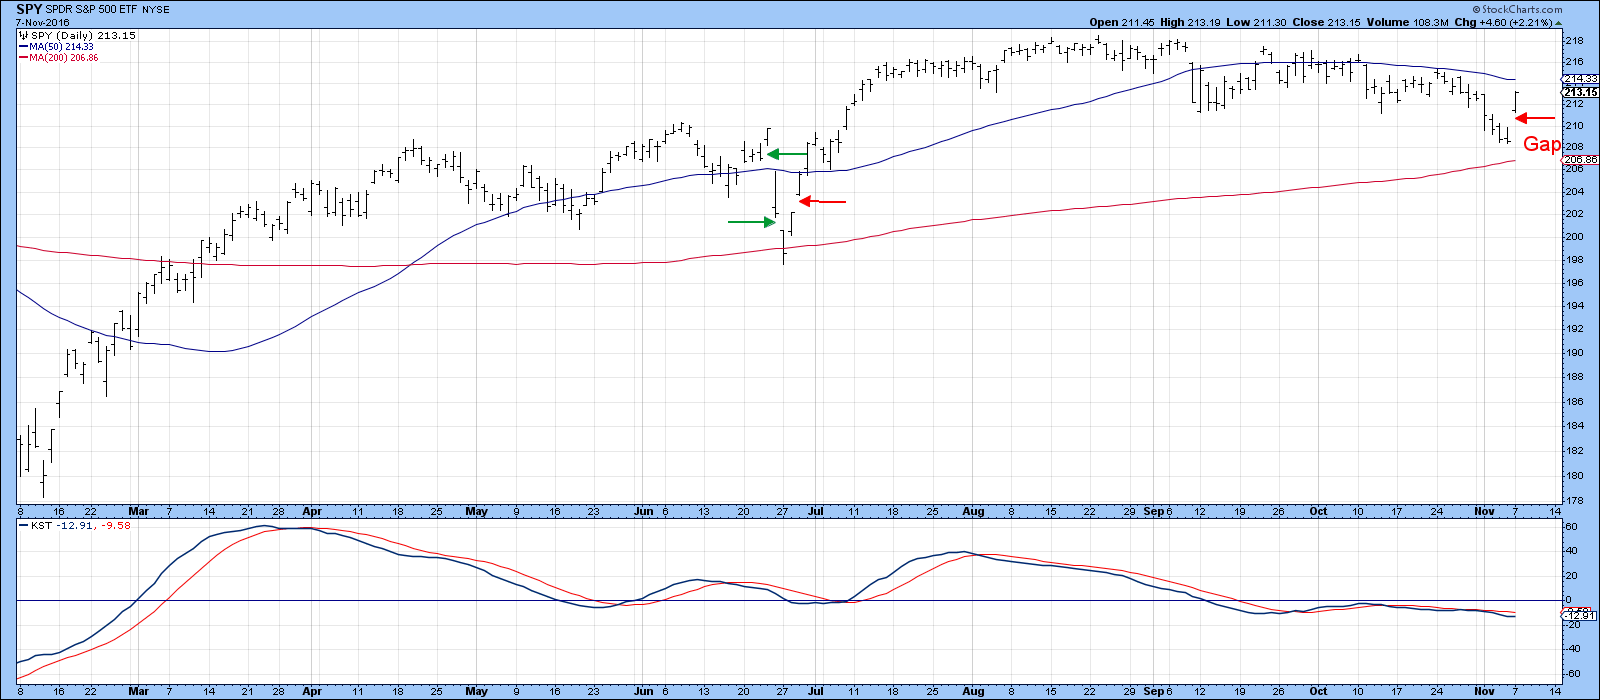
Chart 4
Market remains short-term oversold
Moreover, there are several short-term indicators that tell us that the market is very oversold on a near-term basis. One such indicator is the 30-day ratio of NYSE A/D data, as shown in Chart 5.
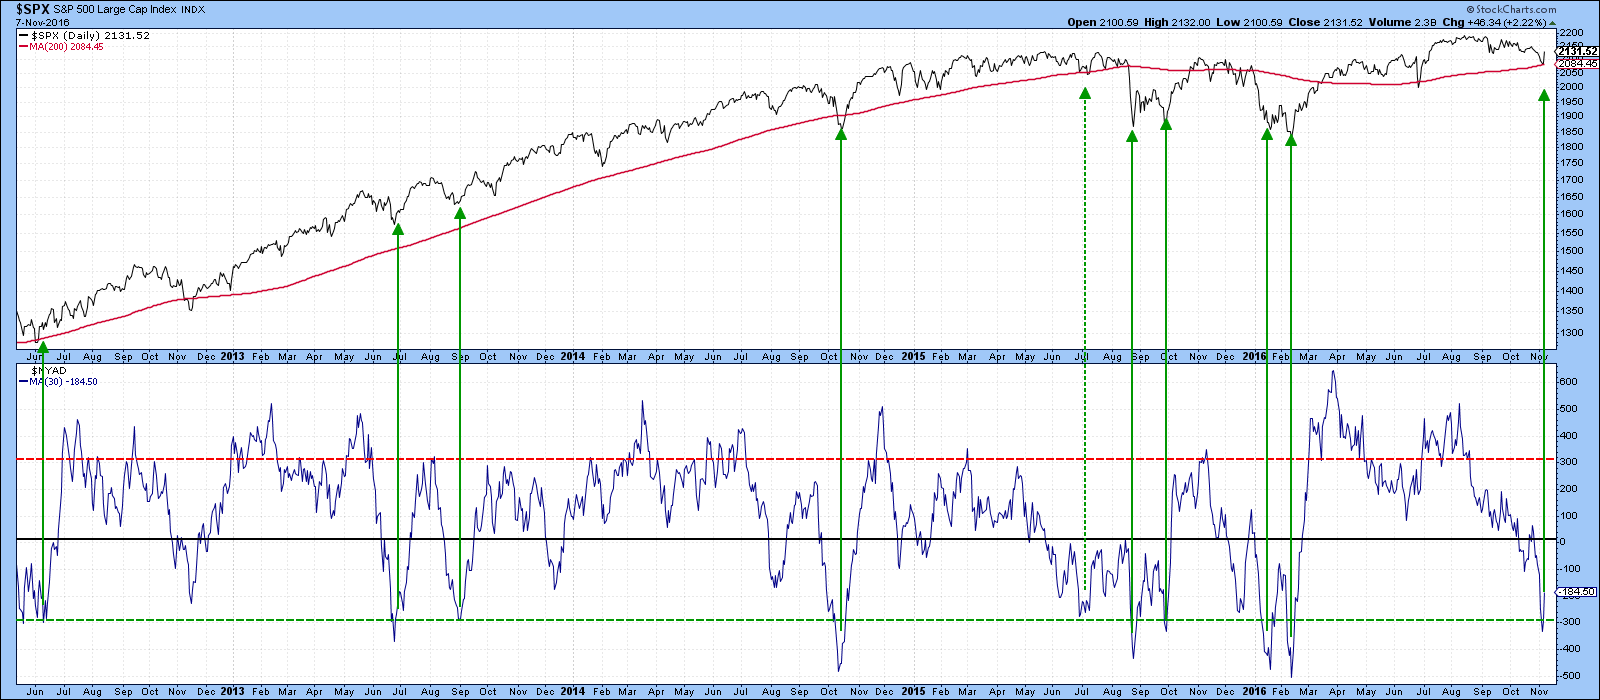
Chart 5
Alternatively, Chart 6 informs us of the possibility of a small selling climax, as prices have been declining and volume, as monitored by the PVO, has been rising.
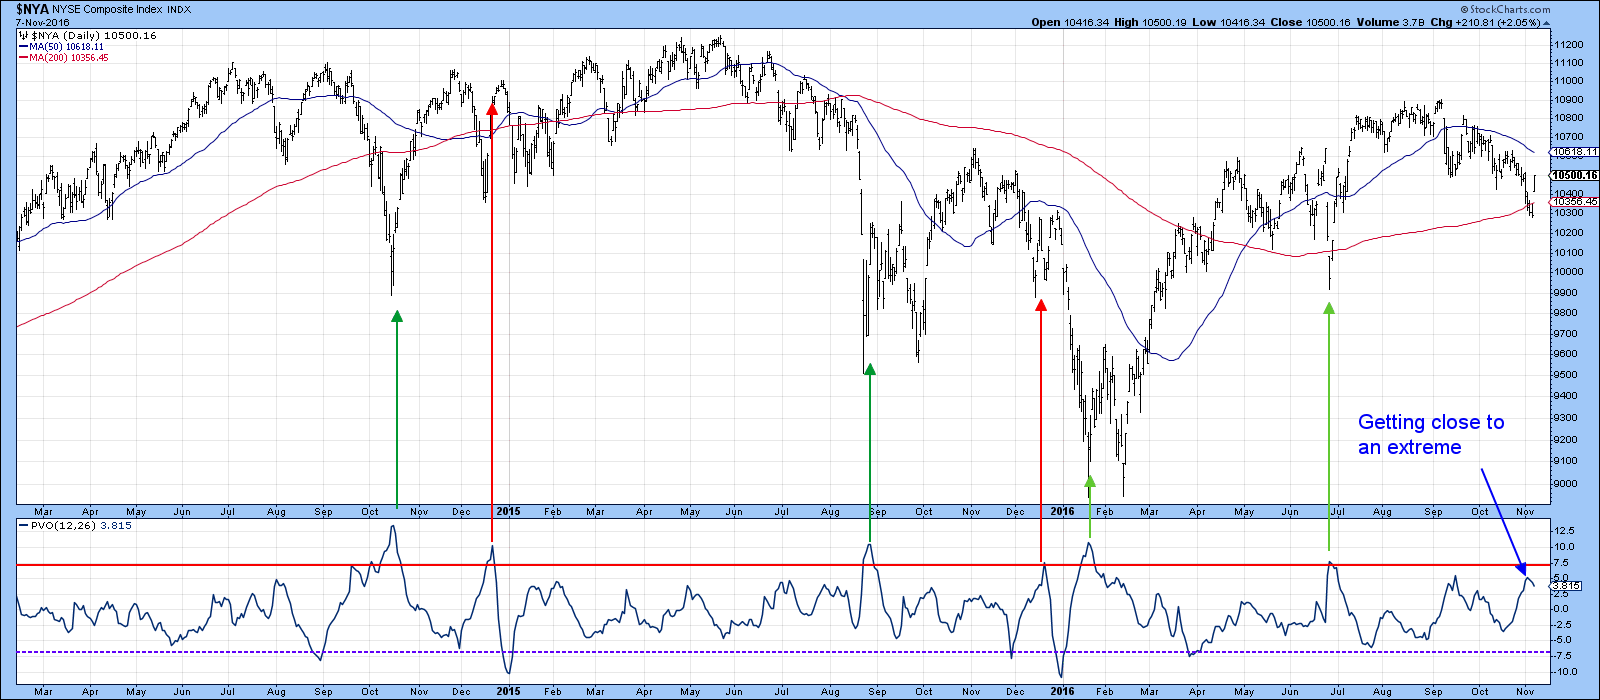
Chart 6
Good looking ETF’s
Consequently, while there may be some short-term risk, upside possibilities look more interesting. We have already seen a breakout by the transports, but Chart 7 and 8 indicate new highs being generated by financials and copper stocks.
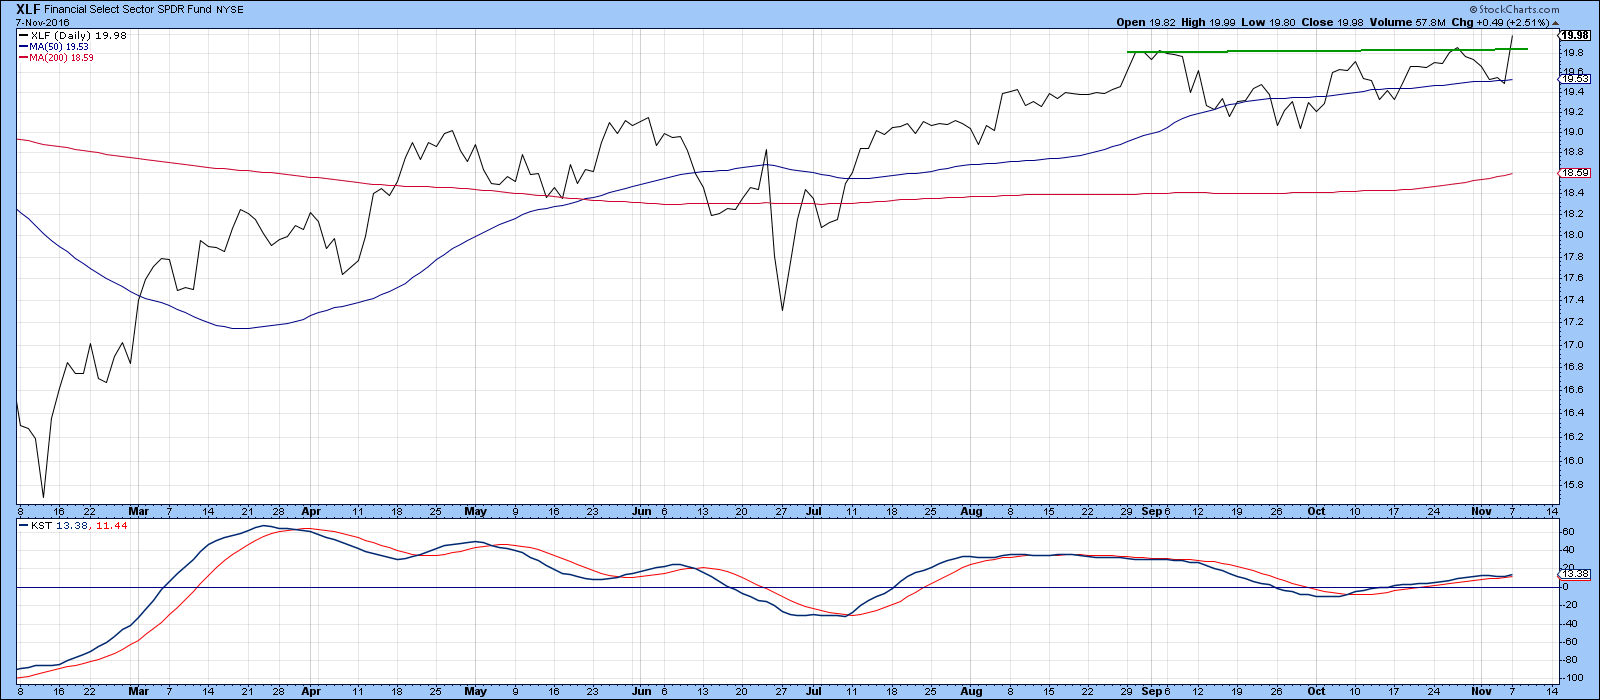
Chart 7
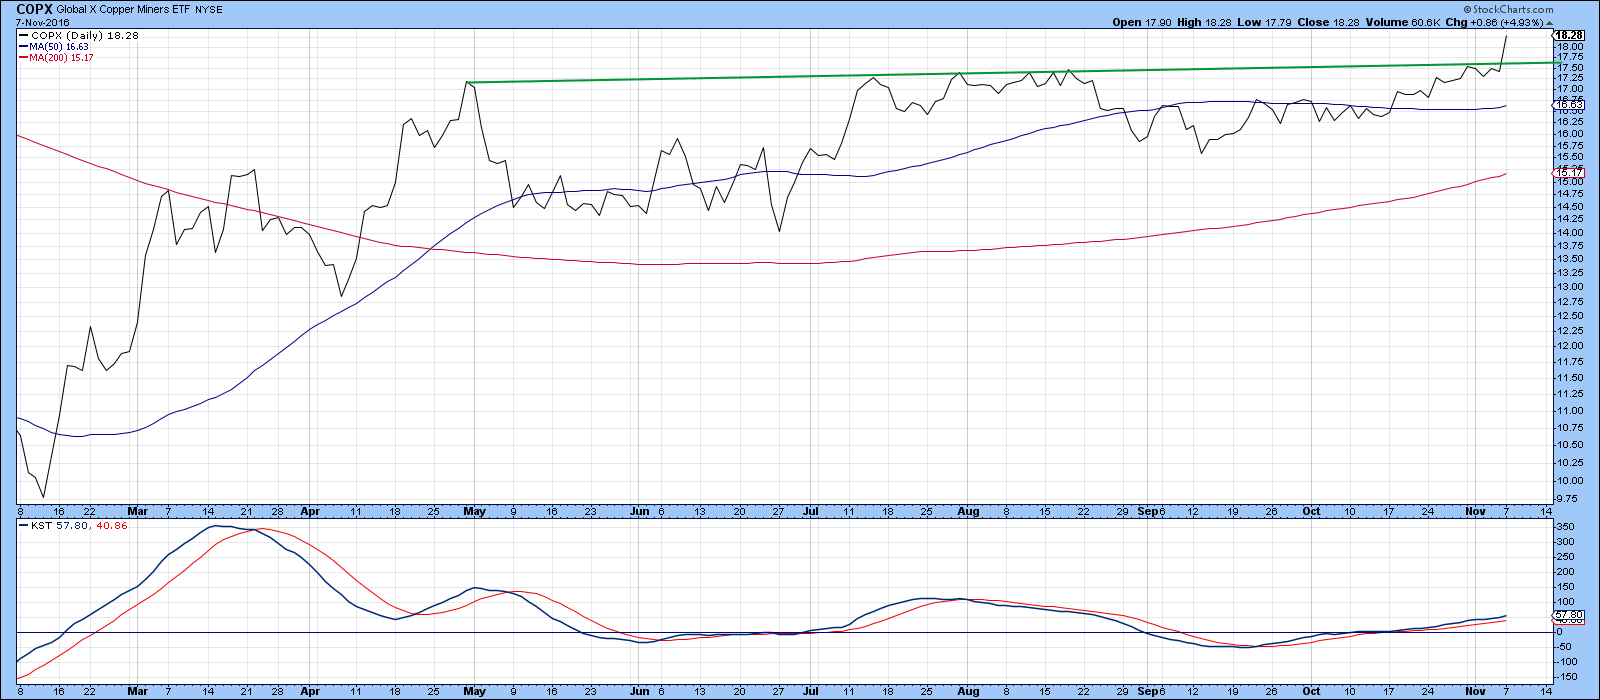
Chart 8
Good luck and good charting,
Martin J. Pring
The views expressed in this article are those of the author and do not necessarily reflect the position or opinion of Pring Turner Capital Group of Walnut Creek or its affiliates.


