Some Markets And Key Ratios Are At The Brink, But At The Brink Of What?
- Bond yields sending a deflationary message
- Intermarket signals from equities are close to deflationary signals
- So are similar measures for bonds
- More on confidence relationships
Wednesday’s close saw a lot of key ratios and some markets resting on key trendlines and moving averages. Since these benchmarks represent potential support, that could mean a bounce, followed by a reversal of recent downtrends. On the other hand, further price erosion would result in the violation of that support, which would herald a significant extension to recent downtrends. Ok, you may say, what is he getting at? My answer is a whiff of deflation in the financial markets.
Bond yields sending a deflationary message
Take Chart 1, for instance, it compares the 20-year yield($UST20Y) to its 52-week ROC. The red and green arrows point out when the oscillator reverses from at or beyond its two overstretched zones. I have used this chart in previous articles and webinars to indicate the possibility that a major sell signal for rates could be in the cards. That signal has now been given, since the ROC has fallen decisively below the +20% level for its seventeenth trend reversal signal since 1993. Please note, I am counting the two double signals in 1999 and 2014 as one. The latest warning does not provide us with any indication of the likely magnitude or duration of the move, except to say it’s invariably been greater than the decline we have so far seen. My suspicion is that the secular, or very long-term trend is in the process of reversing to the upside and that the whole period since mid-2011 will, in retrospect, turn out to be a multi-year base, but that remains to be seen.

Chart 1
Chart 2 shows the situation from a price basis, as that for the Barclays 20-year Trust, the TLT, has broken out from a large base along with a rising KST. That gap, in the $126-128 area, has yet to be filled. If bond yields are likely to decline and prices rally, then their key influence, commodity prices ought to be showing some signs of vulnerability.
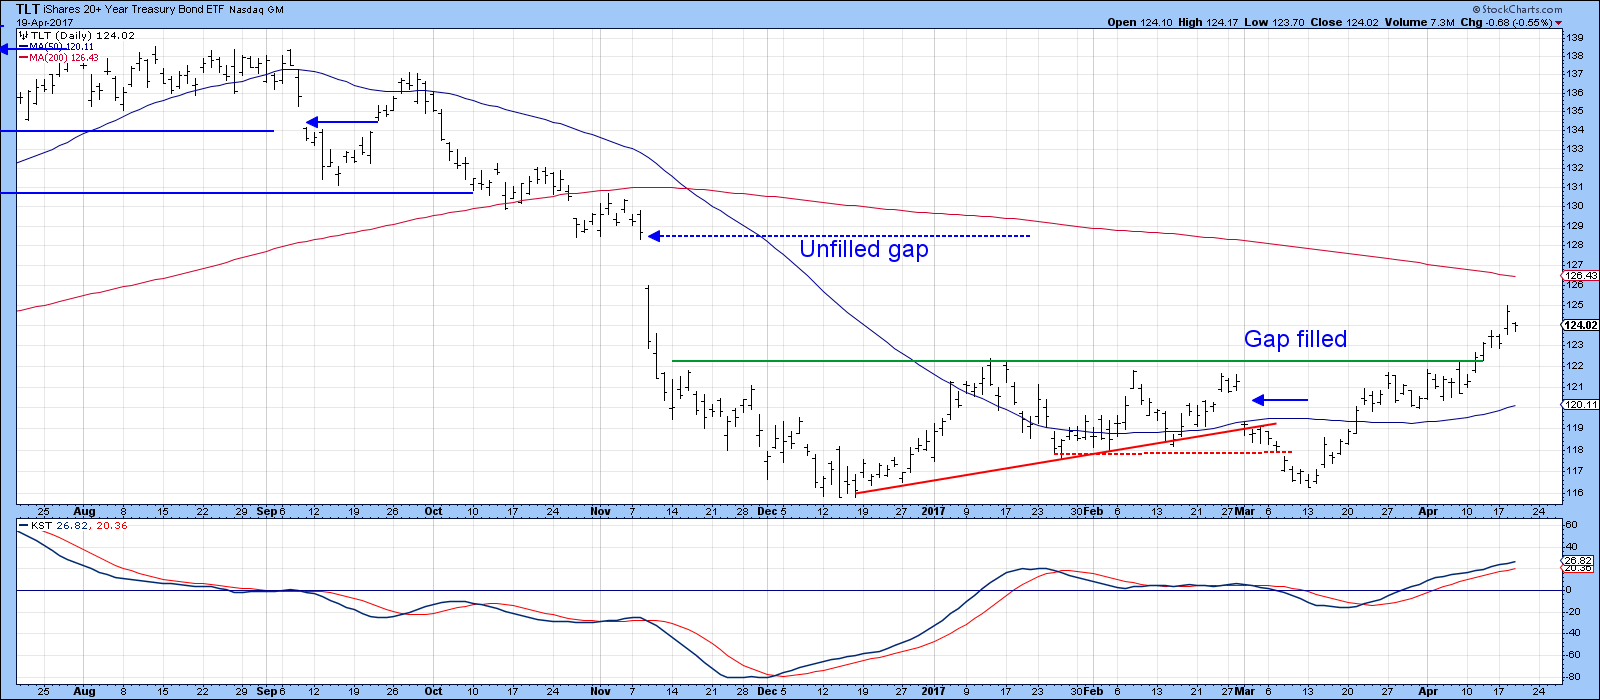
Chart 2
Intermarket signals from equities are close to deflationary signals
It’s not generally realized but there is an association between commodities and the stock market and commodities and internal bond market relationships. Intermarket indicators based on these connections can be helpful in identifying or validating important trend reversals in commodity prices. Chart 3 compares the DB Commodity ETF, the DBC, with two stock market relationships. The first compares a resource-based ETF, the Goldman Sachs Natural Resource ETF (IGE) with that of an ETF that is sensitive to deflationary forces, the Spider Consumer Staples (XLP). The DBC itself is right at its 200-day MA and its 2016-17 support trendline, whereas the stock market ratio is below its MA and standing right at the brink i.e. the red support trendline. On the other hand, my Inflation/Deflation ratio (!PRII:!PRDI) has broken both the support line and the MA. The principal difference between these two relationships is that the IGE/XLP ratio is more focused on energy stocks for its inflation component, whereas the Inflation/deflation series contains a greater weighting towards miners, including golds. The main takeaway from this chart is not so much that commodities are likely to sell-off from here, but more to the fact that the whole complex is delicately balanced i.e. on the brink.
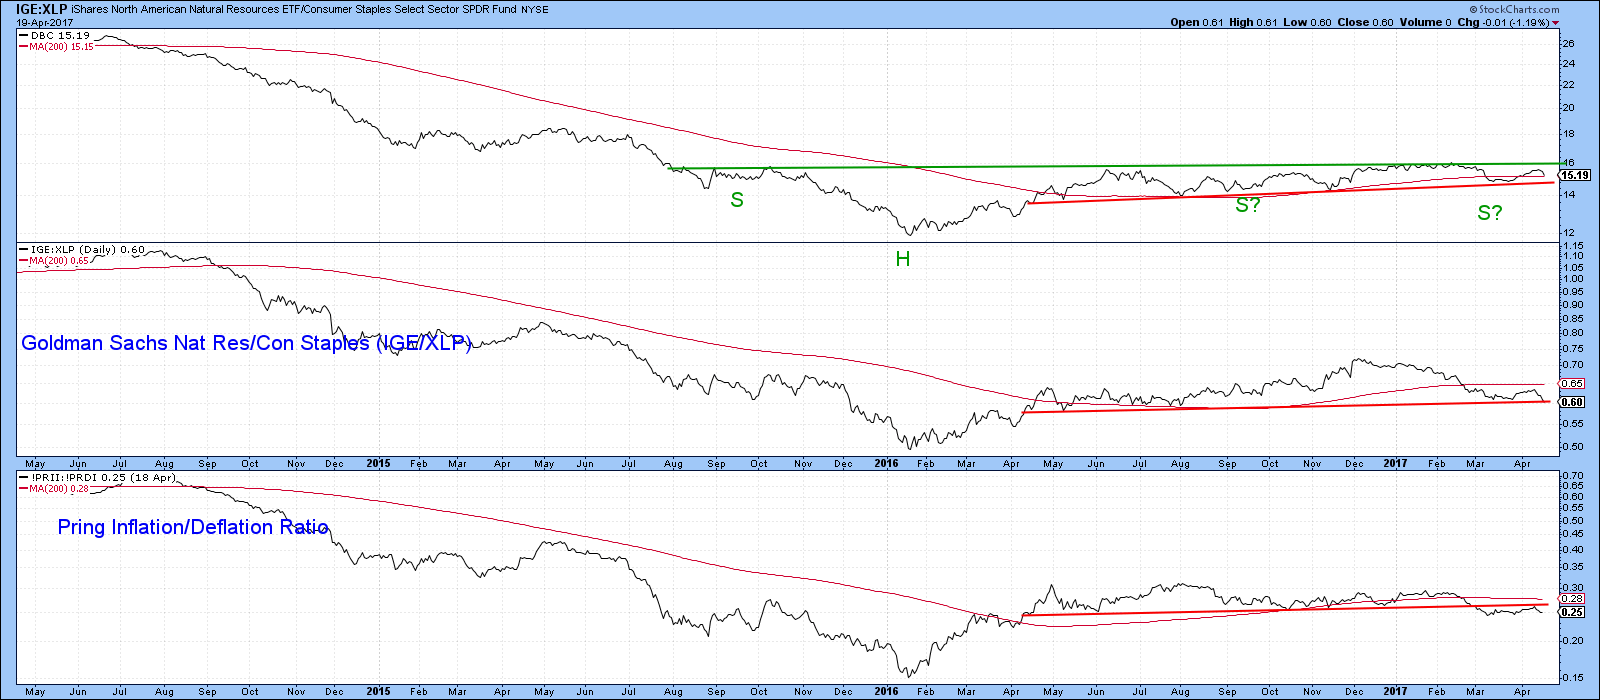
Chart 3
So are similar measures for bonds
Chart 4 offers the bond market’s interpretation through the ratio between the iShares TIPS Inflation Protected Bond ETF (TIP) and the TLT, cited in Chart 2. A rising ratio indicates an investor desire for protection against inflation and vice versa. In other words when the ratio is advancing, investors are betting on higher commodity prices and vice-versa. The two series do not always move tick for tick but their overall trends are fairly evenly matched. Right now, the ratio is pointing in a deflationary direction, which suggests that the DBC might soon confirm with a daily close below the red trendline at $15.90.
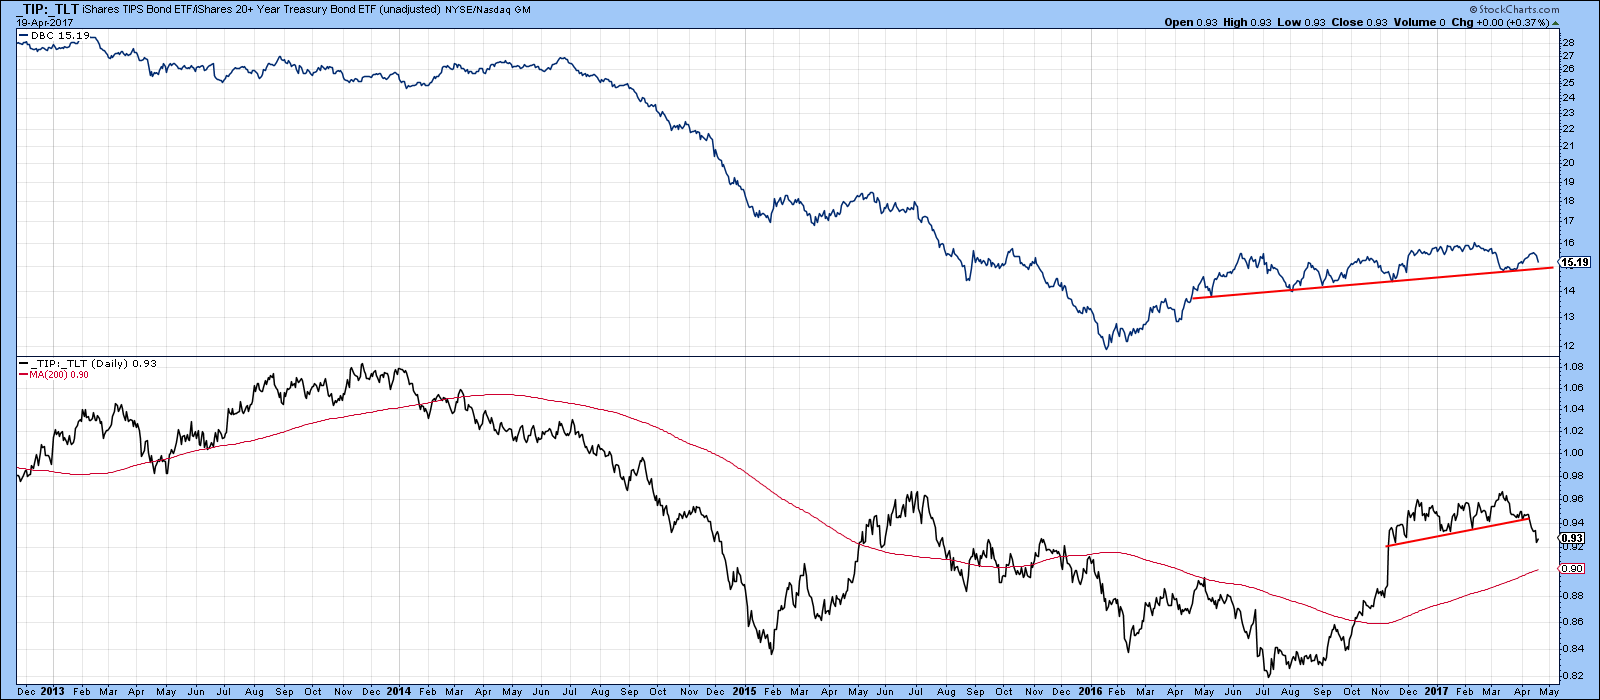
Chart 4
Chart 5 features a similar relationship, but this time from a rest of the world global aspect. The chart compares the Spider International Government Protected Bond ETF (WIP) with that of regular bonds in the form of the Barclays International Treasury Bond ETF, the BWX. Once again a rising relationship is inflationary and vice versa. This series recently tried to break above its 2013 and 2015 highs, but has since pulled back. It now stands at its 2016-17 up trendline and is therefore on the brink of a downside penetration. The violation of the small up trendline in the Special K suggests that it might well break to the downside.
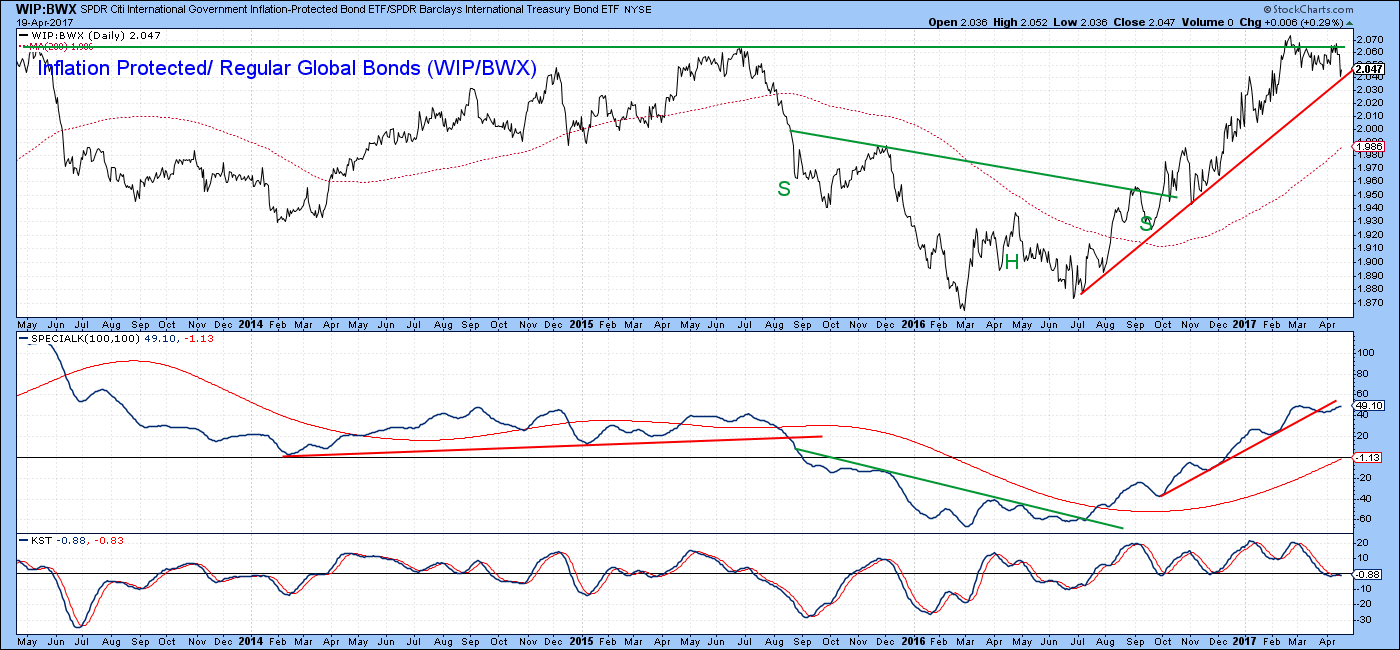
Chart 5
More on confidence relationships
The ratio between junk (HYG) and quality (IEI) bonds usually moves up and down with the stock market. It’s when it diverges that important messages of potential trend reversal signals are given. For example, the ratio peaked well ahead of the S&P in 2015. This was followed by a controlled correction into February 2016. Since then, both series have been rising, but the confidence relationship is sitting right at the brink in the form of the secondary 2016-17 up trendline.
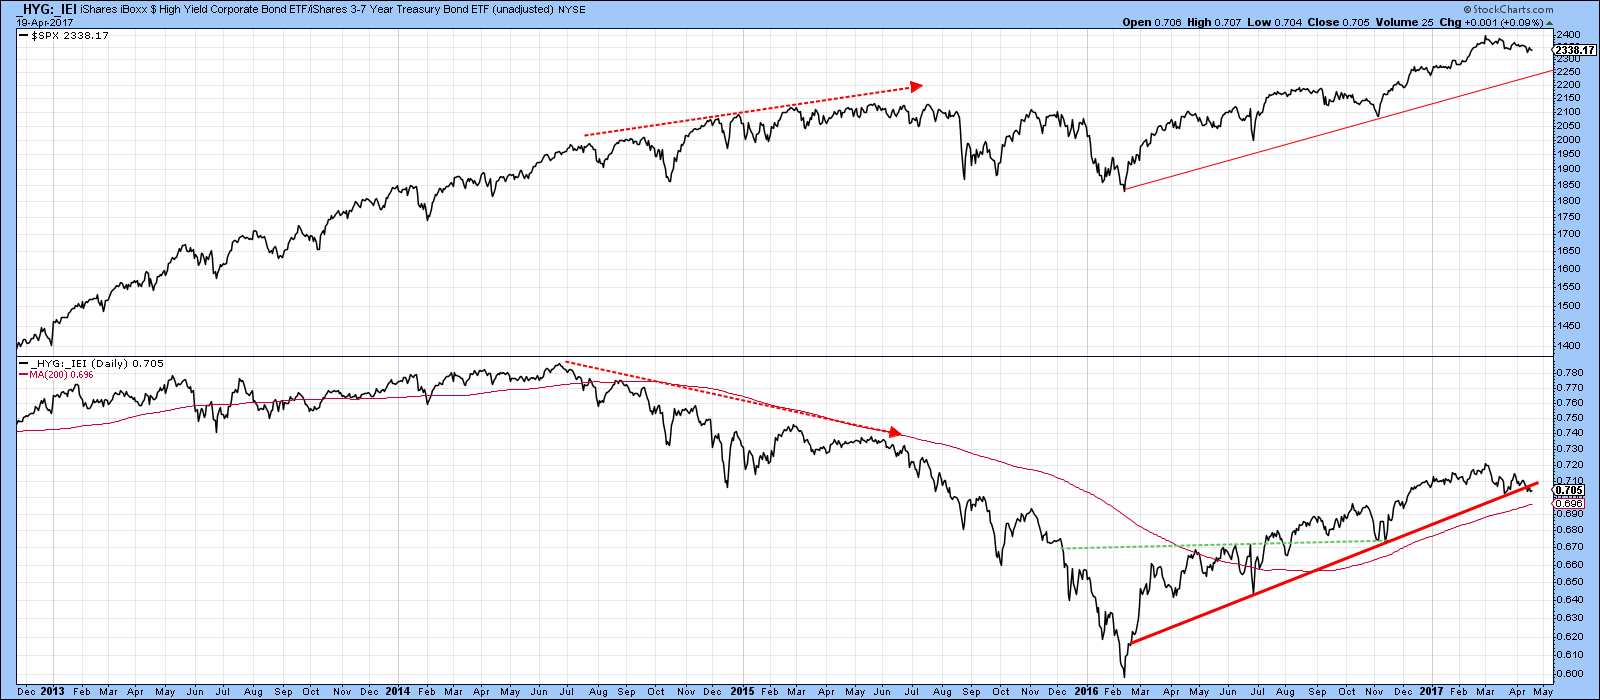
Chart 6
Another form of confidence ratio comes from the relationships between high-beta and high-quality ETF’s, specifically the S&P High Beta (SPHB) and Quality (SBHQ). You can see how this relationship peaked out well ahead of the 2105 peak in the $SPX. Since the February 2016 low both series moved in gear on the upside. That is, until December of last year, when the ratio started to deteriorate. It violated its up trendline a couple of weeks ago and has now pulled back to the brink, in the form of a potential head and shoulders neckline and the 200-day MA.
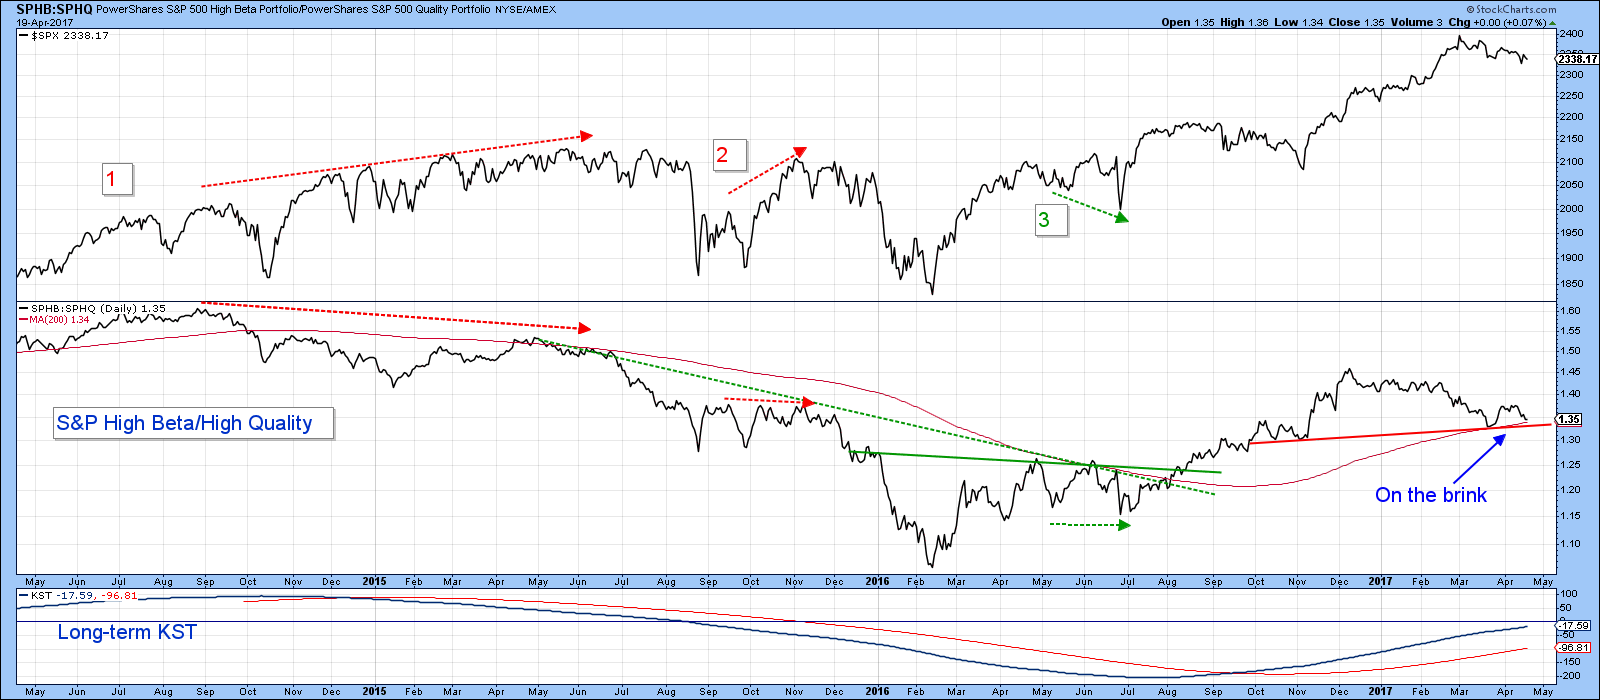
Chart 7
Good luck and good charting,
Martin J. Pring
The views expressed in this article are those of the author and do not necessarily reflect the position or opinion of Pring Turner Capital Group of Walnut Creek or its affiliates.


