Homebuilders Hit By Tax Reform
- SPDR Homebuilder ETF (XHB)
- iShares Home Construction ETF (ITB)
- Euro and yen looking vulnerable
Limitations being proposed for the popular interest rate deduction on tax filings hit the two homebuilder ETF’s for six on Thursday. These are the SPDR Homebuilder ETF (XHB) and the iShares Home Construction ETF (ITB). Ironically, two countries, with which I am familiar, The UK and Canada, have no such deduction and construction and housing prices do just fine. Take a look at the long-term history of house prices in London, Toronto and Vancouver, and you will see what I mean. With that in mind I thought it would be a good idea to check out the technical position of these two ETF’s to see if the sell-off can be justified on a long-term basis.
SPDR Homebuilder ETF (XHB)
Chart 1, for instance, features the XHB, together with its KST and volume. Thursday’s sharp drop pushed the price back to support, in the form of the horizontal dashed red trendline. However, no damage has yet been done to the long-term uptrend. Volume was exceptionally heavy, but one day’s action leaves it far short of activity experienced in the early 2016 selling climax. Finally, the daily KST has started to keel over, as it has for many stocks. That suggests that some digestion of recent gains, or even a test of the solid red up trendline is in order.
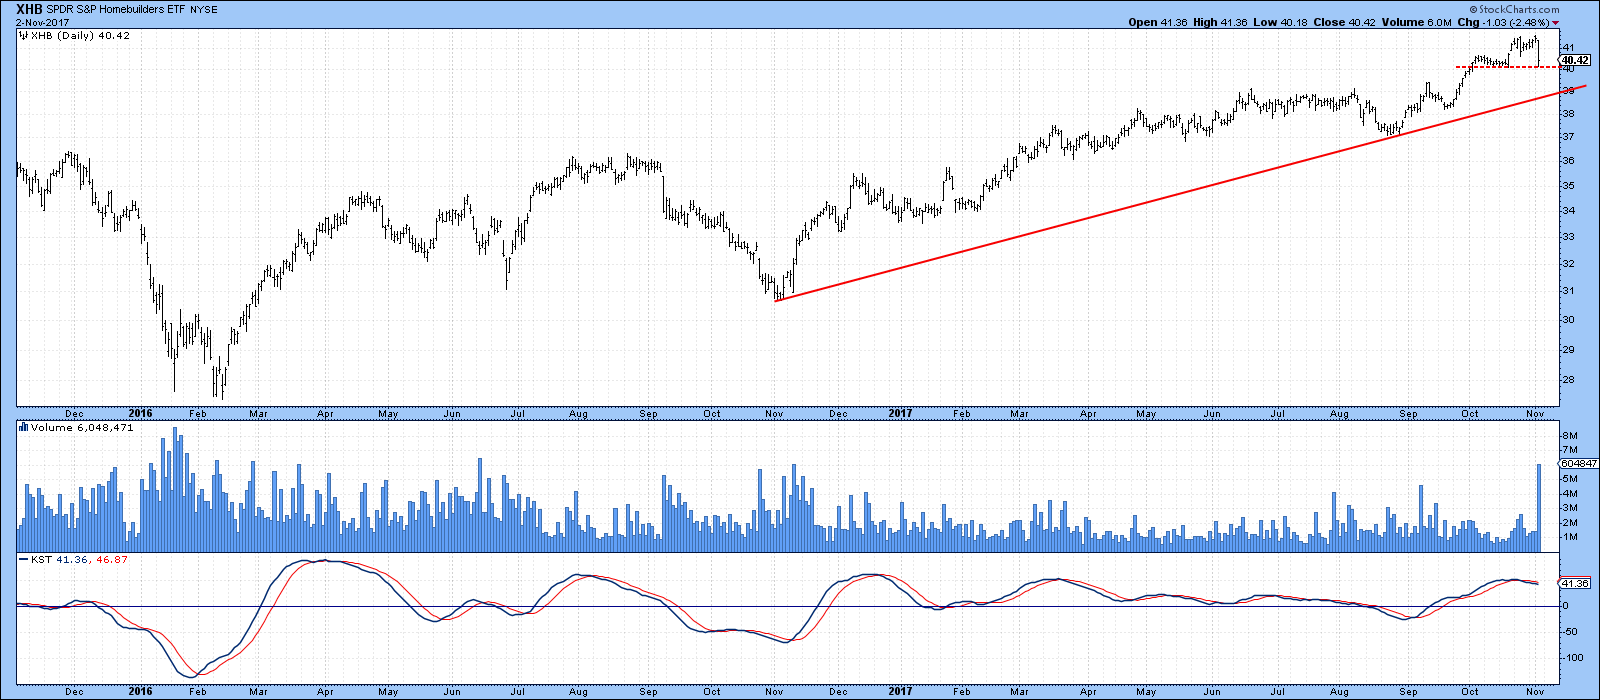
Chart 1
When we look at things from a longer-term perspective in Chart 2, the price is both above the trendline and 65-week EMA. The same can be said for the relative action in the third window. However, the RS line is right at that green breakout trendline and there is not much room for error. The worst aspect lies in the fact that the XHB peaked last week, but the RS line touched its high-water mark back in early 2013. That tells us that while holding the ETF has paid off in the last few years, there have been better opportunities elsewhere. Not with standing some short-term turbulence, that is likely to be the case going forward as well.
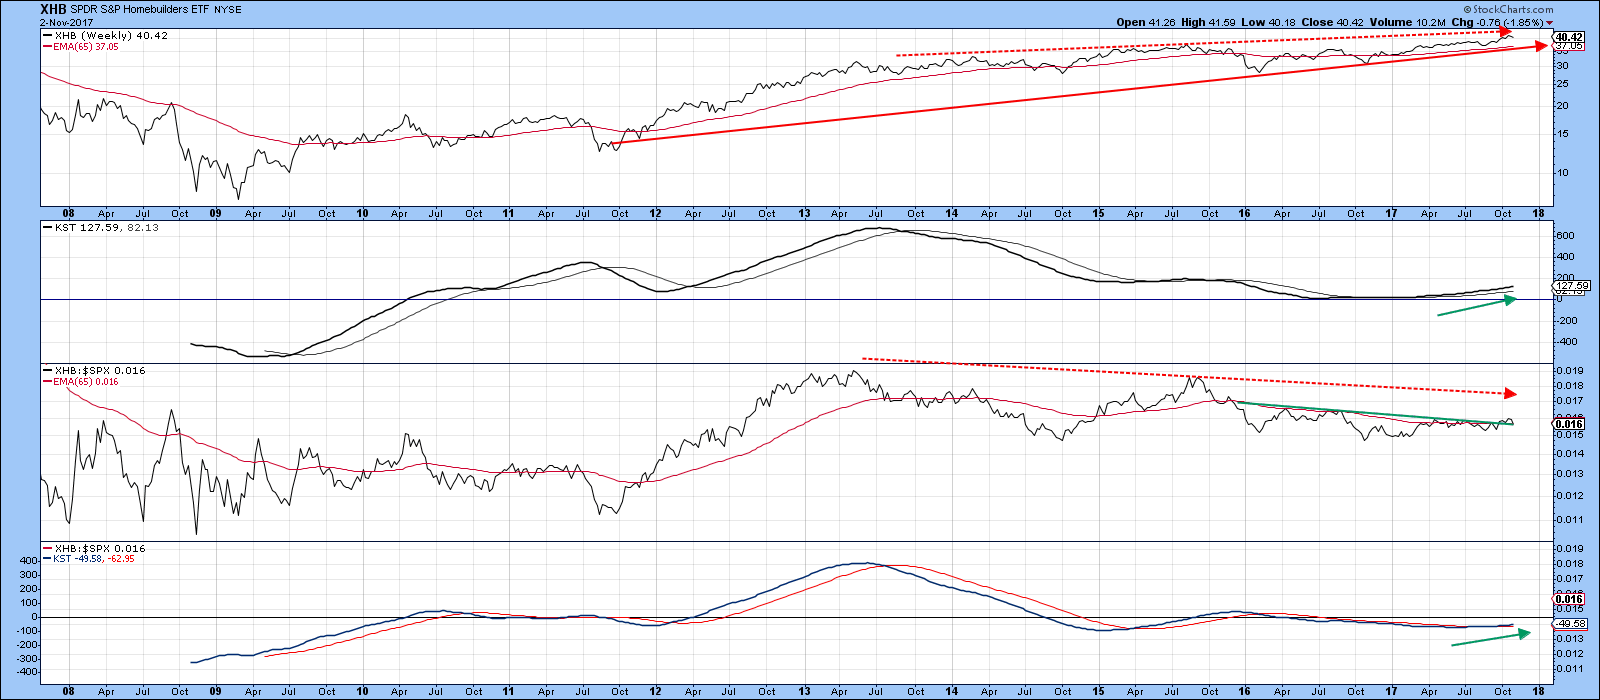
Chart 2
iShares Home Construction ETF (ITB)
Chart 3 shows us the progress of the ITB. Apart from homebuilders themselves, this ETF also contains DYI retailers such as Home Depot, Lowes and Sherwin Williams. The price experienced a bearish outside bar on Thursday. It not only encompassed the trading range of the previous session, but several others as well. This increases the probabilities that the bar will have a negative influence on prices for next 5-10 sessions. If so, that should be sufficient to allow the KST to trigger a sell signal, thereby prolonging the agony a bit longer.
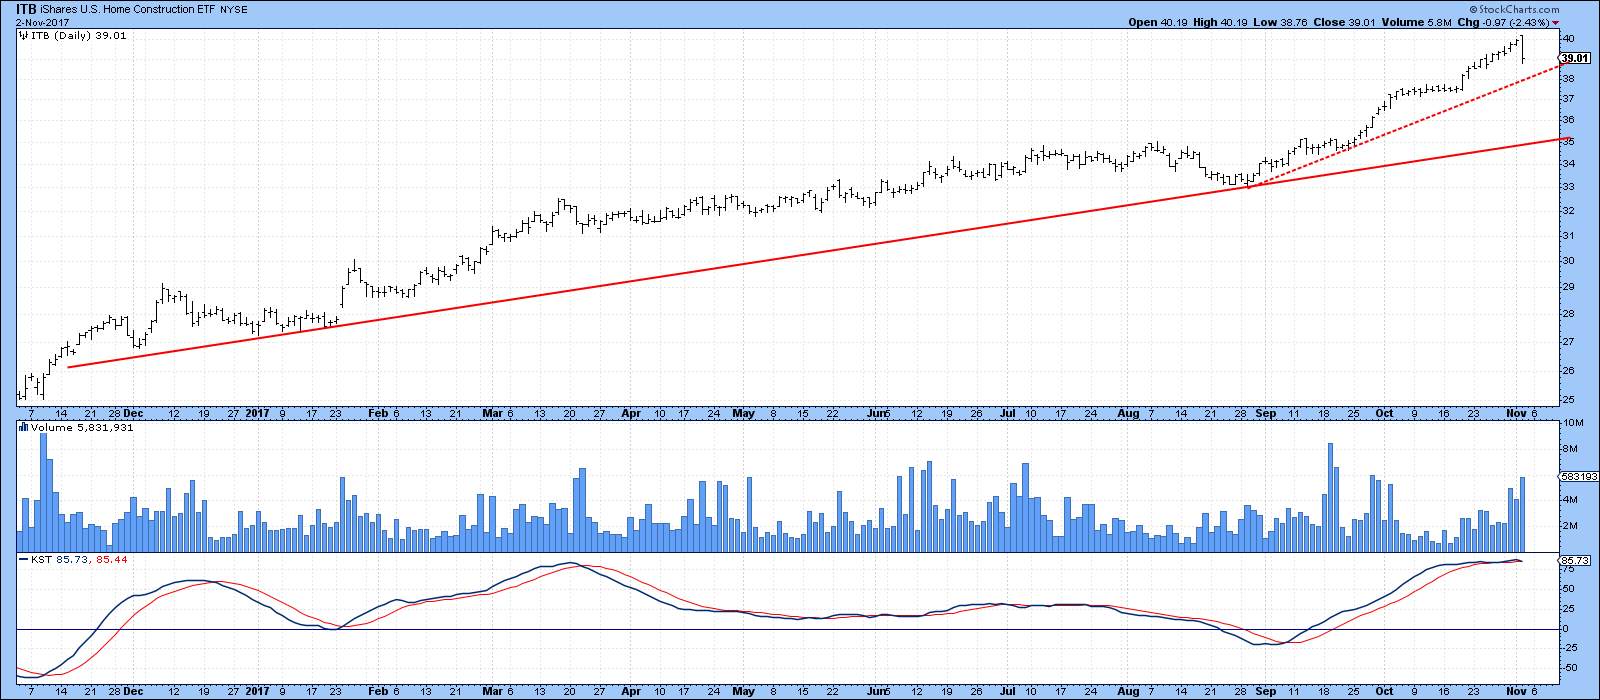
Chart 3
Chart 4, shows that the ITB is in much better technical shape than the XHB, when viewed from the perspective of weekly data. For instance, the absolute price has broken above a 4-year green resistance trendline. Moreover, this has been supported by a bullish long-term KST in the second window of the chart.
The relative line remains at resistance in the form of its early 2013 peak. However, it is experiencing a positive RS KST and has only just broken out from a 4-year base. All in all it looks to be in fine technical shaper longer term, and is likely to move higher once it has overcome some likely short-term vulnerability.
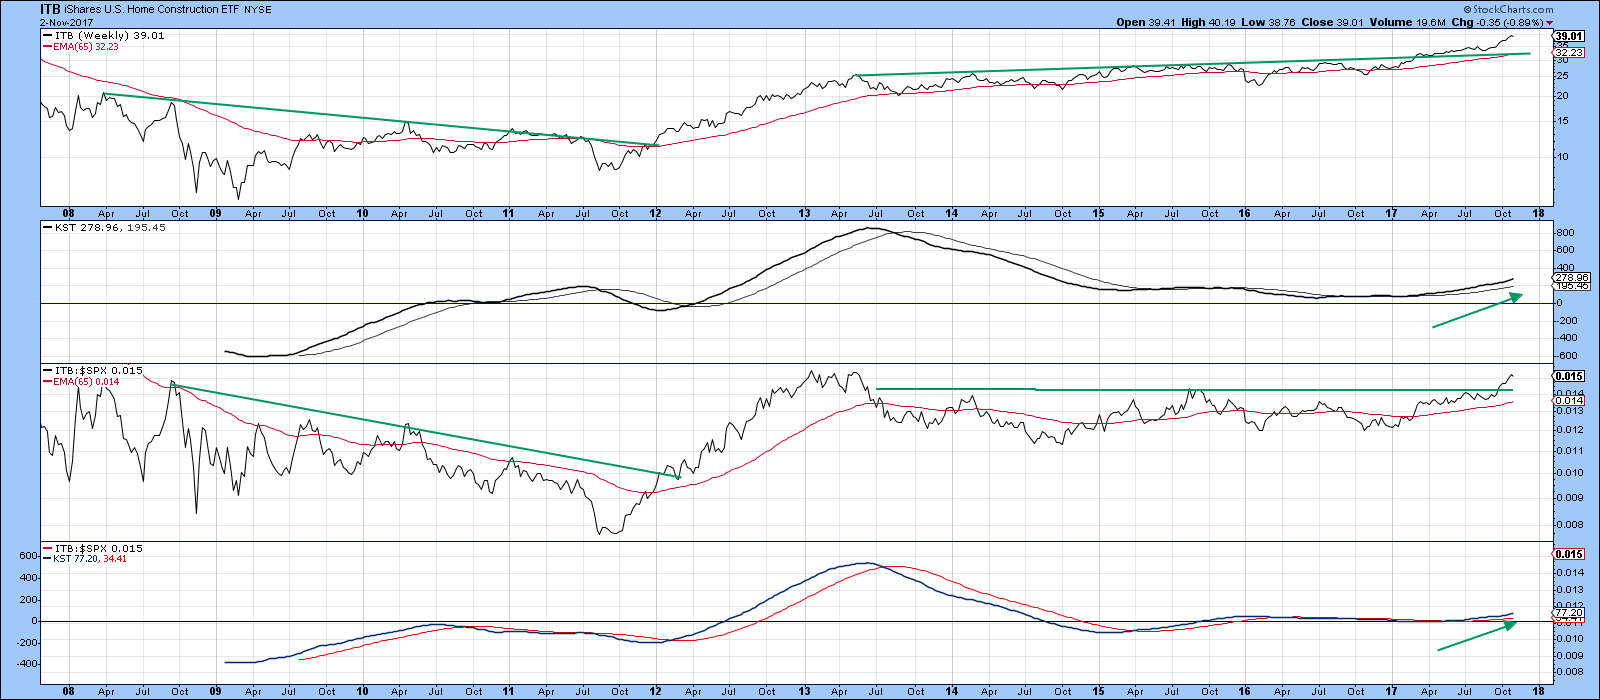
Chart 4
Euro and yen looking near-term vulnerable
Both the euro and yen have look vulnerable over the near-term. The difference between them is that the euro is currently signaling a bull and the yen a primary bear market. That suggests that of the two, the euro is likely to be the less vulnerable.
The euro has recently broken down from a complex head and shoulders top and experienced a small retracement move back to the breakdown point. If the top is valid we would expect to see a decline to new lows. On the other hand, if the break is a whipsaw, that would be confirmed with a rally above the green down trendline, which is currently around 117.60.
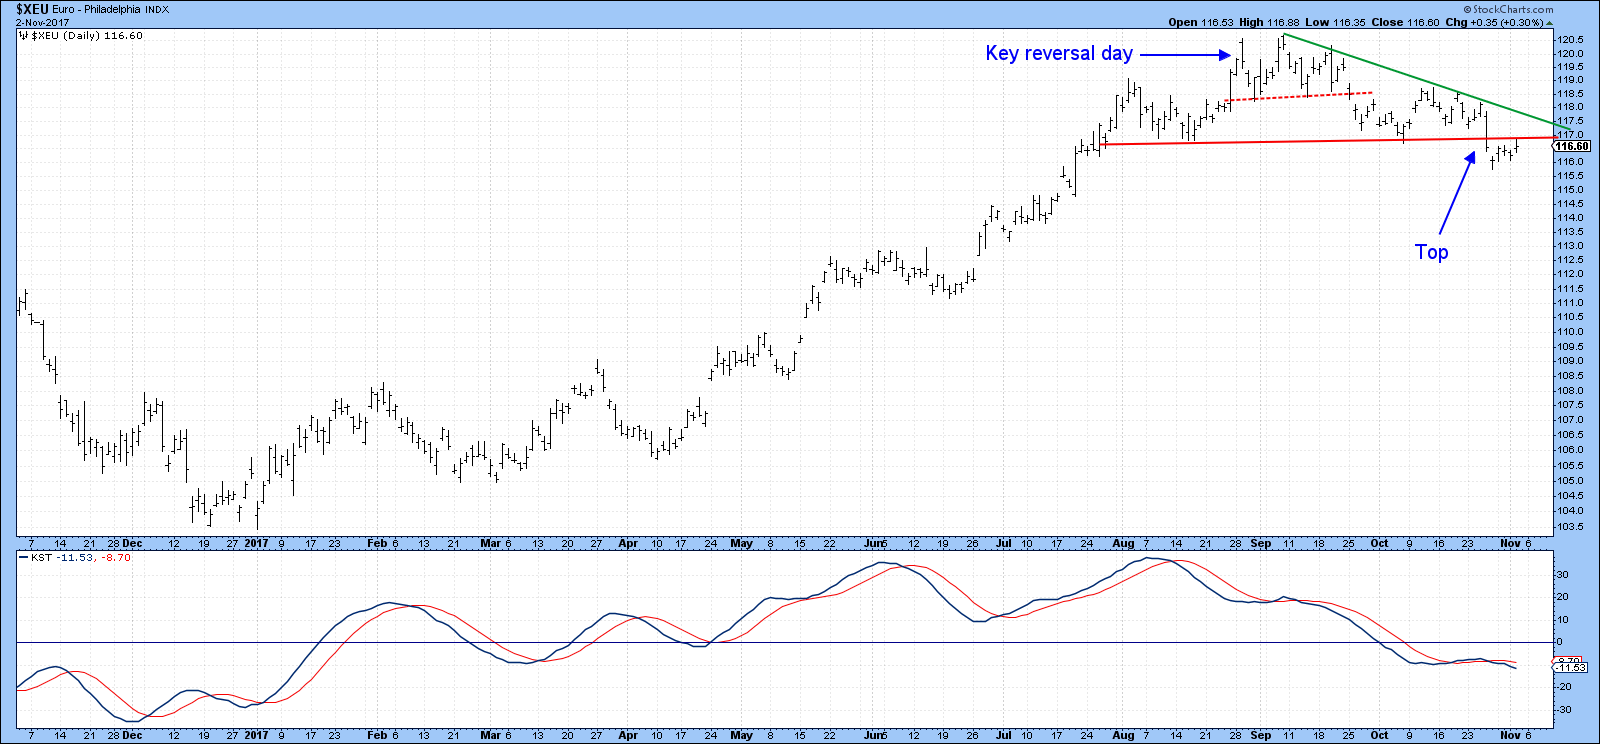
Chart 5
The longer-term Chart (Chart 6) shows that the euro, having completed a multi-year top in 2015, is now in a primary bull market since its KST is positive and the price is above its 12-month MA. In bull markets, corrections are fairly limited, which is one reason why the short-term head and shoulders in Chart 5 may not “work”.
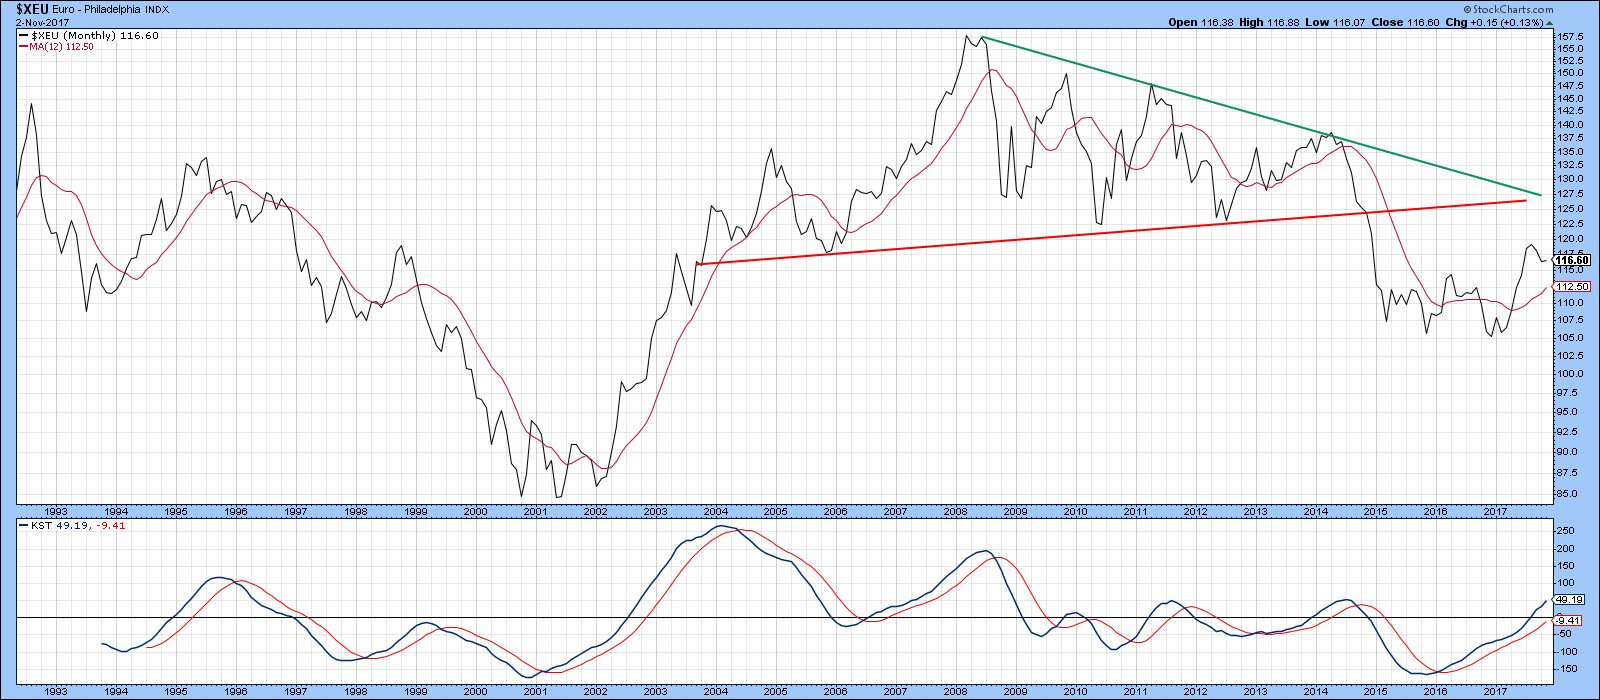
Chart 6
The yen is edging below a key up trendline, that looks suspiciously like the neckline of an upward sloping head and shoulders formation.
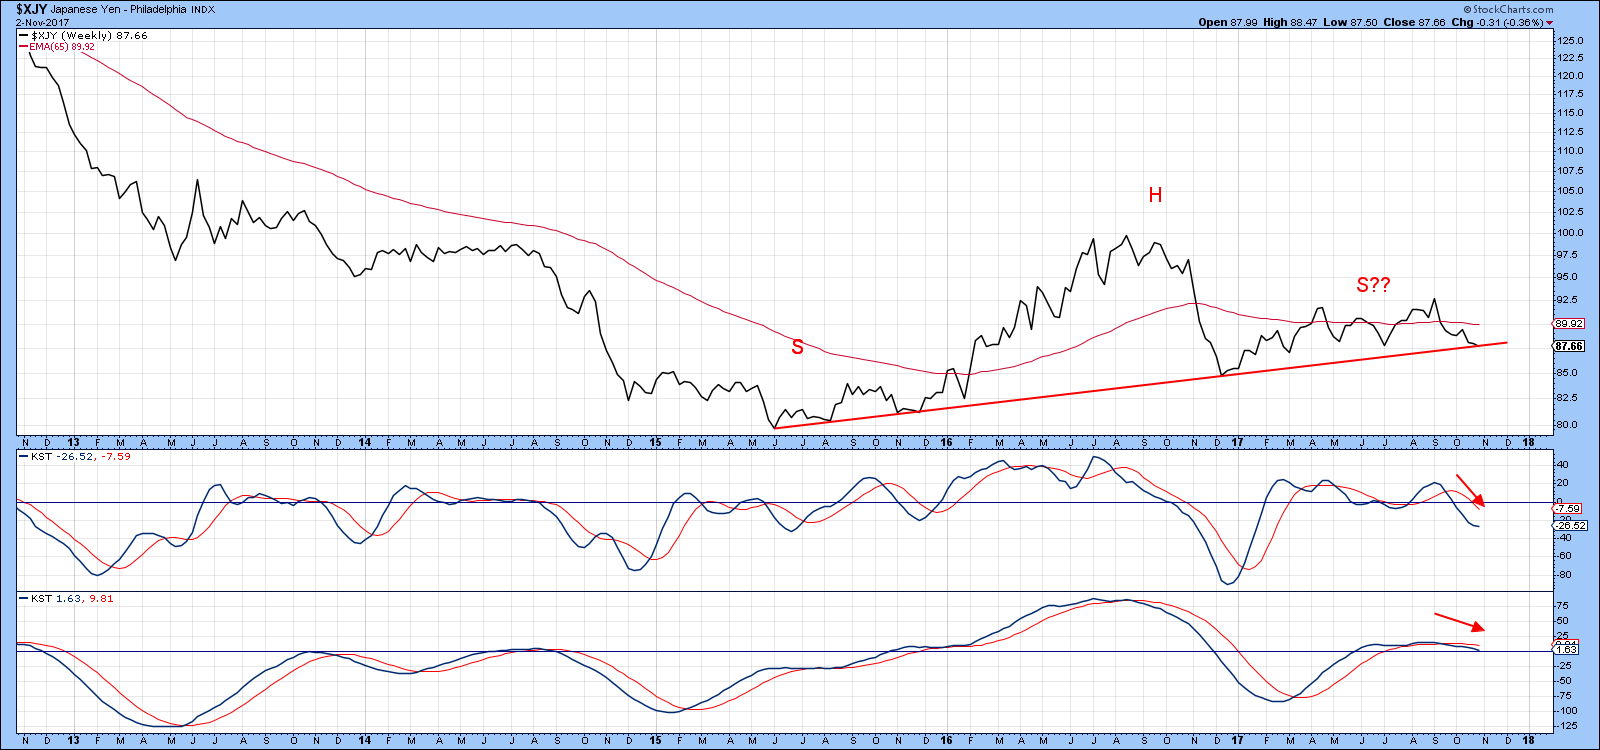
Chart 7
Its violation would normally be a serious matter, but in the current situation is being enhanced by the fact that its penetration could sow the seeds of a bigger decline that would push the currency below the multi-year trendline in Chart 8. Note that the yen is already signaling a primary bear market because it is below its 12-month MA and the long-term KST is bearish.
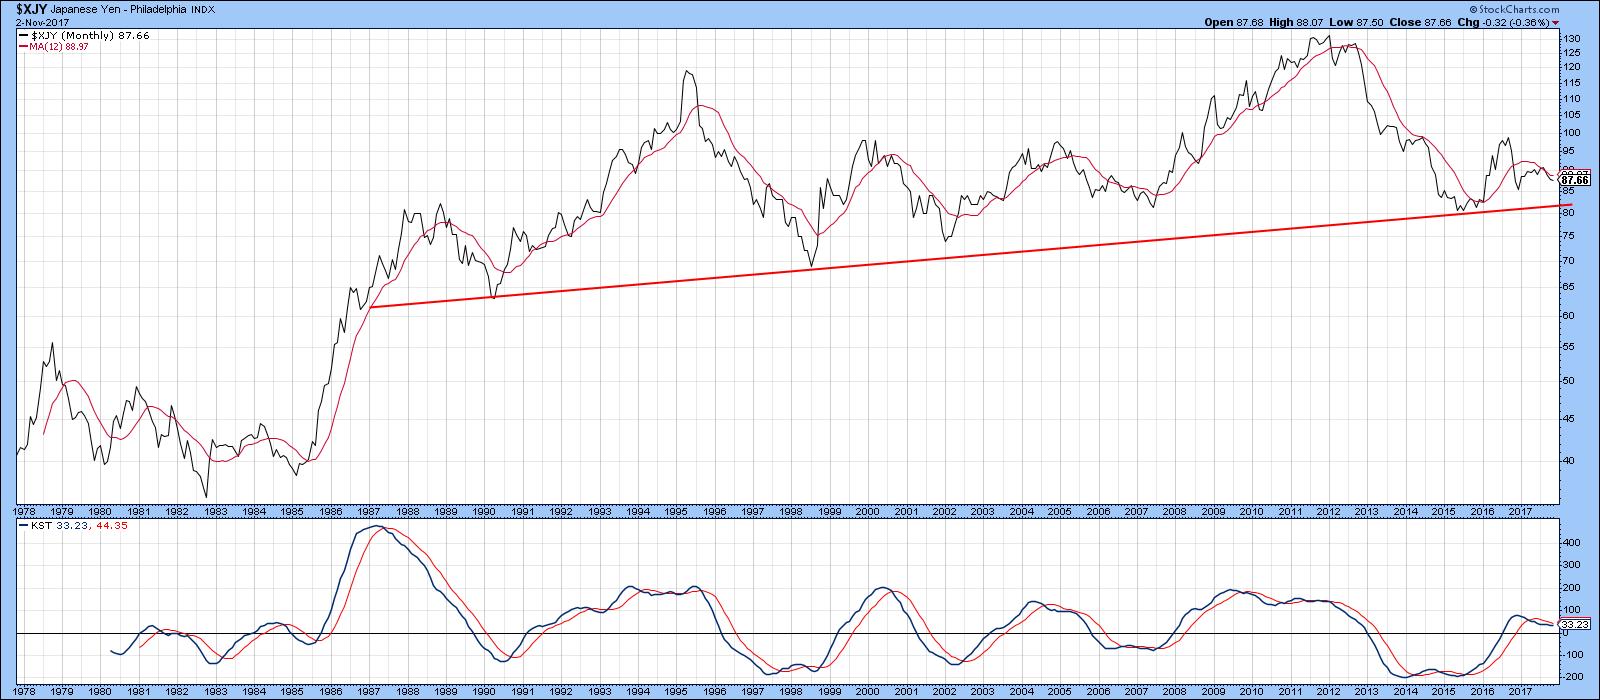
Chart 8
Good luck and good charting
Martin J. Pring
The views expressed in this article are those of the author and do not necessarily reflect the position or opinion of Pring Turner Capital Group of Walnut Creek or its affiliates.


