Dollar Bear Market Is Not A One Way Street
- Dollar experiences a short-term reversal
- Commodities are in a bull market but adversely affected near-term
- Gold showing signs of tiredness but still within a base building process
Dollar experiences a short-term reversal
It’s a funny thing in markets, when you have just grown comfortable with a move, it sometimes unexpectedly reverses in your face. That seemed to happen to the Dollar this week. Expectations were for a lower currency, a mood that was greased by the Treasury Secretary calling for a weaker currency, pile in sell, it’s going much lower. I am not saying that the bear market is over, but technical characteristics for the Dollar, commodities and precious metals on Thursday, suggest a short-term pause in their prevailing trends is likely.
Chart 1 shows the PowerShares DB US Dollar Bullish Fund (UUP). Following a sharp and accelerating drop, the price experienced an outside bar on Thursday. An outside bar develops when the price range totally encompasses the trading range of its predecessor. Such one-day patterns indicate a reversal in the balance between buyers and sellers, in this case in favor of the buyers. Note also the exceptionally heavy volume, which suggests a selling climax is underway. You can also see that the PVO has reached a very elevated level, which is again indicative of a selling climax. Outside bars have a very short-term effect, lasting between 5 and 10 sessions usually. During that period though, there can be sufficient consolidation action that results in a reversal in a short-term oscillator, such as an MACD. None of this does anything to change the course of the longer-term indicators, but it does suggest that a rally or consolidation may be in the offing as those who shorted on the Treasury Secretary’s remarks begin to have second thoughts.
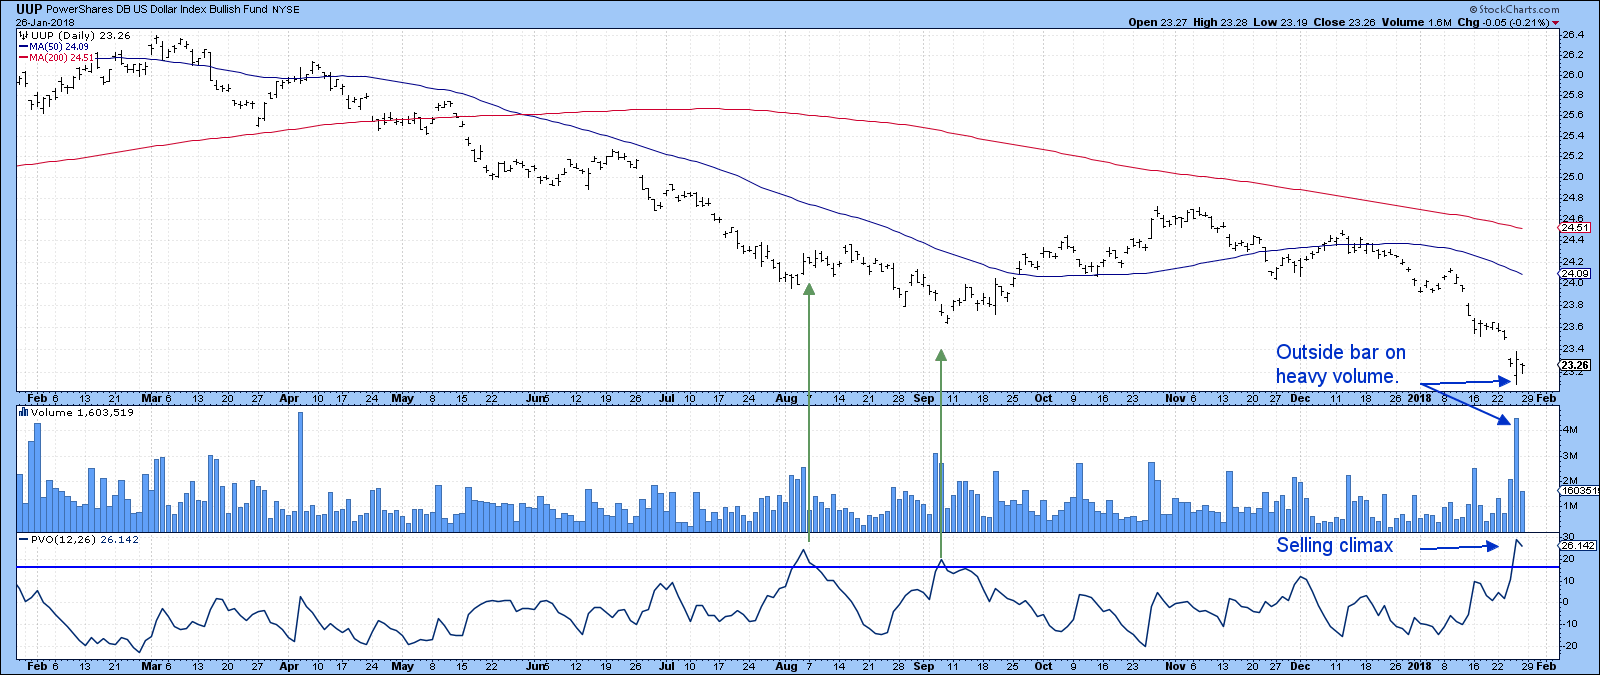
Chart 1
Not surprisingly, we see similar types of exhaustive activity in several currencies. Chart 2 tells us that the Euro, which has a 57% weighting in the Index, is also showing signs of exhaustion. That’s because traders bid up the price sharply during Thursday’s session. By the close however, it returned to where it started. That left most who bought during the day taking home a loss, which will weigh on future trading sessions. Friday’s session confirmed the idea of exhaustion as the price traced out an inside day, where neither buyers nor sellers had the upper hand. Should Thursday’s high be taken out, that would be very bullish since the market would have ignored a definite short-term negative. As it stands right now, though, the KST is very overstretched on the upside and a pause in the uptrend looks likely.
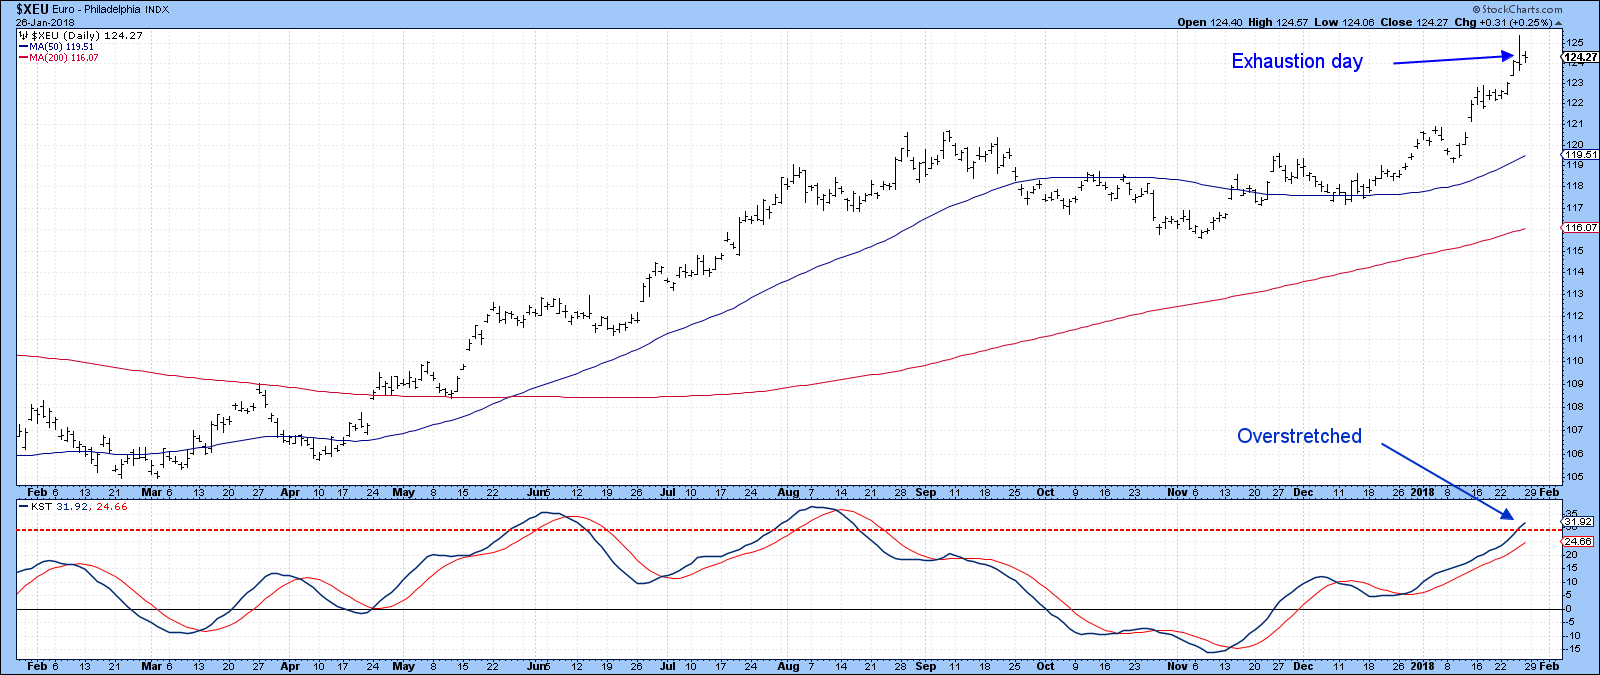
Chart 2
We see the same thing exhaustive characteristics, but with even greater emphasis, for the Swiss Franc. The wider the bar, the greater the battle and the more significant the victory. By any stretch of the imagination Thursday’s action was pretty impressive in terms of width and therefore battle intensity.
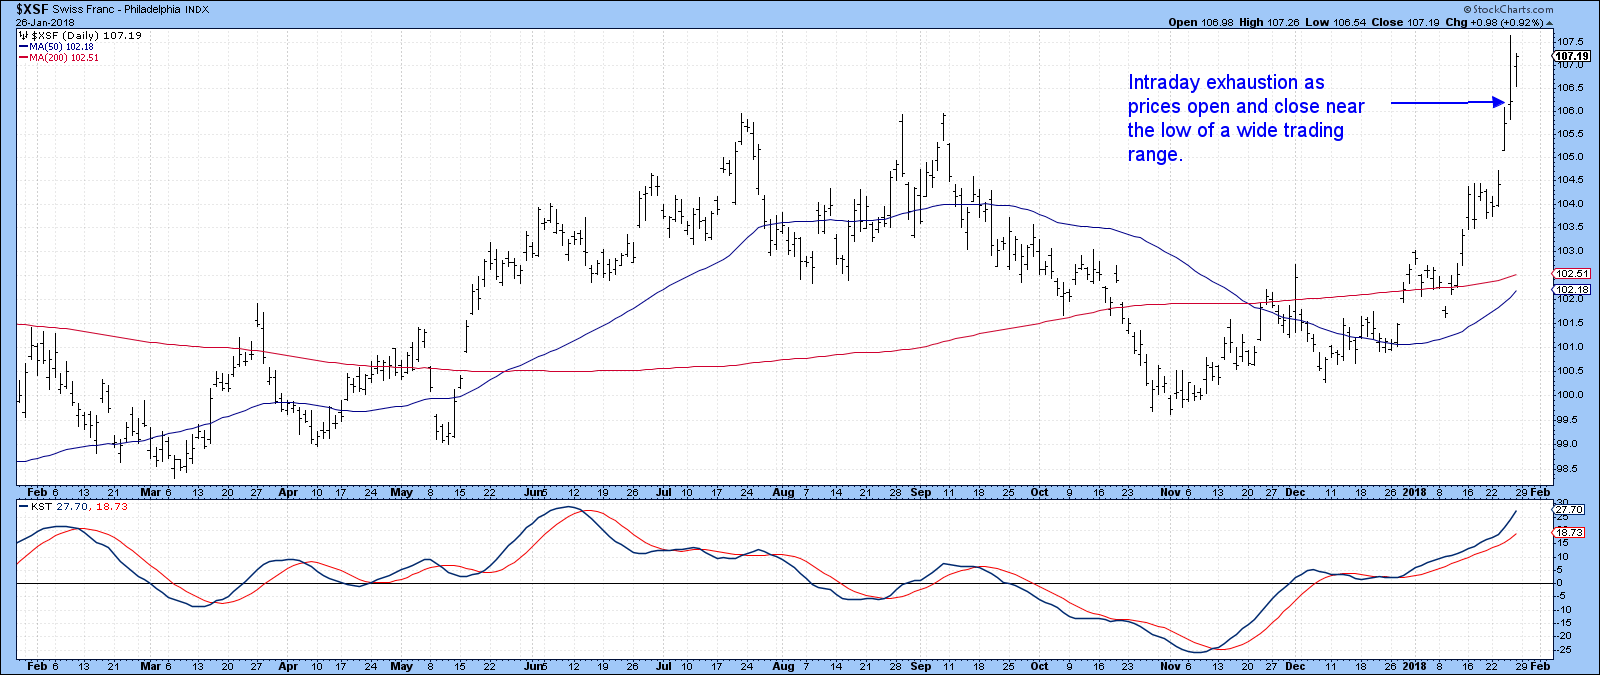
Chart 3
Chart 4 indicates that the British Pound has also experienced an outside day. The lower window reveals a small engulfing pattern.
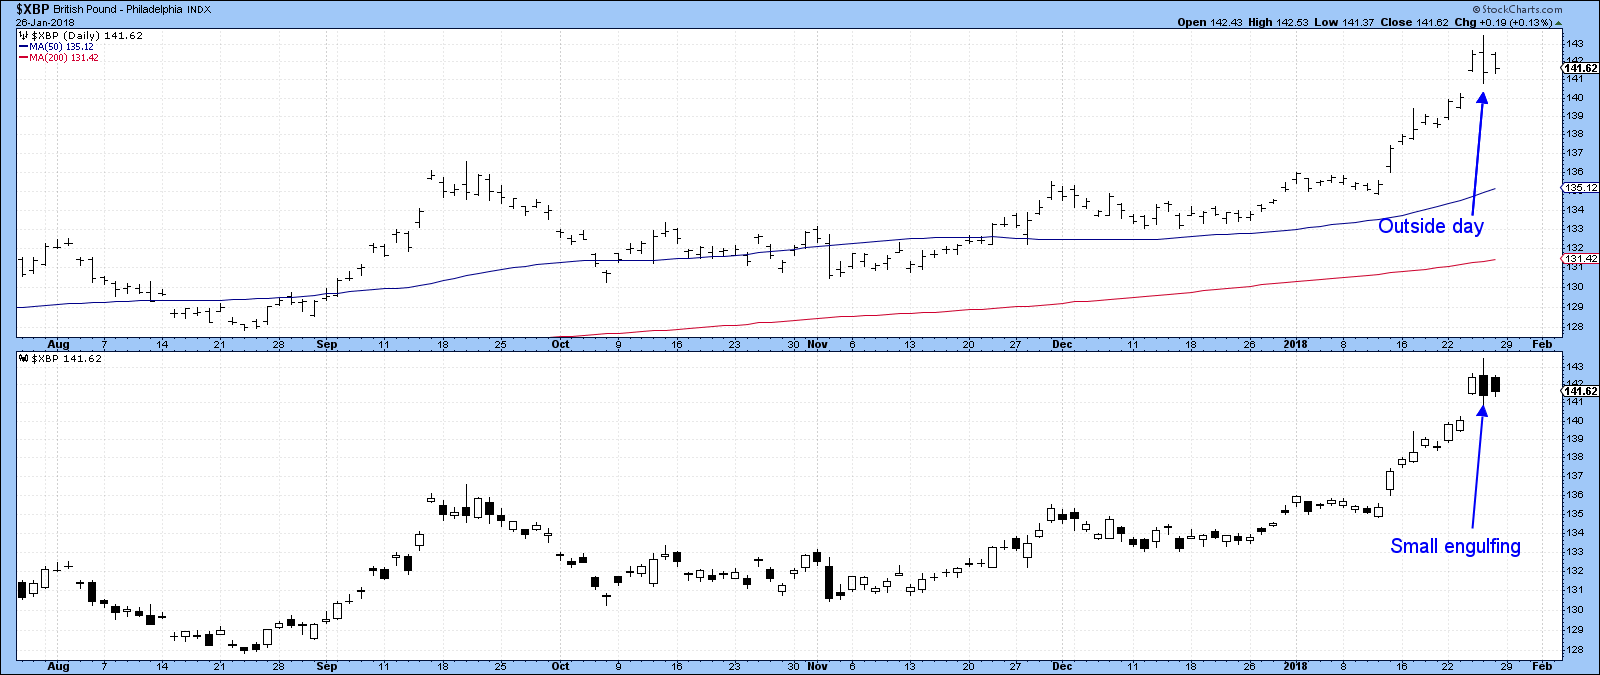
Chart 4
Finally, Chart 5 shows that the Canadian Dollar also experienced a small outside day, though this does not look as powerful as that for the pound.
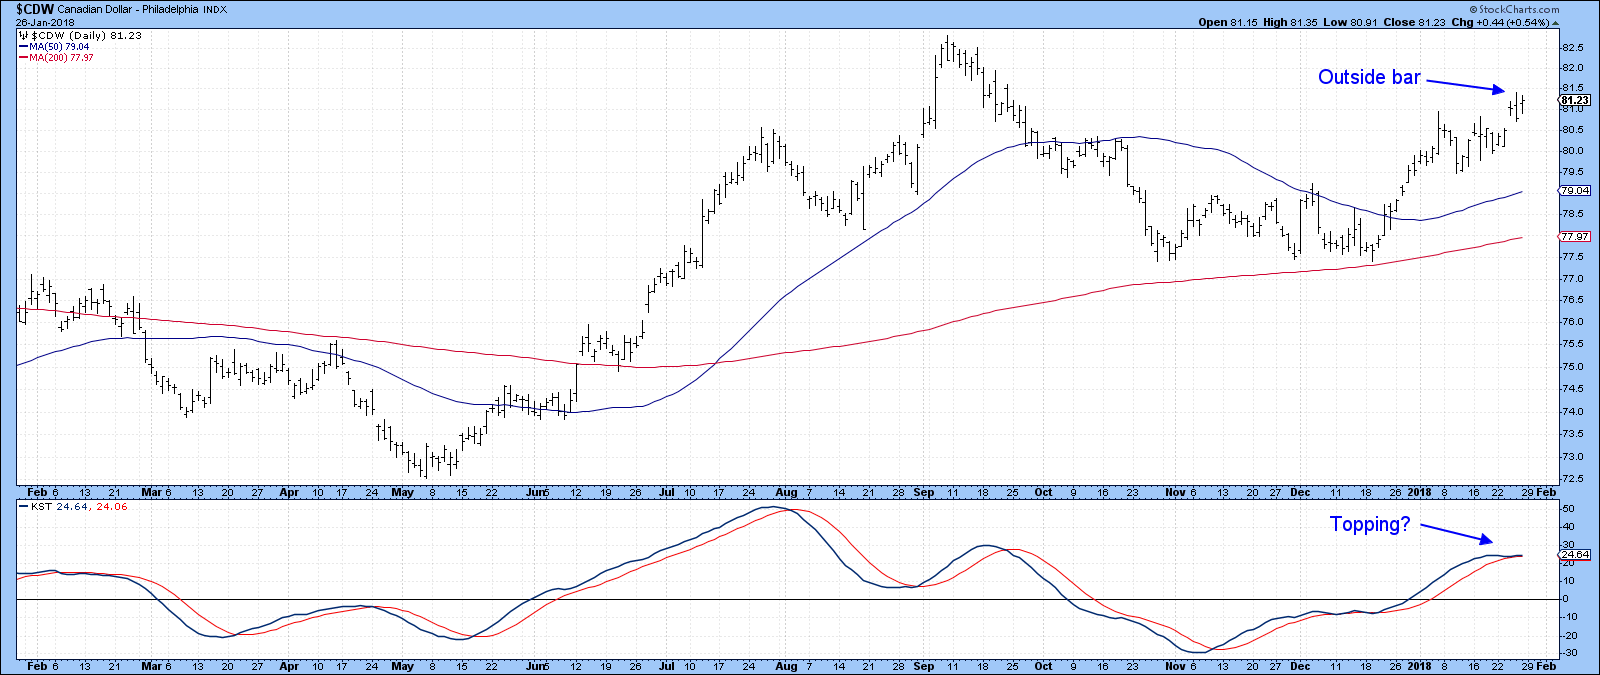
Chart 5
I want to stress that none of these technical characteristics are game changers as far as the bearish primary trend for the Dollar is concerned. However, they do suggest that the one-way street that seemed apparent earlier in the week is likely over, and that the bear market will be resumed later rather than sooner. When the Dollar changes direction that usually drives other markets as well. Let’s start with commodities.
Commodities are in a bull market but adversely affected near-term
By all trend following accounts, commodities are in a confirmed bull market. However, Chart 6, which features the Bloomberg Commodity ETN, the DJP is suggesting a pause. That’s because Thursday’s action turned out to be the second candle in a dark cloud cover formation. These occur when, after a strong rally, the price of the second, black candle, opens above the high of the previous (white) session. It then closes more than half way down the real body of that first candle. These patterns are generally pretty reliable, although that certainly does not happen every time, as we saw in the equity market last week. In this instance I am not sure that it is a full-fledged example because it barely closed half way down Wednesday’s candle, hence the question mark in the legend.
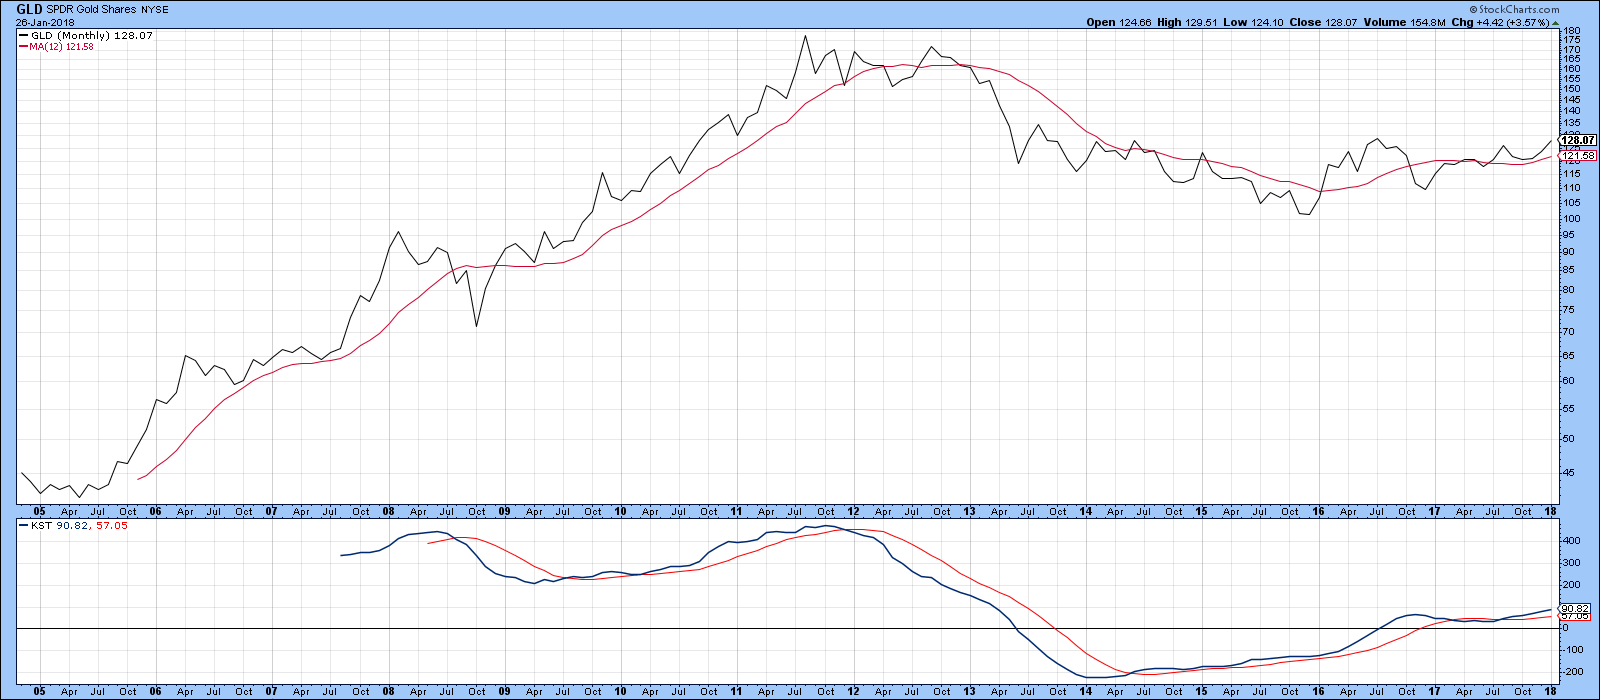
Chart 9
Good luck and good charting,
Martin J. Pring
The views expressed in this article are those of the author and do not necessarily reflect the position or opinion of Pring Turner Capital Group of Walnut Creek or its affiliates.


