Dollar Index Is Just Above Make Or Break Support--- Will It Bounce Or Break?
Dollar Index is in a confirmed bear market
- Dollar sympathy indicators are close to a major breakdown
- Canadian and Aussie dollars are driven by commodity prices
- Emerging Market ETF benefiting from a weaker dollar
Dollar Index is in a confirmed bear market
As 2018 begins to unfold the Dollar Index ($USD) is moving ever closer to a major breakdown point. Moving ever closer and actually breaking are two different things, so in this article we will try to see what might happen. Chart 1 shows that the Index is well below its 12-month MA and the long-term KST is declining. Both represent objective signs that a primary bear market is in force. Note that the Index is also trading below the neckline of a potential downward sloping head and shoulders. Since this is a monthly chart based on month-end closes and its early in the month, that’s not a real breakdown yet. If it’s still there on January 31 it will. However, this tentative break does underscore the critical nature of the current technical position.
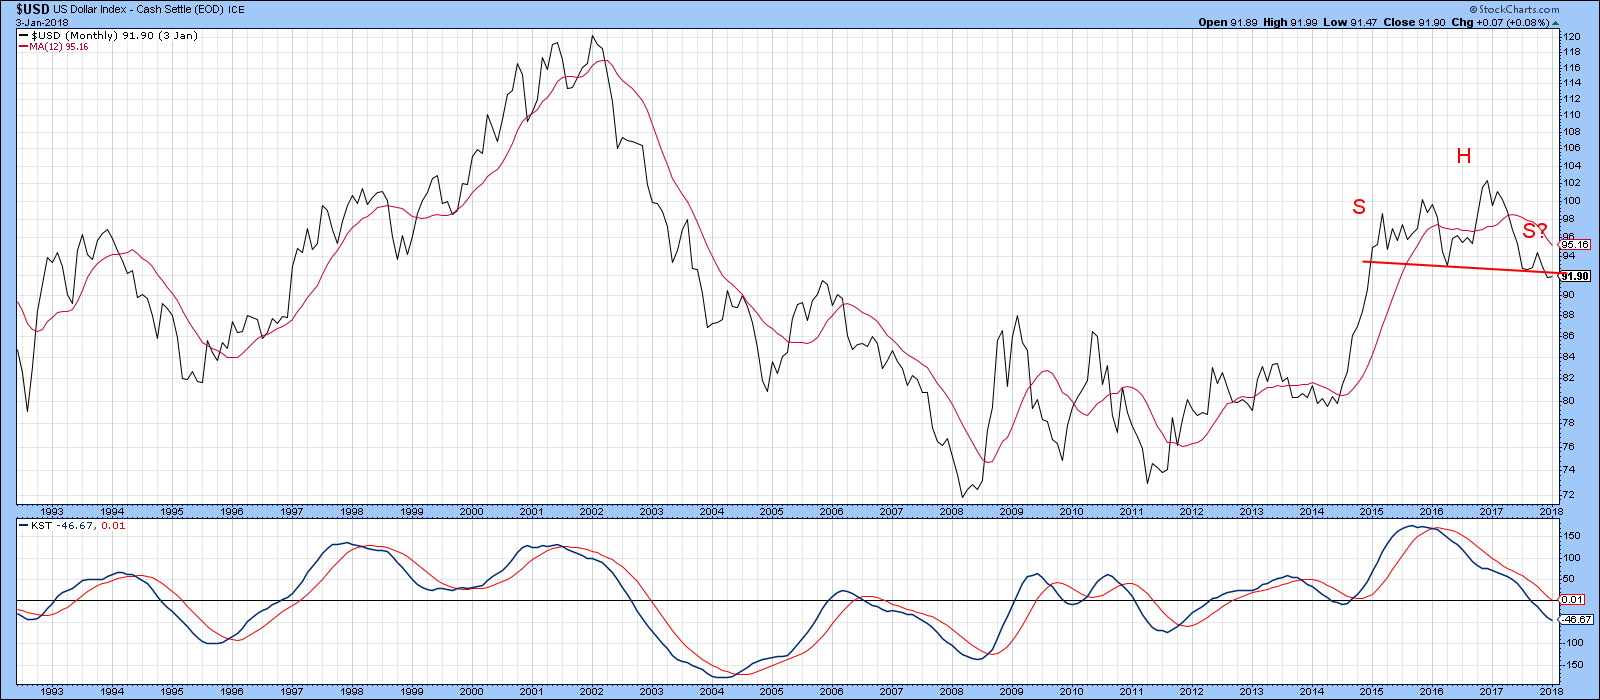
Chart 1
Dollar sympathy indicators are close to a major breakdown
Sometimes we can get a clue as to future dollar performance from what I call “dollar sympathy indicators”. These are intermarket relationships that swing in “sympathy” with the Index. Charts 2, 3 and 4 feature some of them. Chart 2, for instance, compares the performance of the Index with a ratio calculated by dividing a US bond proxy (Barclays Aggregate Bond ETF) the AGG, by the BWX. That’s the Barclays International Treasury ETF, which is essentially the rest of the world. When the ratio rises, it means the AGG is out performing the BWX. This is typically associated with a rising dollar and vice versa. As you can see, the ratio has recently sold off and, like the Index itself, is currently resting on the neckline of that potential head and shoulders top.
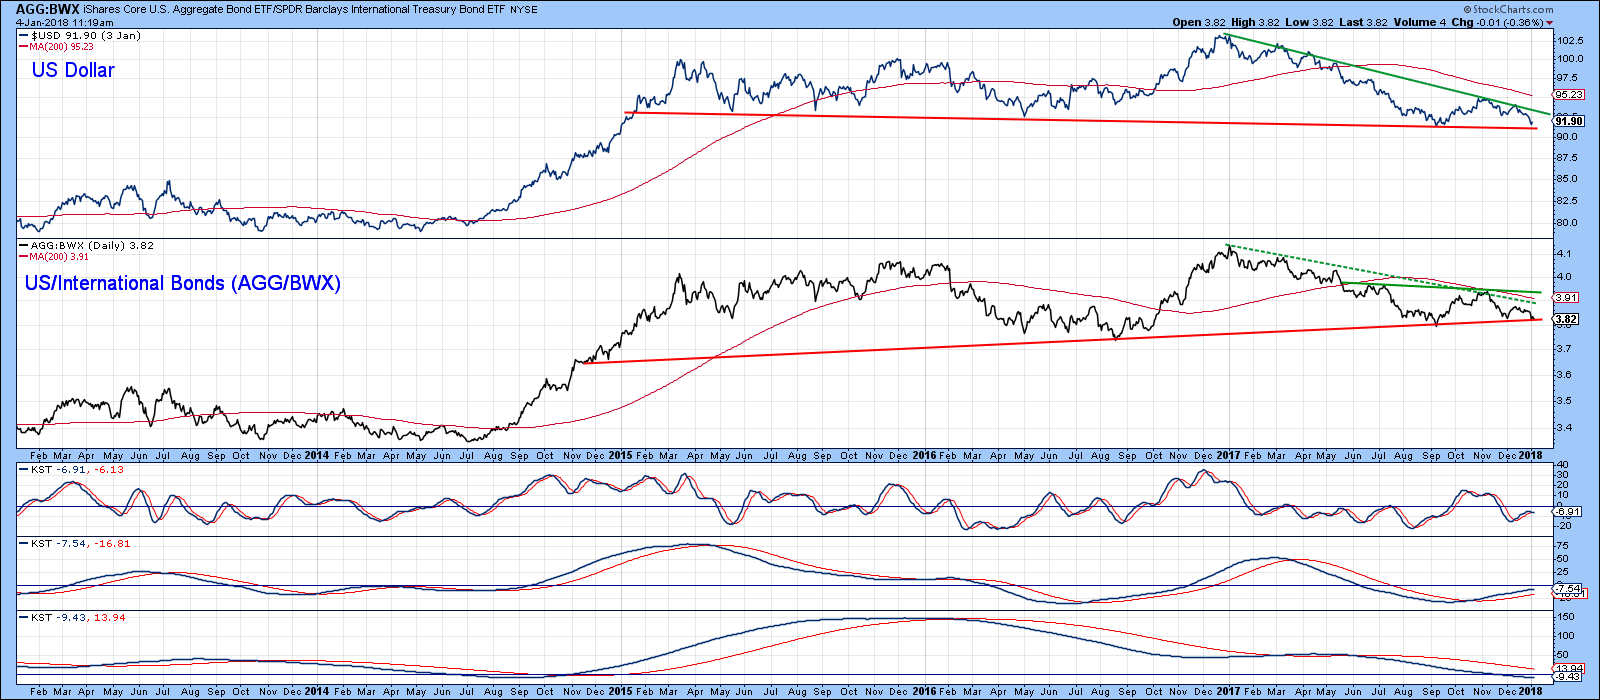
Chart 2
Chart 3 sports a similar relationship, this time between the S&P Composite and the Vanguard FTSE All World Ex US Stock ETF ($SPX/VEU). The green shaded areas flag periods when this relationship is in a rising trend favoring the US. All such periods have been associated with a rising dollar. This relationship also looks like it may be forming a head and shoulders as well.
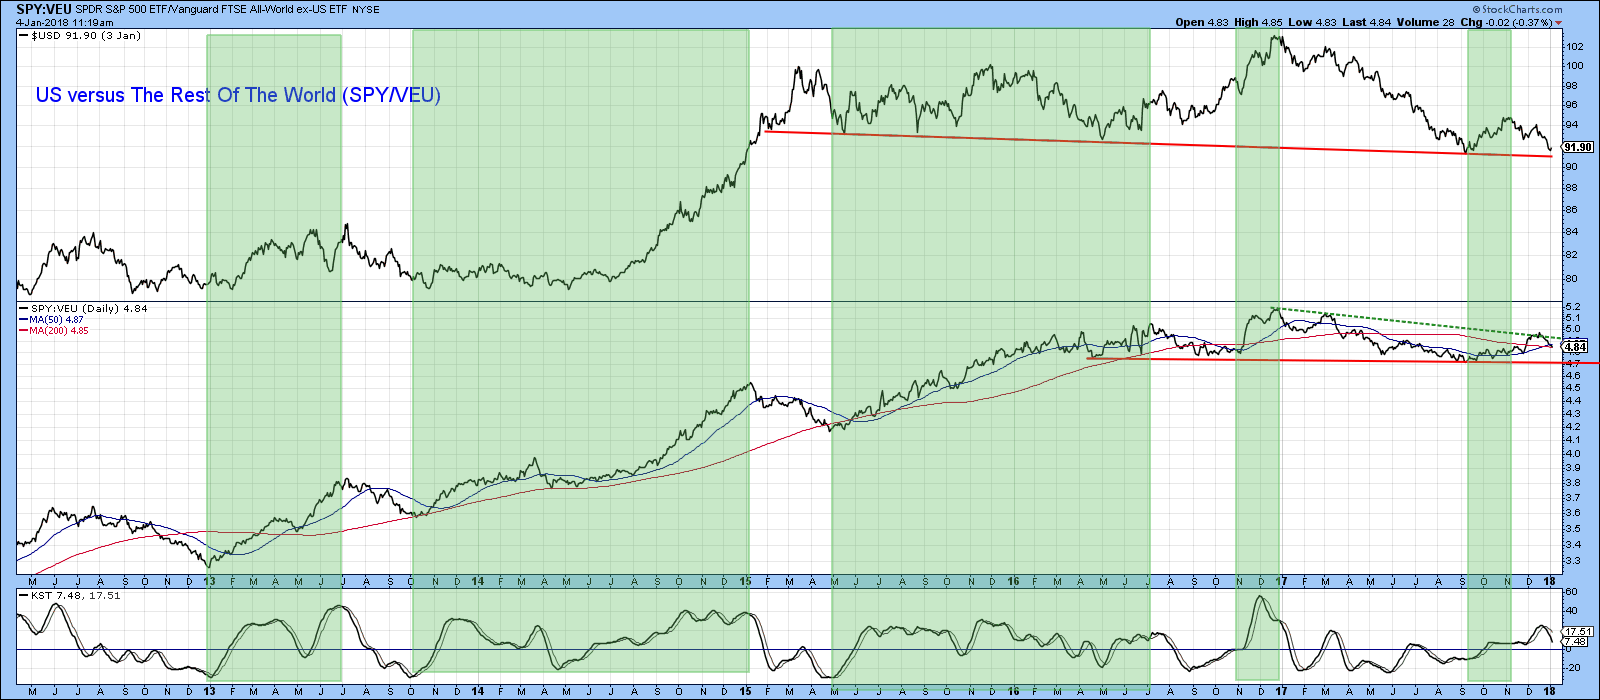
Chart 3
Finally, Chart 4 compares the performance of the dollar to commodity prices. Since this relationship is an inverse one, the CRB Composite has been plotted inversely, so that both series move more or less in the same direction. Once again, the sympathy indicator looks as though it is in the process of completing a top, though in this case a marginal penetration of the red trendline has already taken place.
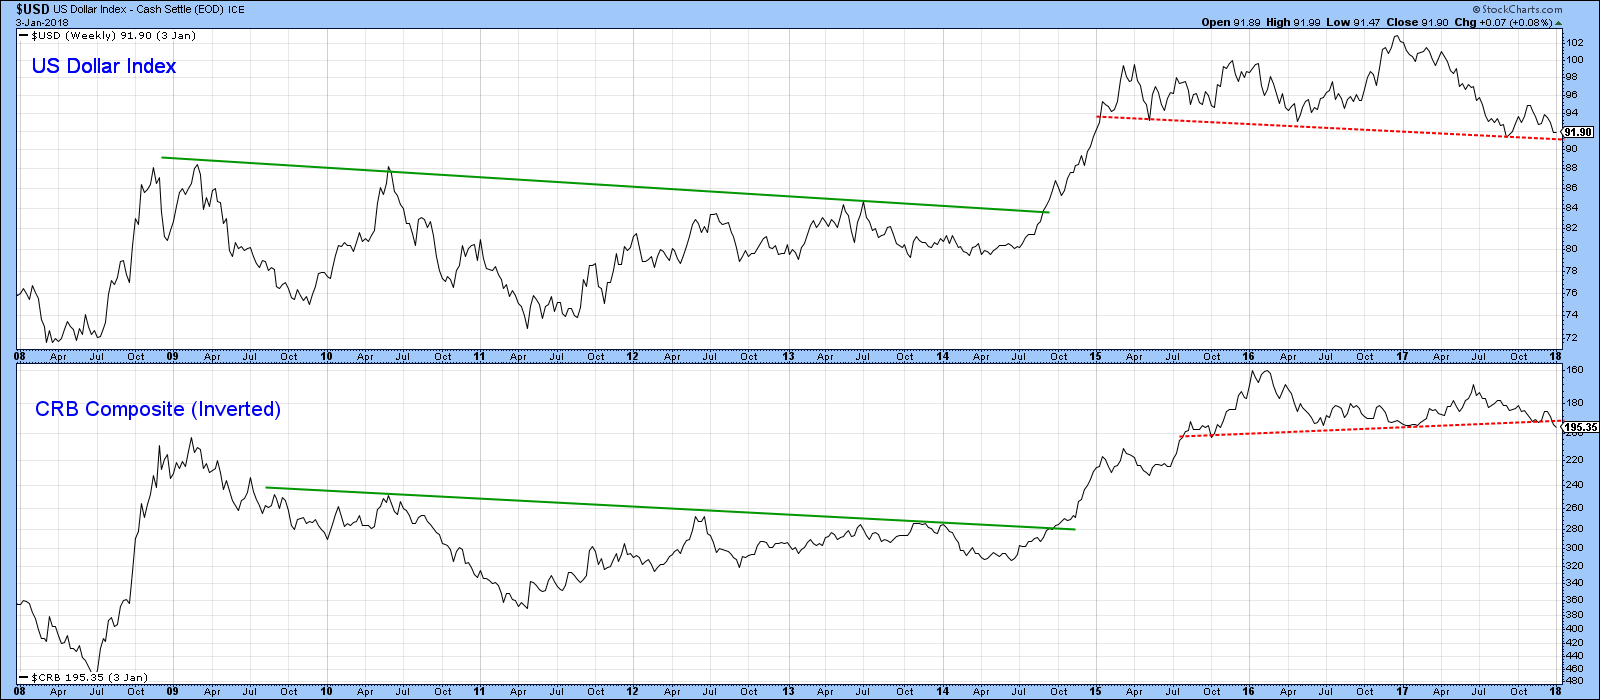
Chart 4
All-in-all it is evident that each of these relationships and the Dollar Index itself have reached crucial support. When many markets or relationships are acting in a similar fashion, that “commonality” enhances the significance of any break. Ergo, whether these markets bounce off support or break it, it’s likely to be the precursor of an important move. Since the Dollar is already in a confirmed bear market, the odds, and that’s all we can go on, favor a downside penetration. Stay tuned!
Canadian and Aussie dollars are driven by commodity prices
Charts 5 and 6, show that the Canadian and Australian dollars are very much driven by commodity prices, not on a tick-by-tick basis, but certainly in terms of larger term swings. Currently, both appear to be in the process of forming inverse head and shoulder patterns. It would take decisive Friday close 82.5c for the Canadian and 80c for the Aussie currency to achieve these goals. That seems likely because the short-term KST for both currencies has just turned bullish. The long-term KST (not shown) is also in a positive and subdued mode.
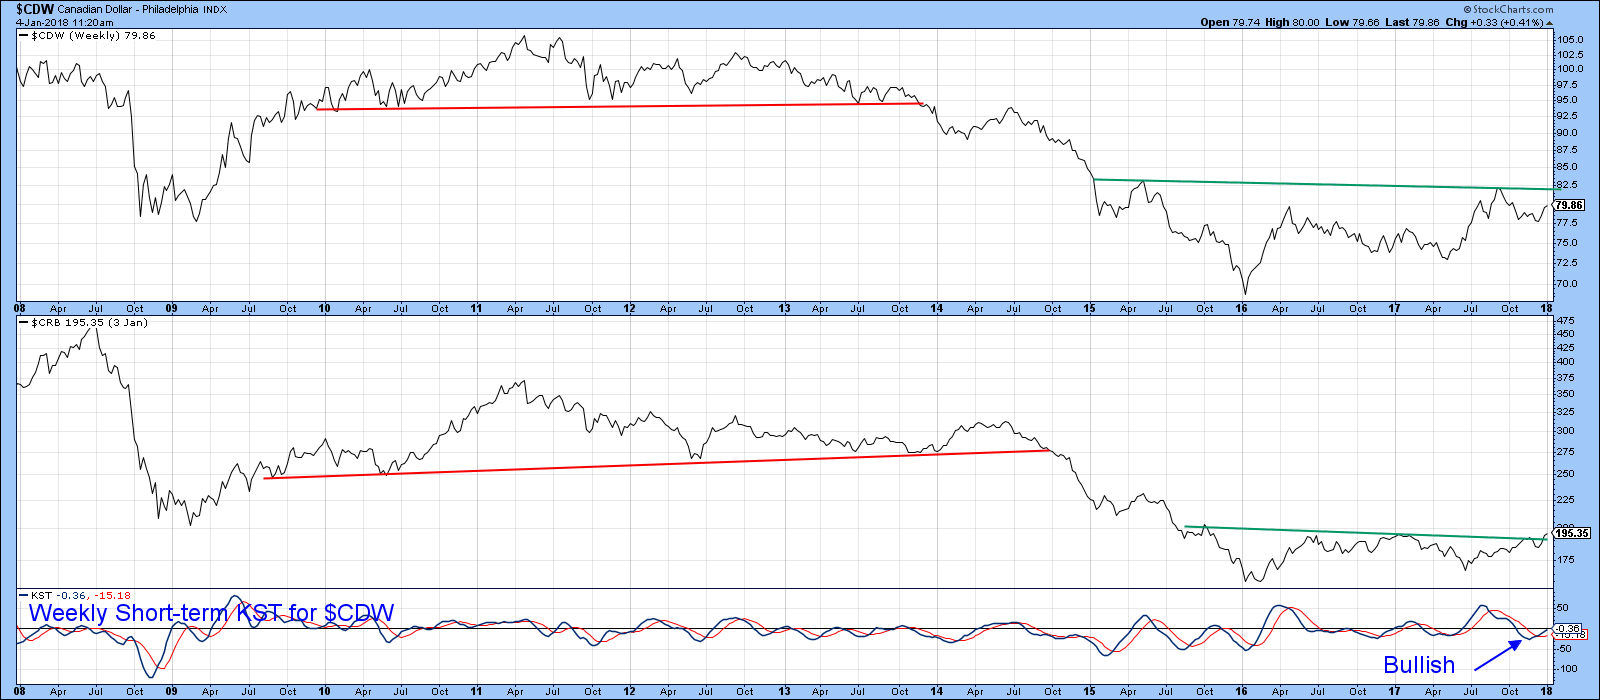
Chart 5
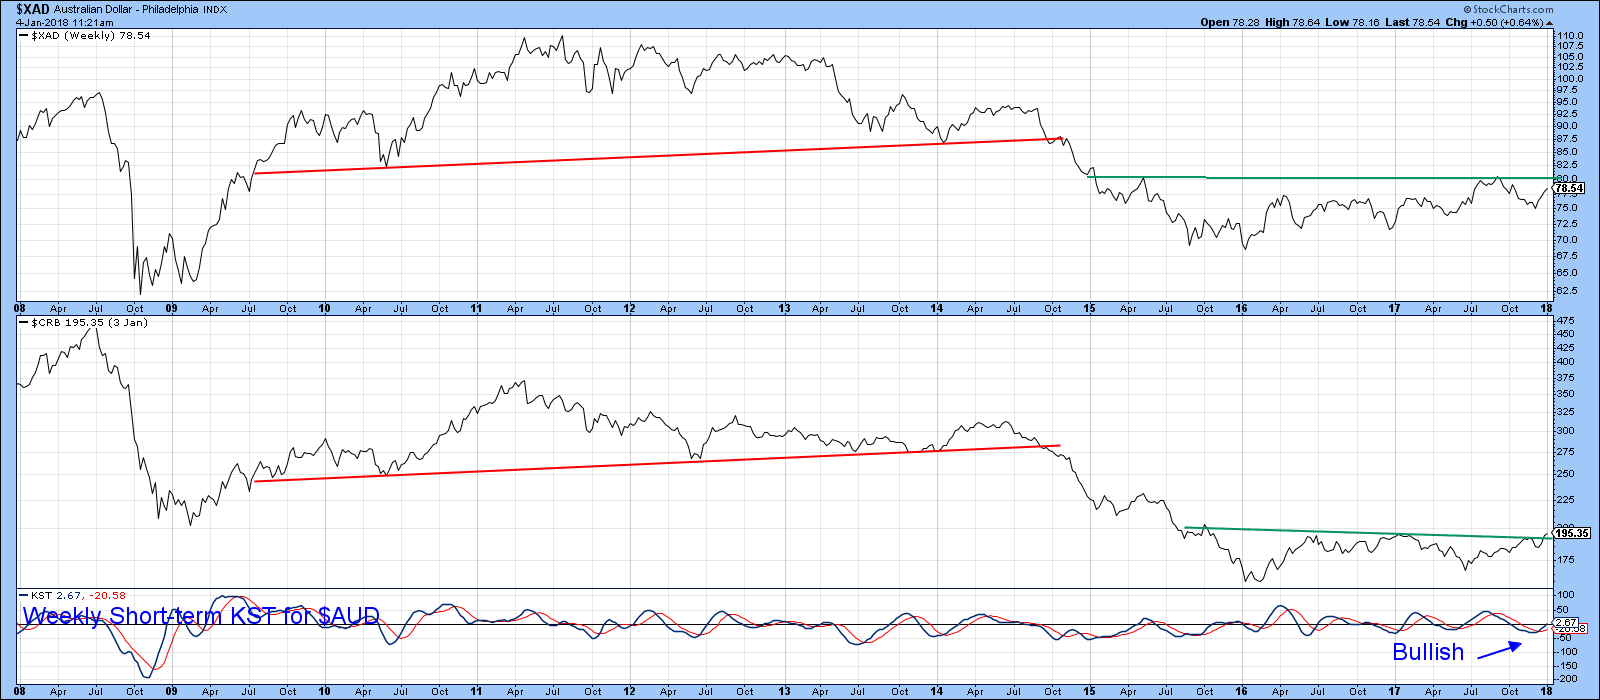
Chart 6
Emerging Market ETF benefiting from a weaker dollar
Chart 7 compares the MSCI Emerging Markets ETF, the EEM to the Wisdom Tree Emerging Currency Strategy Fund (CEW). The ETF itself recently emerged from a 10-year consolidation formation the CEW, for its part, has just broken above the red breakdown trend line and has therefore surpassed some pretty important resistance. Since the EEM has a fairly large weight in favor of commodity “commodity driven” countries this double breakout is a plus for that asset class.
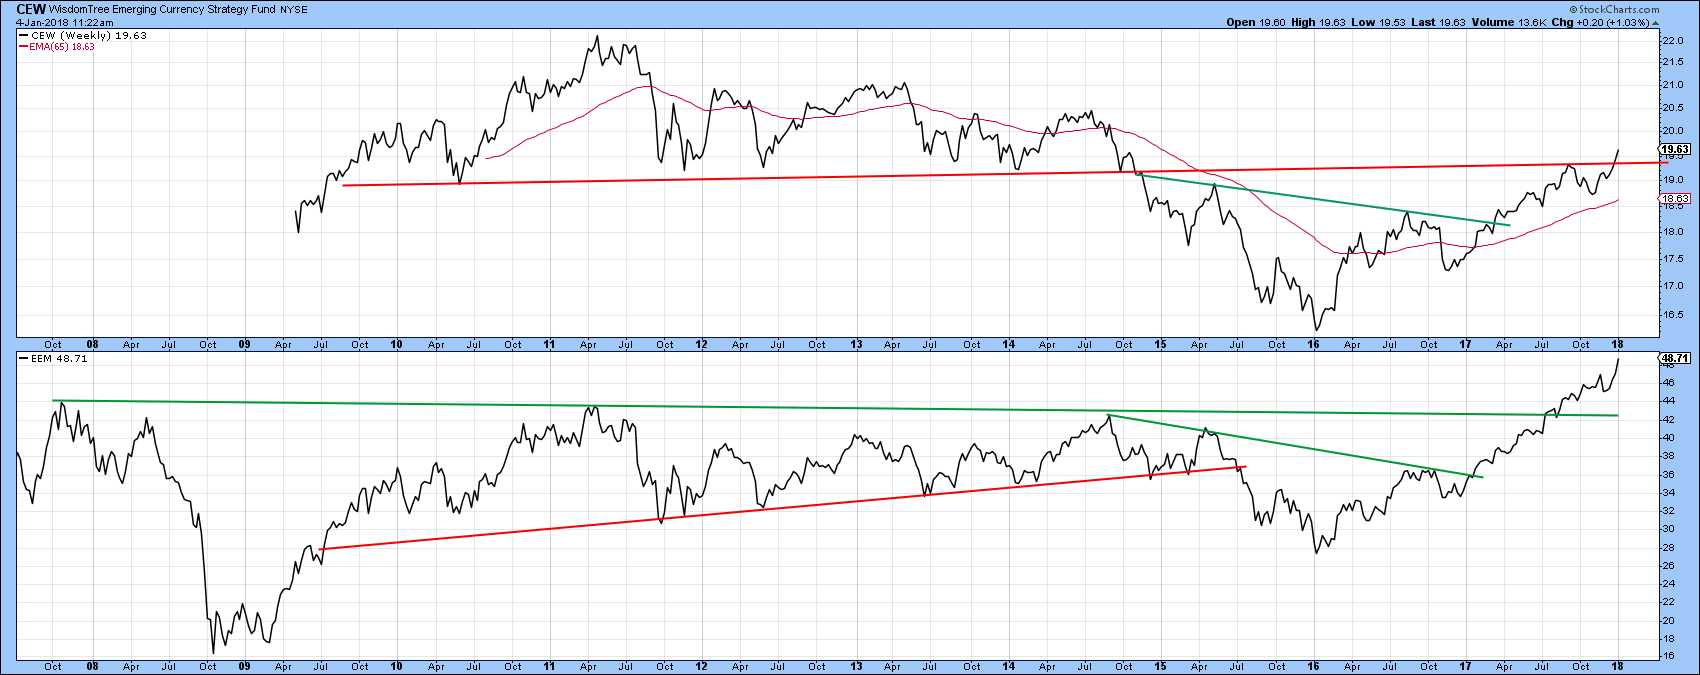
Chart 7
One country fund that has recently started to emerge is the MSCI South Africa ETF, the EZA. It too is influenced by natural resource prices, as you can see from Chart 8. Last month it emerged from a 6-year consolidation formation. Note also that the intermediate KST has not only gone bullish, but has also broken above a 1-year down trend line. A more friendly business climate there, combined with probable higher commodity prices makes this ETF worth monitoring in the months ahead.
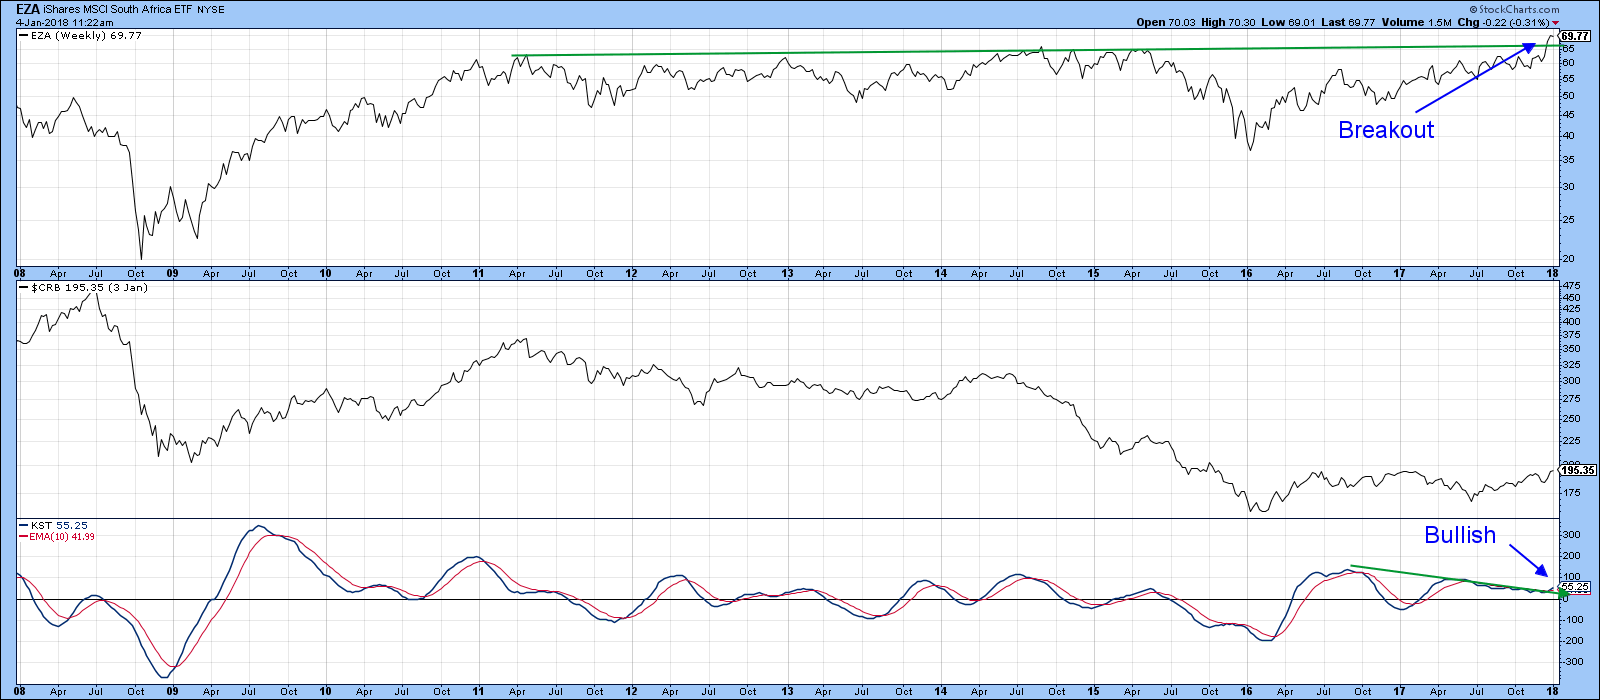
Chart 8
Good luck and good charting,
Martin J. Pring
The views expressed in this article are those of the author and do not necessarily reflect the position or opinion of Pring Turner Capital Group of Walnut Creek or its affiliates.


