Some Equity Markets Showing Signs Of Long-term Vulnerability
- Pinocchio argues for a test of the lows
- European equities are facing a big challenge
- Shanghai starting to look sick
Pinocchio argues for a test of the lows
Last week I suggested that the S&P had reached a resistance zone following its bounce from the early February panic low. You can see this from Chart 1. That led me to the conclusion that a test of those lows was a good possibility. Friday’s trading enabled the S&P 500 index ($SPX) to edge through that resistance on an intraday basis, but to close back down, under it. The S&P also retraced 61.8% of the previous decline, but closed well below this benchmark. That Friday action represented a bearish Pinocchio bar.
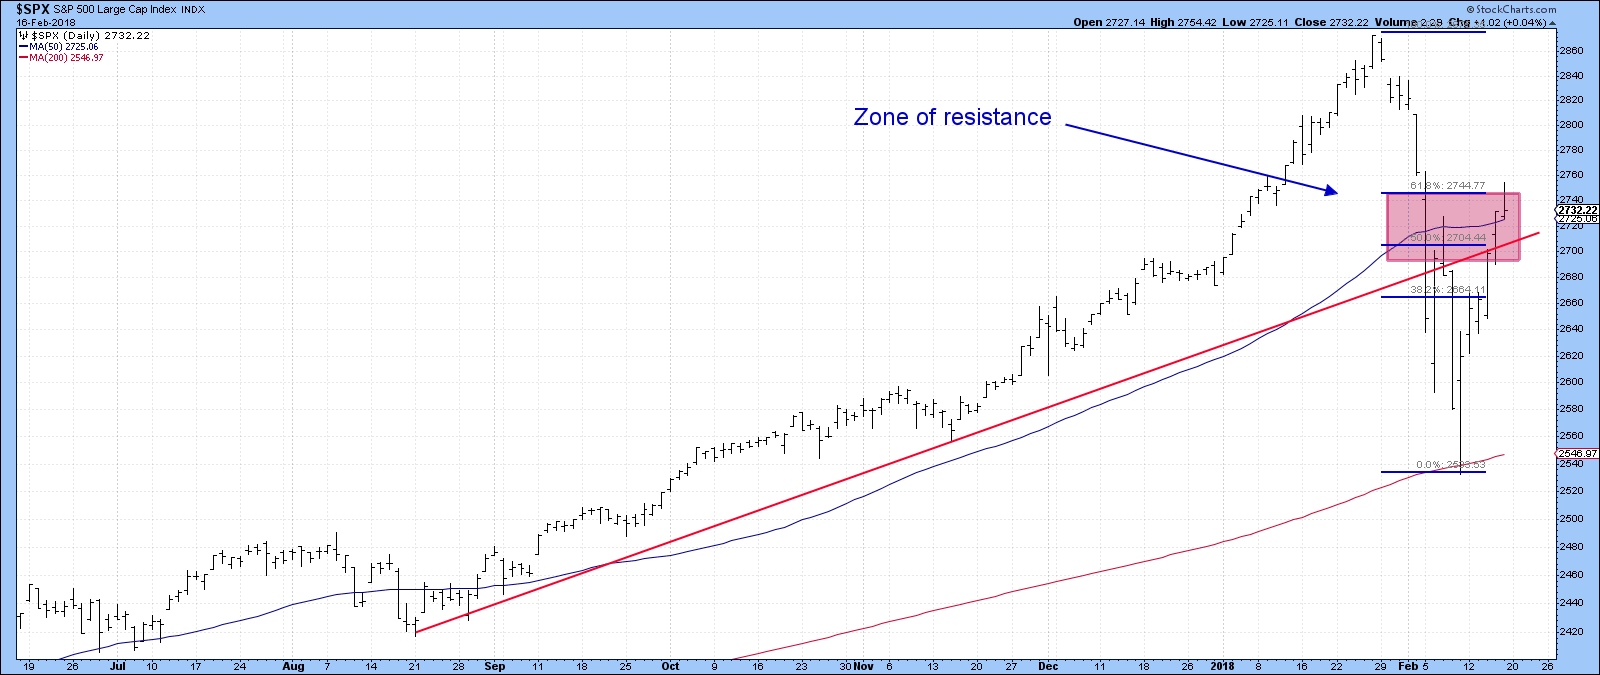
Chart 1
I have reproduced the Pinocchio for the Dow ETF (DIA) in Chart 2, so we can see it in greater detail. Bearish Pinocchio bars form as prices move above a specified level of resistance on an intraday basis, but the all-important opening and closing prices do not. That resistance could be a trend line, a moving average or even a previous high. The point being that most traders who bought during the course of the bar are coming home with a loss. That means that these positions are likely to weigh on future sessions, unless the Pinocchio is quickly invalidated with a move to new recovery highs. In a sense, it’s a form of exhaustion where buyers are unable to maintain prices above that resistance point. When buyers become exhausted, sellers often take over.
In Chart 2, we see the DIA temporarily break above two trend lines and close very near to them. This action suggests, but by no means guarantees, that a test of the recent low is getting underway. If that happens it would actually be very constructive. That’s because a few days of softness or consolidation would do two things. First, it would allow several short-term oscillators, that are currently oversold and declining, to re-group and reverse to the upside. Second, it would cause many traders to re-think the idea of a quick upside reversal to new highs, causing sentiment to grow more negative. From a contrary aspect, of course, that would be a welcome development.
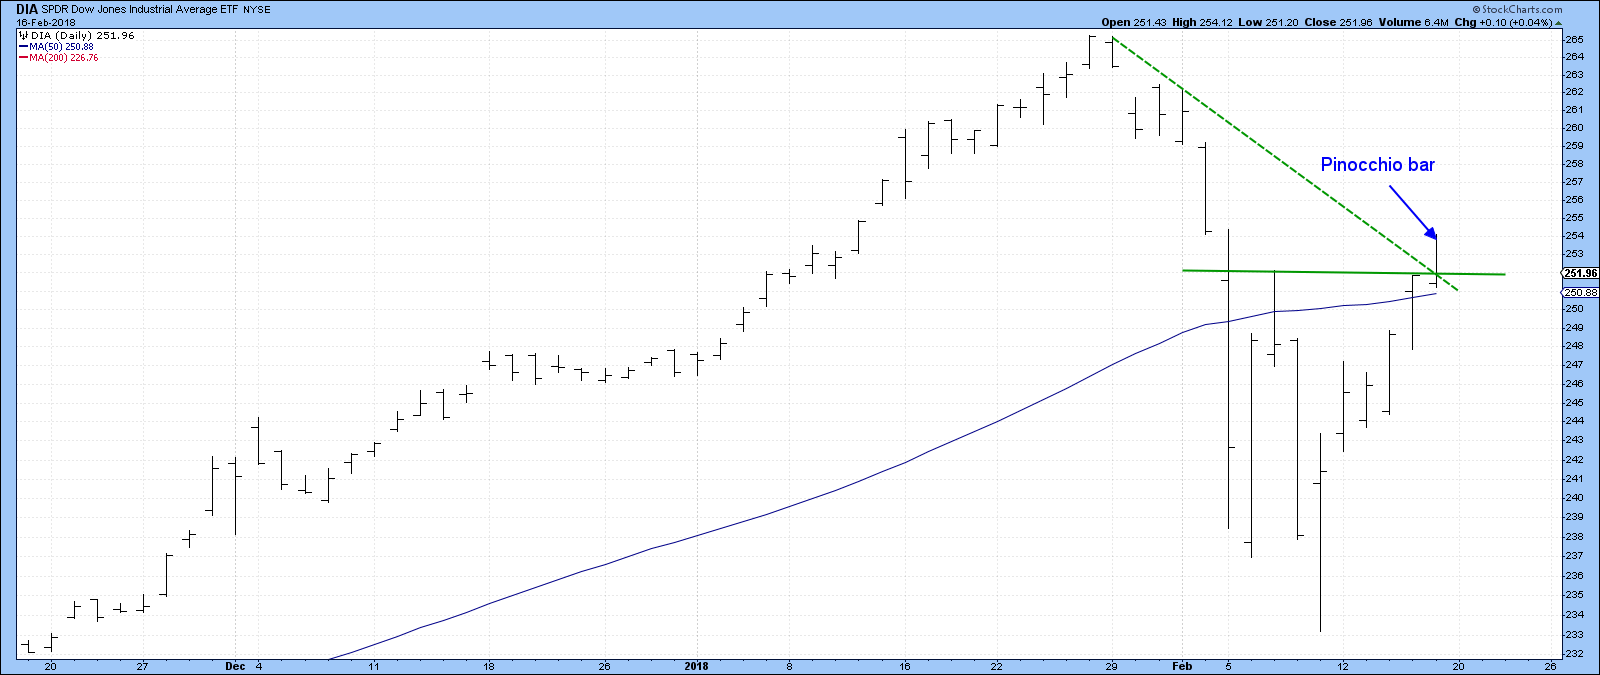
Chart 2
European equities are facing a big challenge
When viewed from a dollar adjusted aspect, European stocks look to be in a nice uptrend. Chart 3, for instance shows that of late the European Monetary Union ETF, the EZU, is trading well above its 12-month MA and is experiencing a positive KST. The only negative lies in the fact that the price experienced a false breakout above its previous all-time high. The good news is that this chart is based on month-end closes and it’s not the end of the month yet. Time to get back above that resistance?
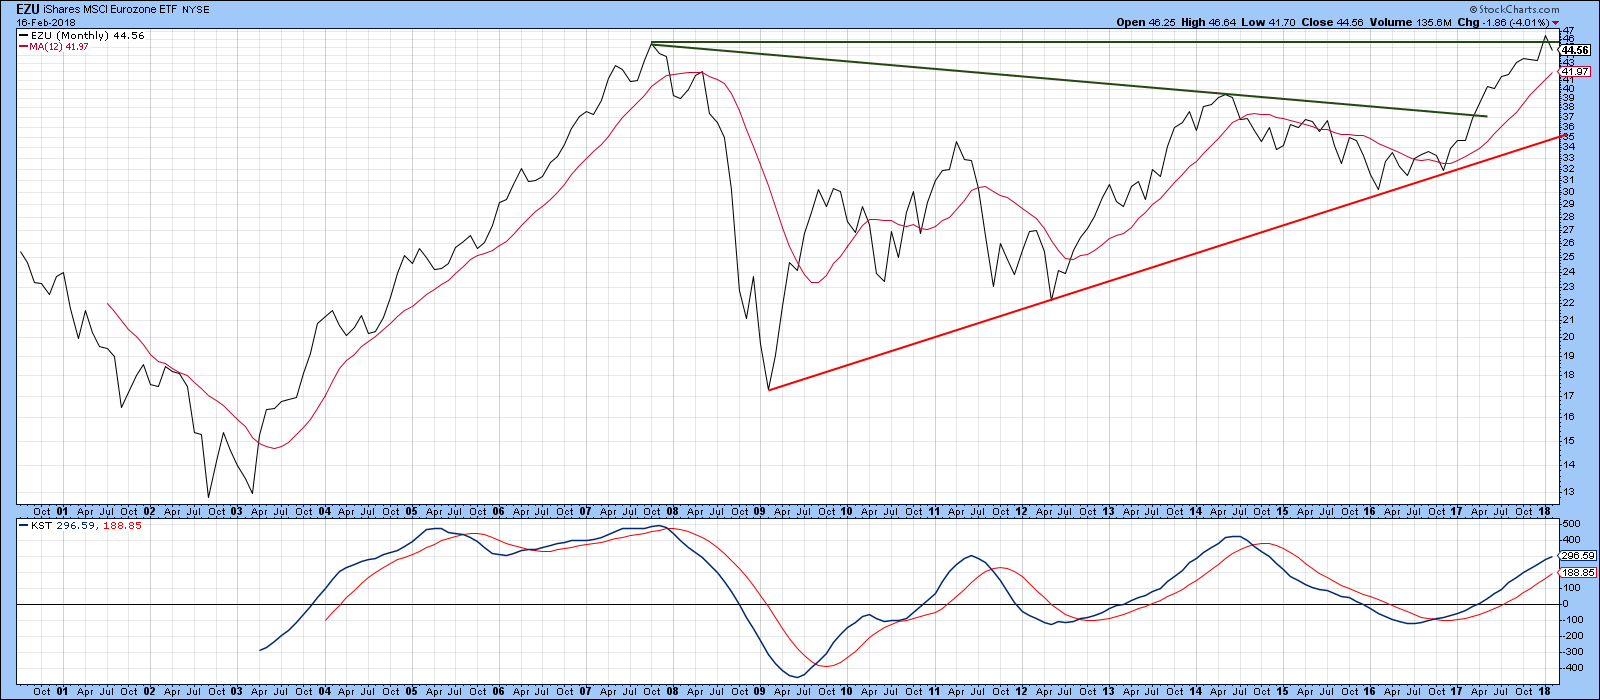
Chart 3
Chart 4 on the other hand, shows the European Stoxx 600 Index, where European equities are expressed in Euros. Here the picture is less encouraging, as the Index is below its 12-month MA and standing right at its bull market trend line. The three ellipses draw our attention to the fact that crossing the MA is a big deal, because there have only been three whipsaws in the last 25-years or so. Once again, we have to remember that this is a monthly chart and it’s not the end of February yet. Consequently, it’s still possible that the Index could rally above the secular resistance trend line joining the three previous highs as well as its 12-month MA. That, of course, would be a very bullish development indeed.
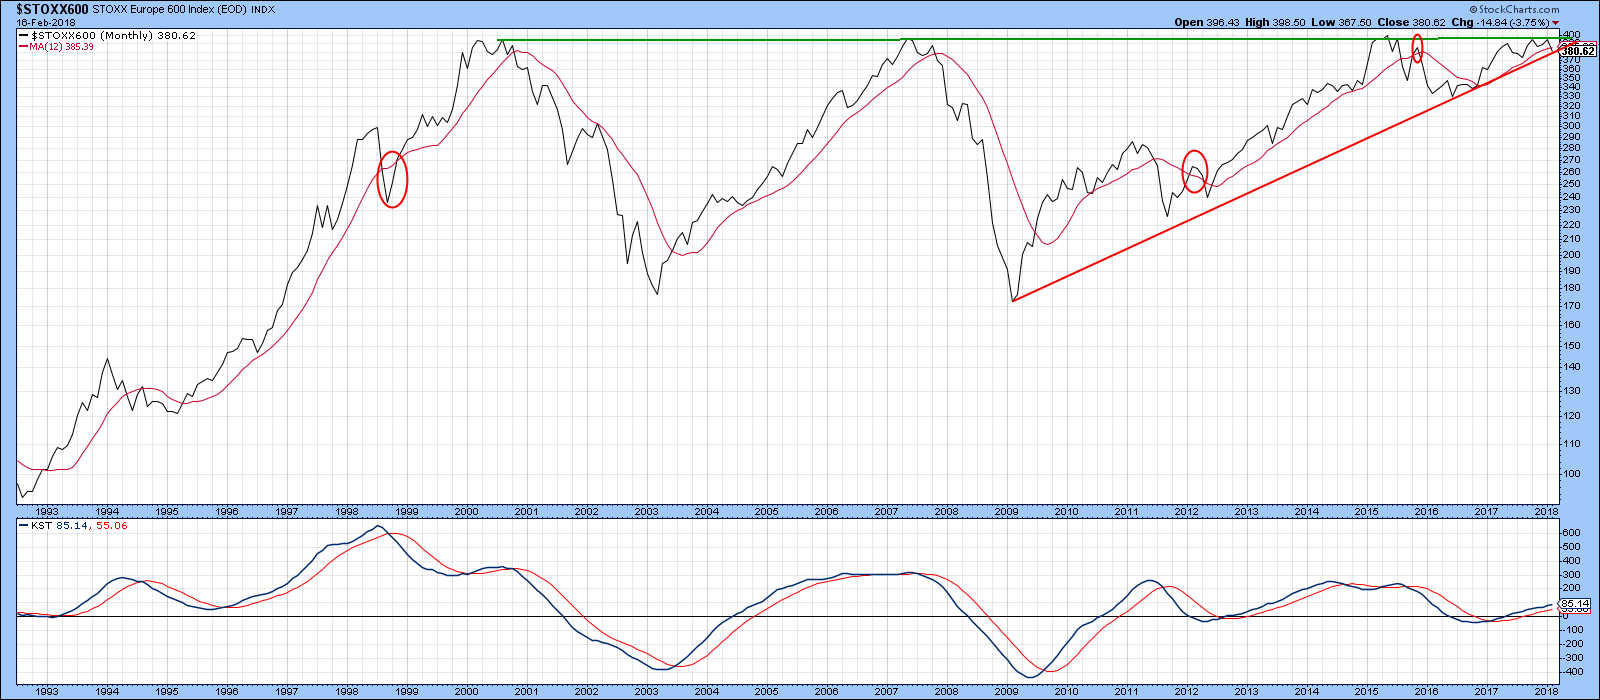
Chart 4
However, Chart 5 shows that the $STOXX600 Index is well below its declining 200-day MA, and may well be in the process of tracing out a 1-year top. That would require a drop below the horizontal red line, which has not yet happened. However, the Special K has violated an important up trend line and that’s the kind of action, which when confirmed by the price series it is monitoring, typically results in a major trend reversal. An example of a downside reversal has been flagged by the green lines.
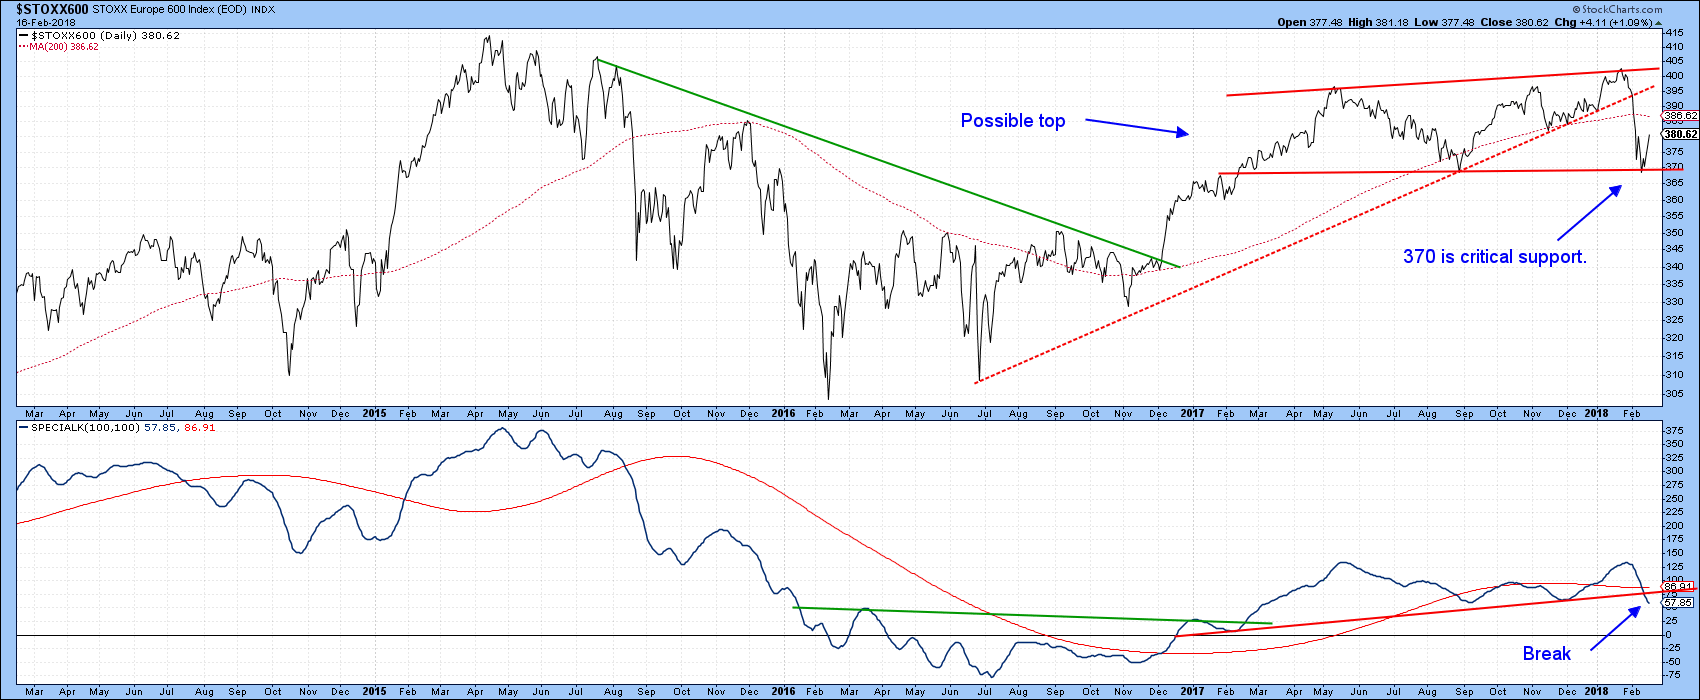
Chart 5
Perhaps most telling of all, is the fact that the Stoxx 600 has only been able to retrace 38% of its recent decline, compared to the 61.8% for the S&P. My point is if the US market does start to test its recent low price action, the Stoxx 600 has been so much worse, it is more likely to drop below that low, thereby completing the top outlined in Chart 5.
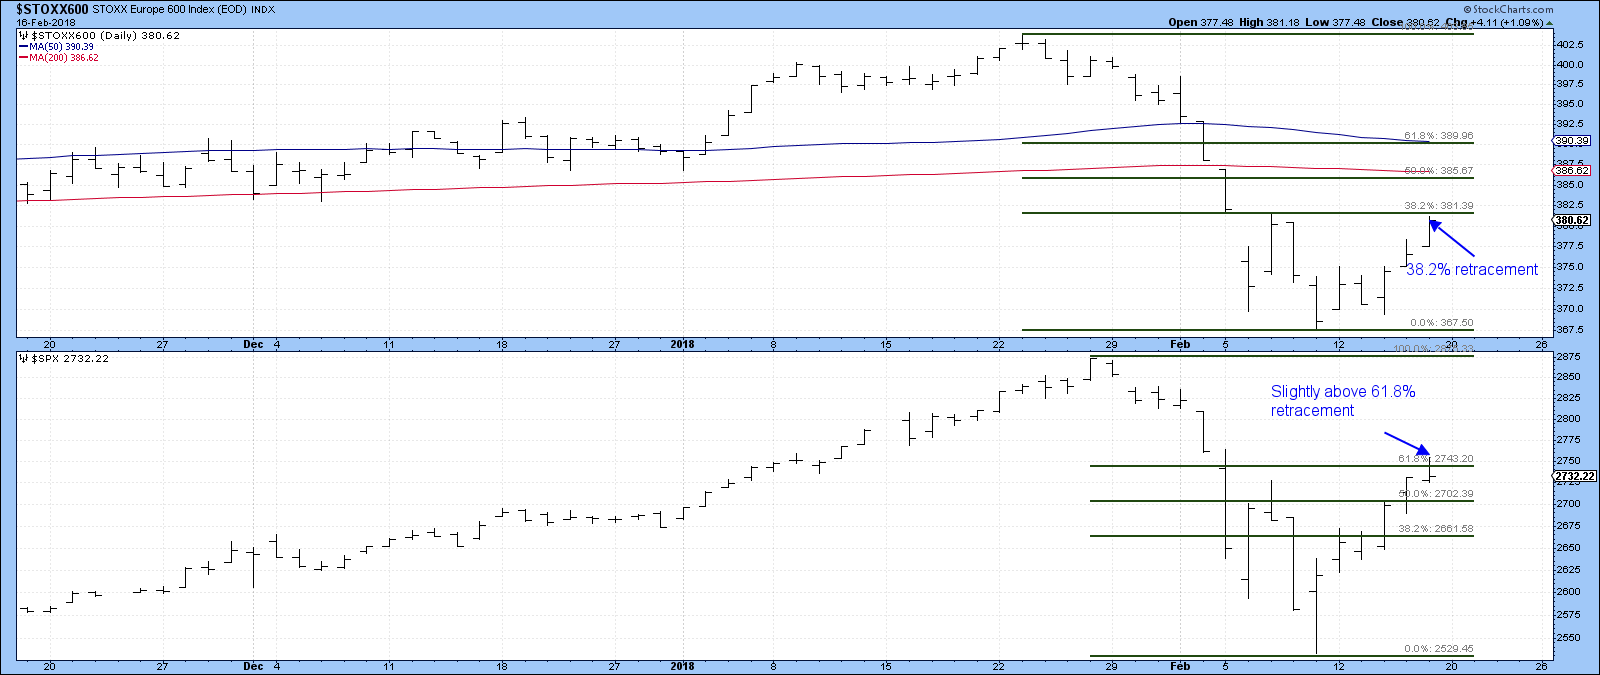
Chart 6
Shanghai starting to look sick
One exchange that’s already started to break down in a primary trend sense is the Shanghai Composite. It’s featured in Chart 7, where we can see that the Index is trading below its 12-month MA and red bull market trend line. One caveat, lies in the fact that this is a month-end chart and we are not yet at the end of February. However, because of the Chinese New Year, there are only five trading days left in February. The KST is positive, but barely so. That means that if the price closes at or near current levels there would be a good chance of a KST sell signal developing in March.
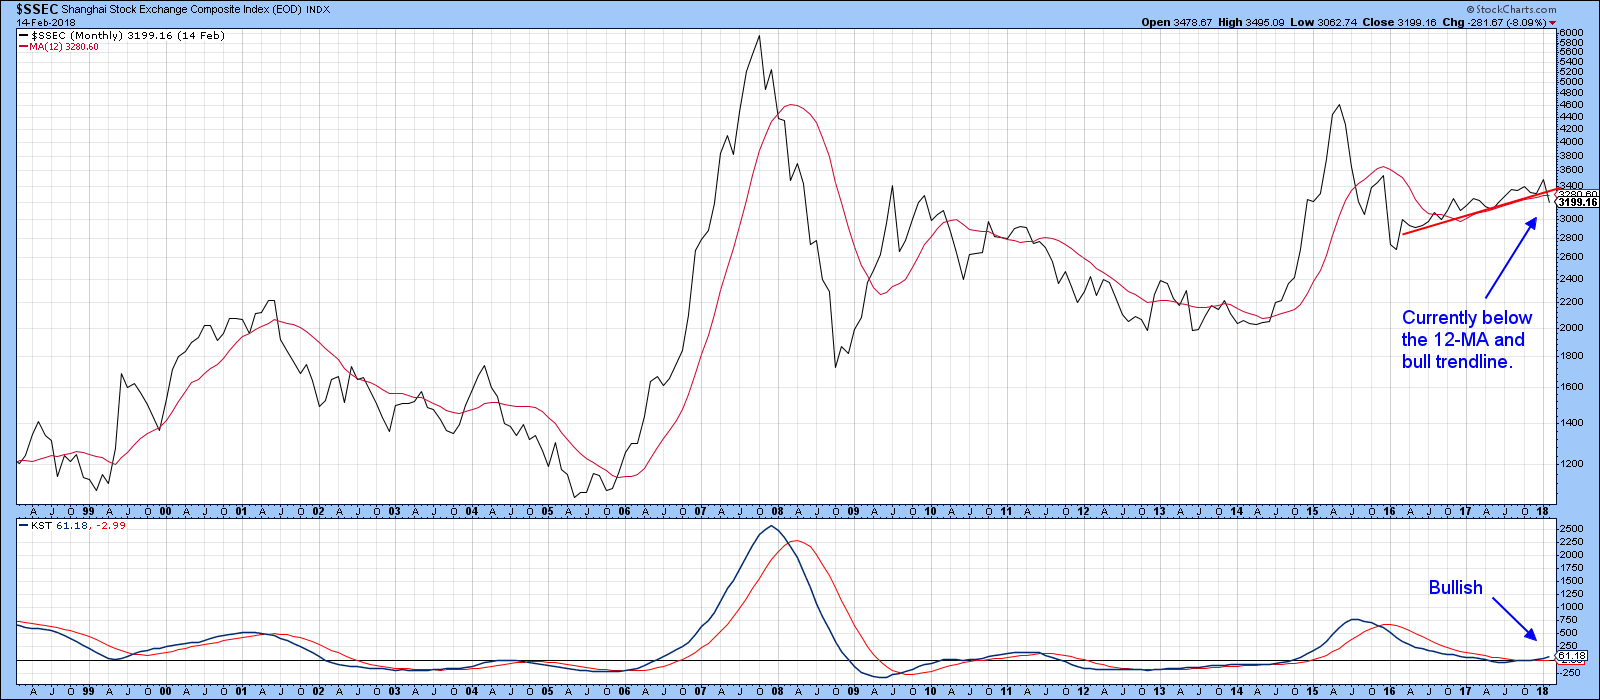
Chart 7
Chart 8 shows that the Shanghai Composite $SSEC has crossed below its 200-day MA. Far worse, is the fact that the price experienced a failed upside breakout earlier in the year, and that this has now been confirmed with a break below the 2016-18 red support trend line. Furthermore, the Special K has crossed below its signal line thereby presumably resuming its multi-year downtrend.
Unless a quick reversal to the upside develops in the next week or so, the long-term technical indicators will be pointing in the direction of a primary bear market, or at best, an extension of the 2016-18 trading range.
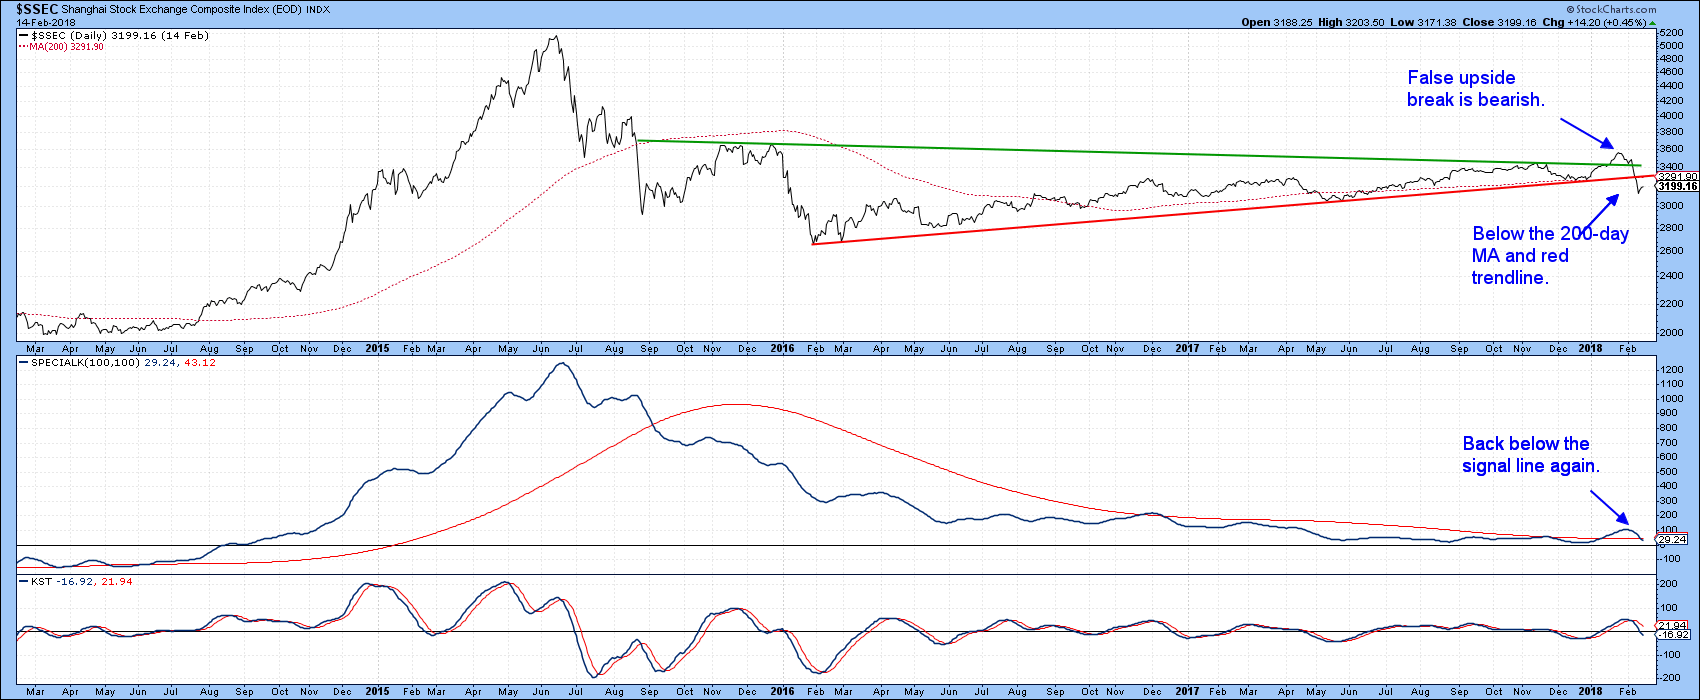
Chart 8
Good luck and good charting,
Martin J. Pring
The views expressed in this article are those of the author and do not necessarily reflect the position or opinion of Pring Turner Capital Group of Walnut Creek or its affiliates.


