Bitcoin Is A Mania But Is It Over?
- Longer-term perspective
- Short-term Charts
- Dollar trying to break to the upside
Longer-term perspective
At its December 18 peak of $18,723, the Bitcoin Index ($NYXBT) outstripped all other bull markets in recorded history. By this yardstick alone this phenomenon qualifies as a mania. So far, the post high, low water mark was registered on February 6 at $7,036. That’s an approximate 60% drop. If replicated in the stock market, we would be looking at a daily close in the Dow at 10,000 —just sayin! The big question is whether the mania is over or is there more to come? The short answer is that the top has probably been seen.
A few years ago, I did a study on parabolic type blow offs, using an 18-month ROC as my guide. This specific time frame is very useful. That’s because it approximates half the time span of the so-called 4-year business cycle, around which financial market prices tend to revolve. I observed, that whenever this indicator registered a reading in excess of the 180-200% level and reversed, this invariably confirmed that the parabolic type rise in question had reversed. Put another way, the bubble had burst. Using my own database of equity markets and commodity prices I noted thirty examples of this “180% rule”. The average period between the top of these respective bull markets and a new high being registered was 15-years. These examples ranged from as little as 4-years for silver in the 1970’s to as many as 34-years for coffee in 1977. Some of these peaks have never been bettered. Chart 1 offers three examples of the “180% rule” for silver.
Concluding that a reversal in the ROC has indeed taken place can be tricky. One way of increasing the odds, is to observe a negative crossover of the 12-month MA. These have been flagged in the Chart by the three small red arrows. The reason for featuring silver is that it holds the record with a January 1981 reading in excess of 500%. That means the price advanced five-fold over an 18-month period. I do not have monthly data for the South Sea Bubble of the Dutch Tulip Mania, but articles I have read, argue that Bitcoin has outstripped both of these manias.
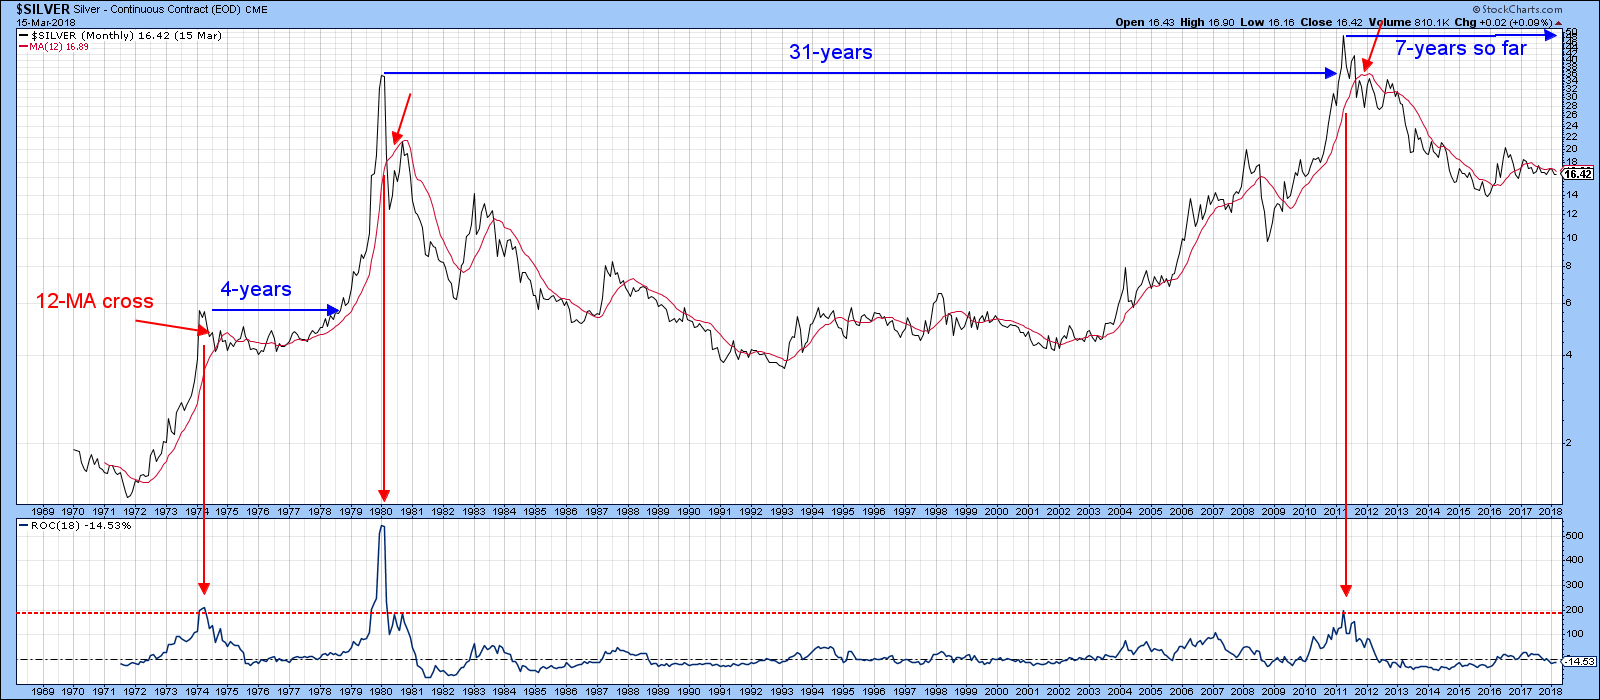
Chart 1
It has certainly outstripped silver in 1980. We can see that from the bottom window in Chart 2, where December registered a reading in excess of 2,000%. At this point the odds would seem to favor this momentum indicator as having peaked out, because it has violated its 2017 up trend line, and has initiated a series of declining peaks and troughs. The 9- and 12-month spans have also violated their respective up-trend lines. However, because of the rapid ascent, the price remains well above its 12-month MA, which is slightly below $3,600. Nevertheless, the overall impression gained from this long-term chart is that the odds favor Bitcoin having experienced a secular or very long-term peak.The shorter-term charts generally support this view.
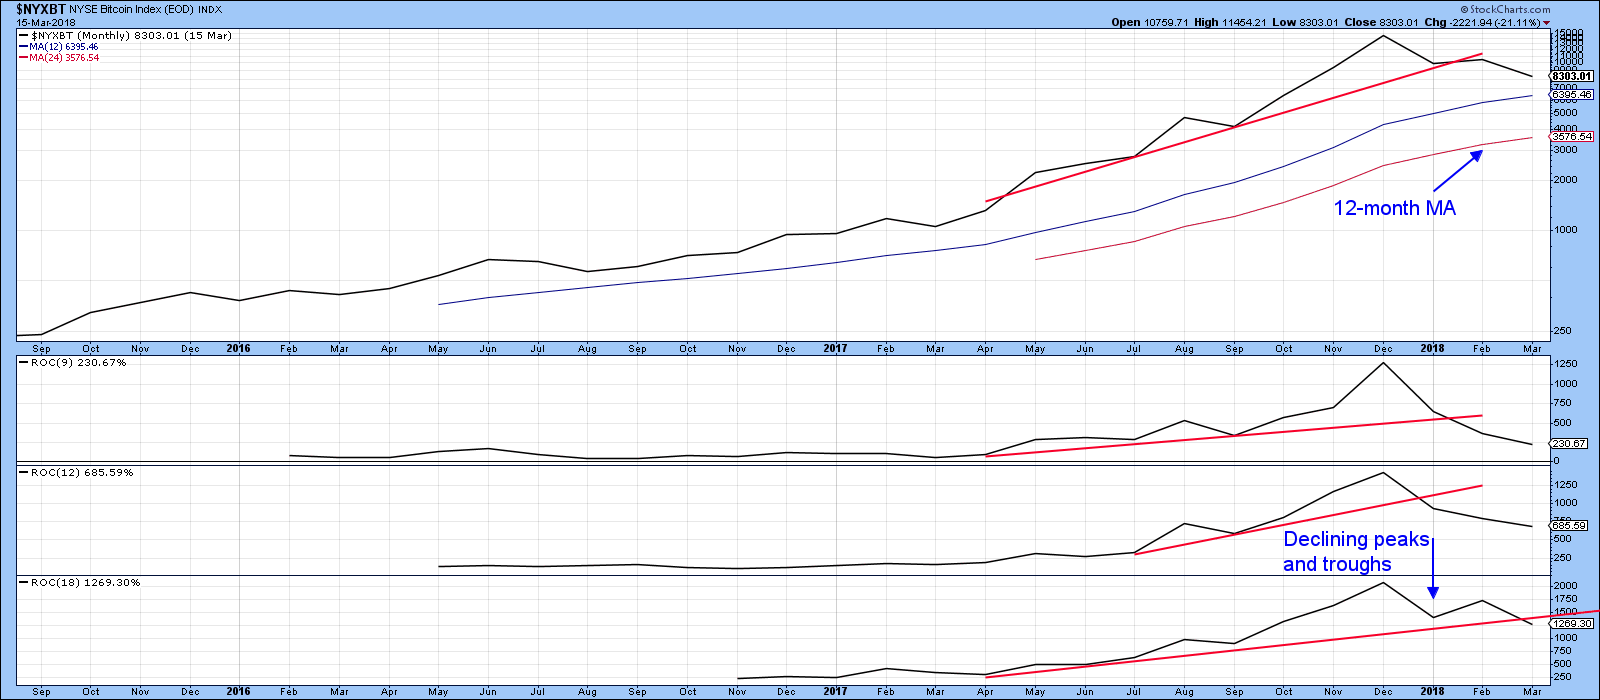
Chart 2
Short-term Charts
First, the price has violated its 2017-18 up trend line. Second, the KST appears to be very close to triggering a sell signal. The red arrows show that in the past, Bitcoin has been very responsive to such signals. The fact that the most recent KST rally has lasted for only about a month certainly suggests a loss of upside momentum. That is a characteristic of a bear market, or at best an extended trading range. A good example of KST behavior in a trading range is provided by the two brown dashed arrows in 2016.
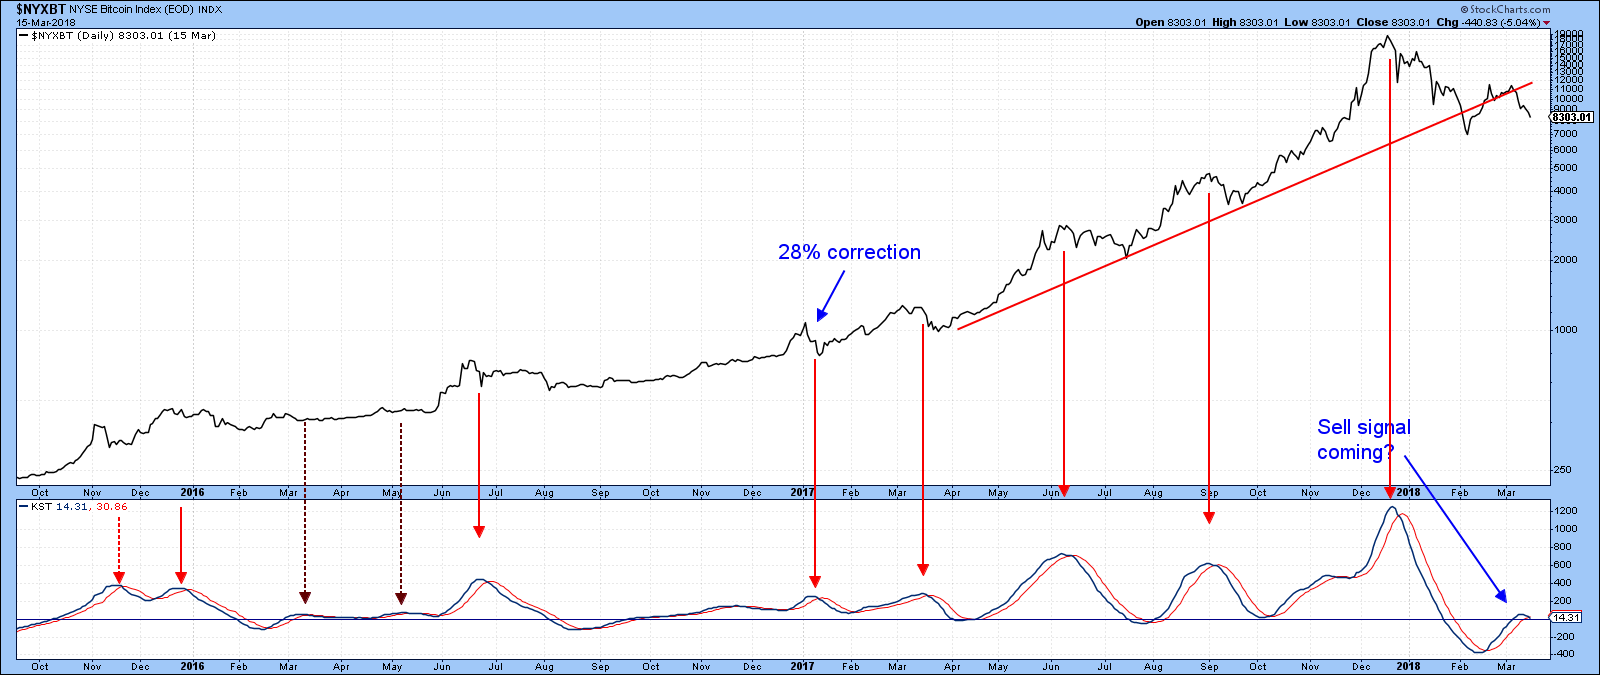
Chart 3
Further negative evidence comes from Chart 4, which features the Bitcoin Trust (GBTC)-(data line turned off), or rather its momentum, in the lower window. In this instance the KST has already triggered a decisive sell signal, suggesting that both the Trust and the Index are both headed lower.
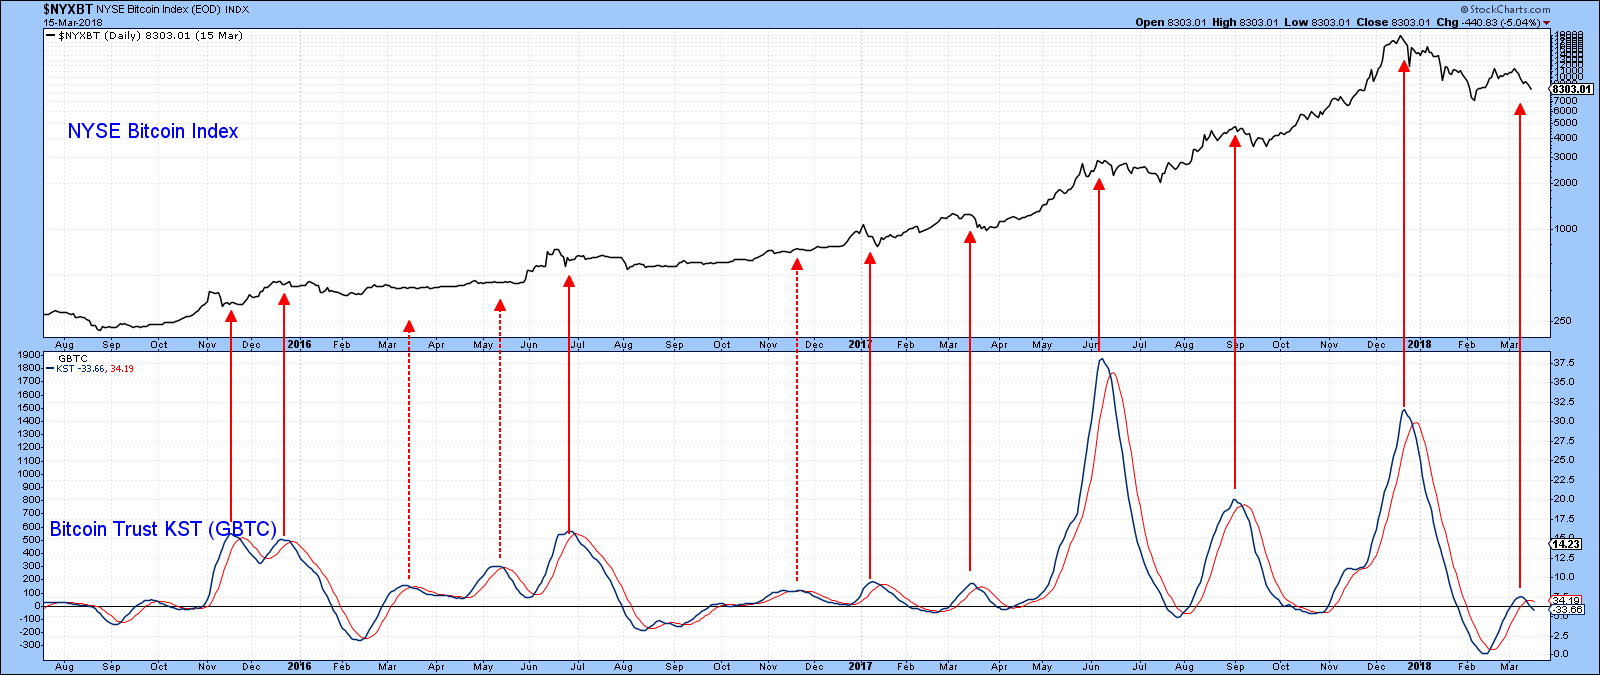
Chart 4
We do not have volume figures for Bitcoin on the StockCharts database, but we do have it for the exchange listed GBTC in Chart 5, where it is expressed in PVO format. The red arrows show that most previous peaks have been characterized with buying climaxes. Currently, the PVO is in a declining trend, as flagged by the green trend line. However, the indicator looks to be close to an upside breakout. That would be bullish for volume. It would also be positive for prices if the GBTC could break above the dashed green 2017-18 down trend line in Chart 6. Alternatively, should volume expand and the GBTC drop below the 2017-18 red up trend line (Chart 5) that would be a very negative development. Not only would that result in the completion of an upward sloping head and shoulders top, but it would also involve the crossover of the 200-day MA for the first time in the history of the chart.
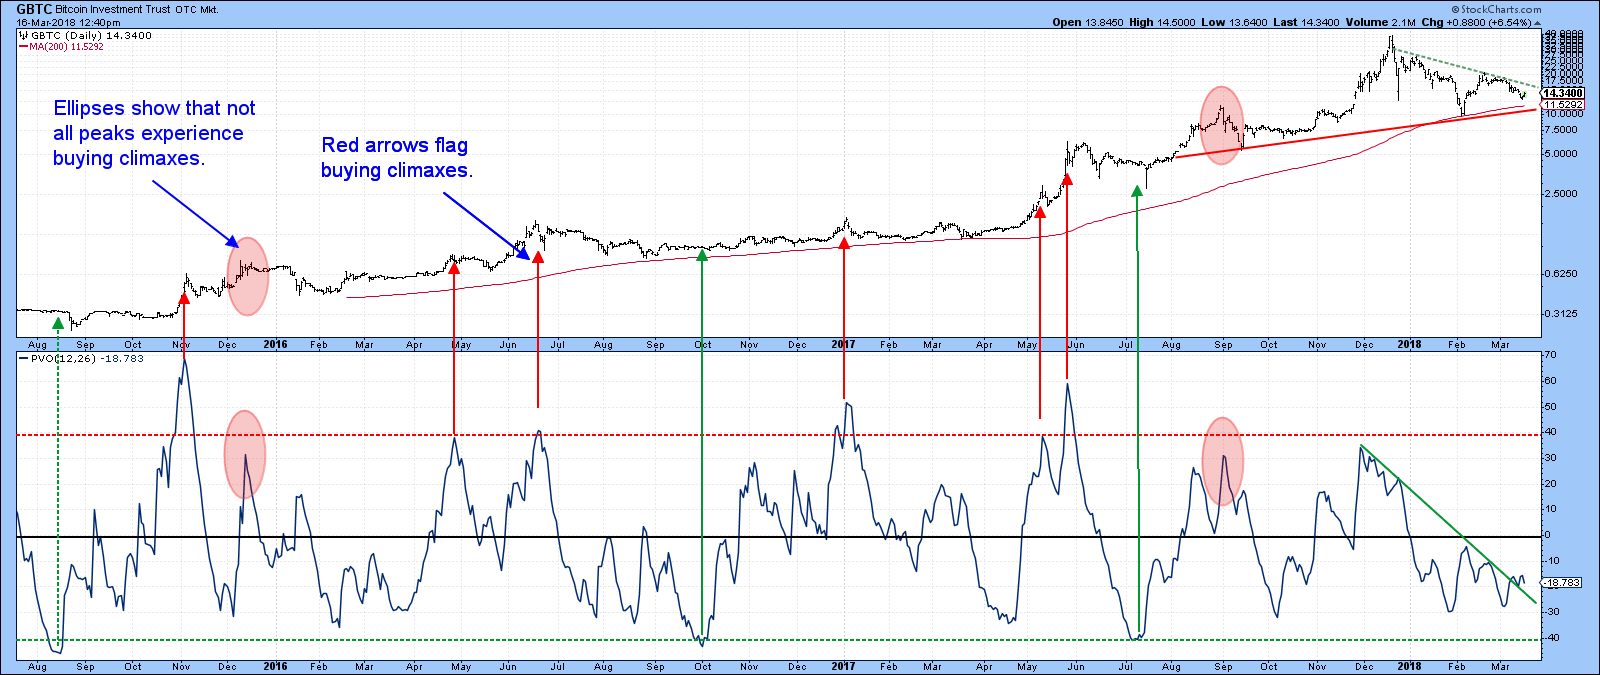
Chart 5
So far, we have not seen a reversal in the rising peak/trough progression, but Chart 6 shows that such a signal, in one direction or the other, may not be far off. Since the December peak there has been one move down and another one up, which failed to take out the December high. If the price now rallies back above the upper blue dashed line that will indicate the trend of rising peaks and troughs is intact. However, a break below that early February low will signal declining peaks and troughs and will move in sympathy with the negative vibes coming from the 18-month ROC.
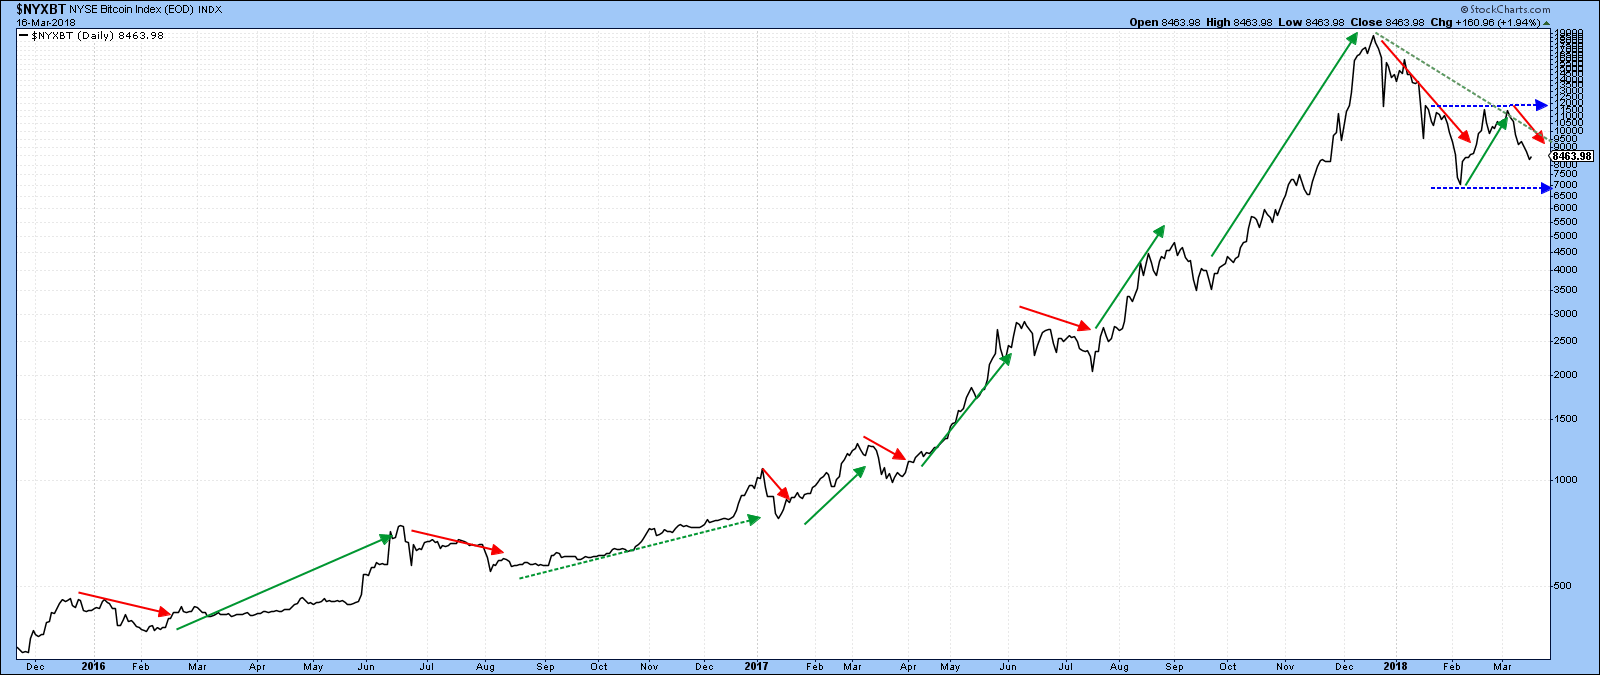
Chart 6
Dollar trying to break to the upside
Chart 7 shows that the big test for the US Dollar Index lies just above 91, where the red and green trend lines are converging. A move above that level will confirm that the early January break was a whipsaw. Note that the dollar diffusion indicator, which monitors a universe of cross rates in a positive trend, is bullish and still oversold. That does not guarantee a breakout, but it does suggest that if one is going to take place, now would be as good a time for expecting it as any.
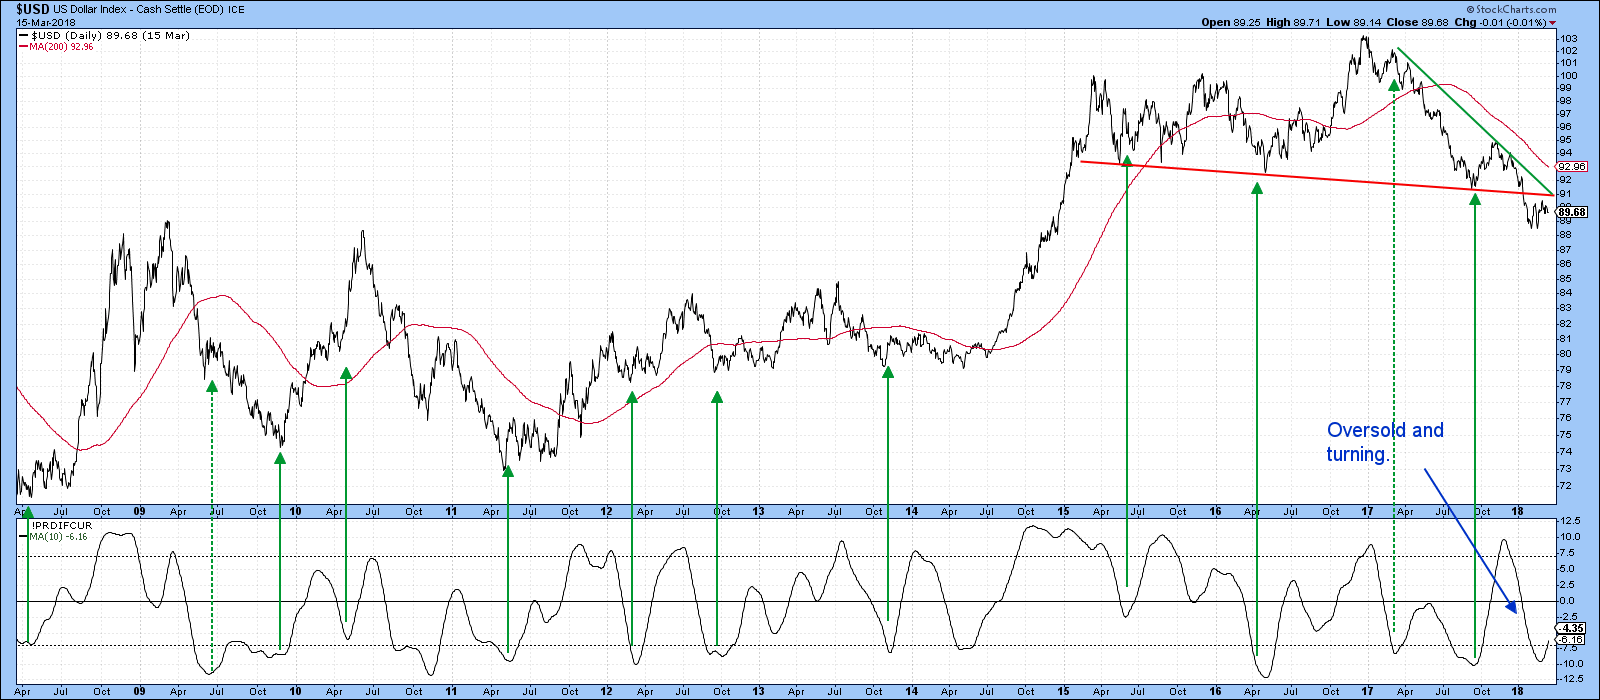
Chart 7
Chart 8 features the Bullish Dollar ETF, the UUP. Friday’s action shows that a breakout attempt is already underway. We will have to await the close of course, but the re-acceleration to the upside by the KST is definitely a plus.
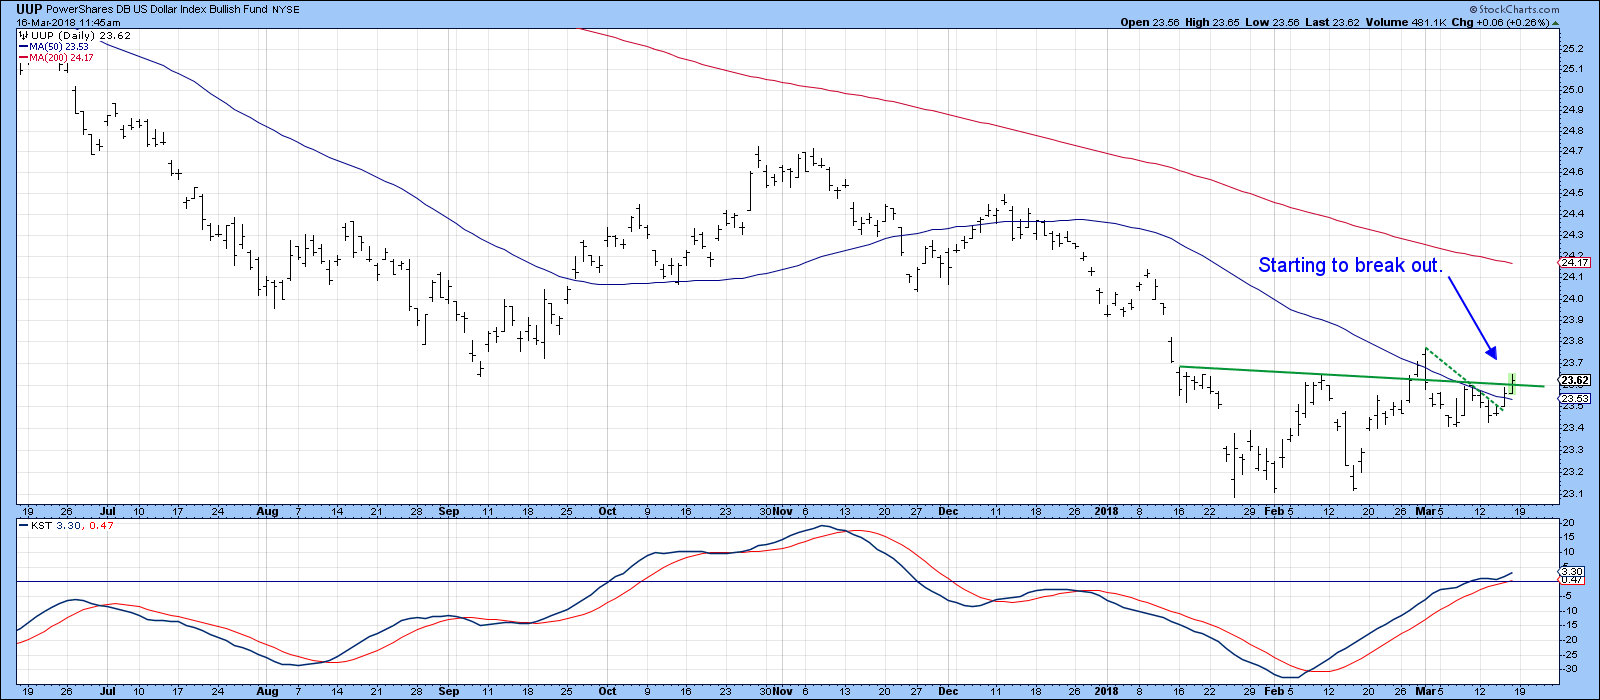
Chart 8
Good luck and good charting,
Martin J. Pring
The views expressed in this article are those of the author and do not necessarily reflect the position or opinion of Pring Turner Capital Group of Walnut Creek or its affiliates.


