They Just Built A New Wall Of Worry For The US Stock Market
- Two bullish piercing white lines
- A sector spread that predicts new stock market highs
- Two sectors affected by the proposed tariffs
Last week I wrote that the indicators seemed to be calling for a test of the early February low. My expectation was for a sharper and more prolonged decline than the two-day special that followed my article. However, I’ll take it for a couple of reasons. First, a lot of other commentators are looking for that test, and that makes me nervous, as markets rarely accommodate the majority. Second, as you can see from Chart 1, the NASDAQ Composite completed a bullish piercing white line on Friday. These patterns are only expected to have an effect for a few sessions, but that should be enough to ward off further near-term price erosion. Finally, the market has again been resilient to bad news. With stories about the 1930 Smoot Hawley tariff having caused the Great Depression etc. and universal negative media coverage, one would have thought prices would be well on their way to breaking the early February intraday low. But quite the contrary, with the fear of retaliation in the wind, the market now has a perfect wall of worry against which it can climb higher.
Two bullish piercing white lines
These patterns develop after a decline, when the second candle in the formation opens with a gap below the low of the previous session. The price then closes more than half way up the previous black candle’s real body. The piercing white line in Chart 1, did not develop after a particularly large decline. This is a factor that limits its appeal as a reversal pattern. Moreover, it is not replicated, as far as I can see, in any of the other major indexes, except the Wilshire 5000, which we will get to later.
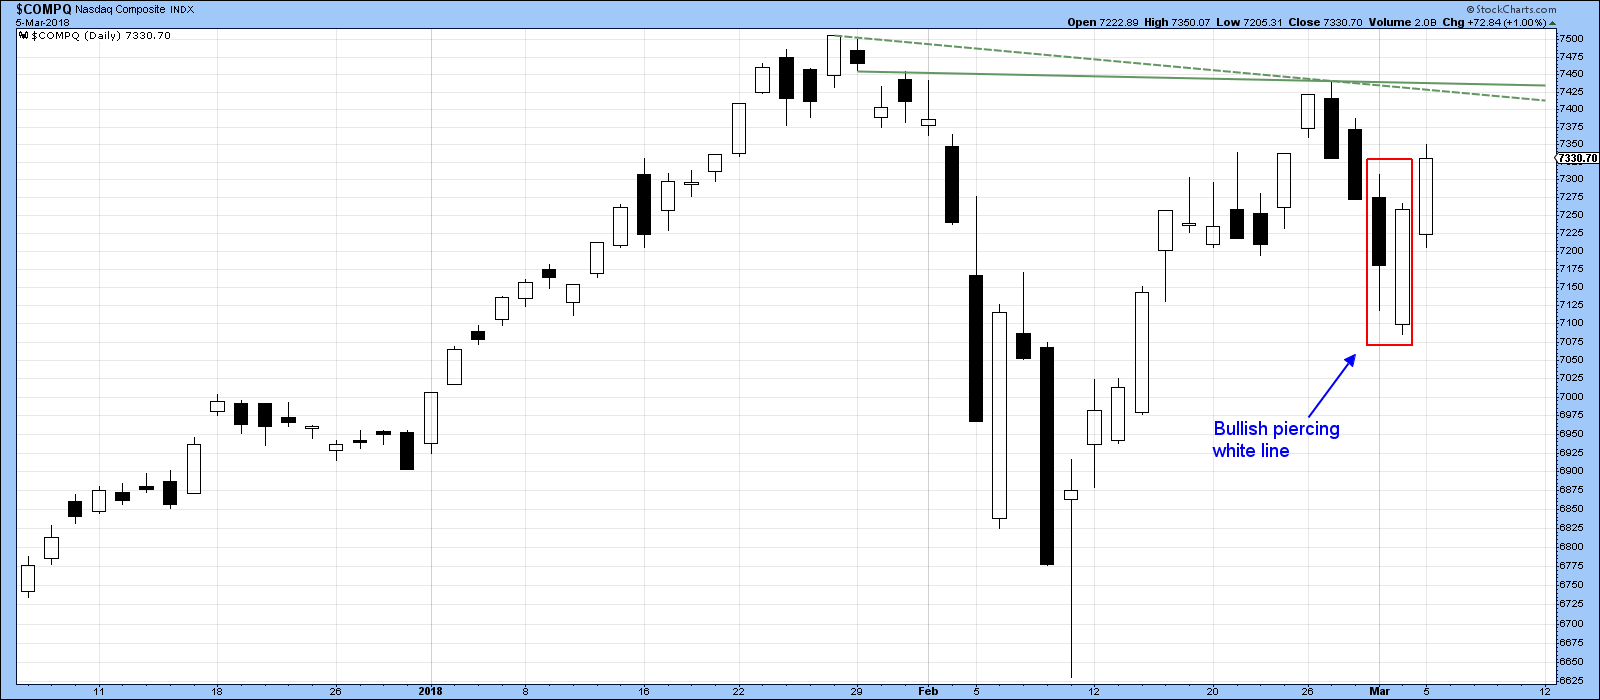
Chart 1
Chart 2, shows that the tech laden NASDAQ is clearly a market leader as its RS line, in the third window, is at a new high.
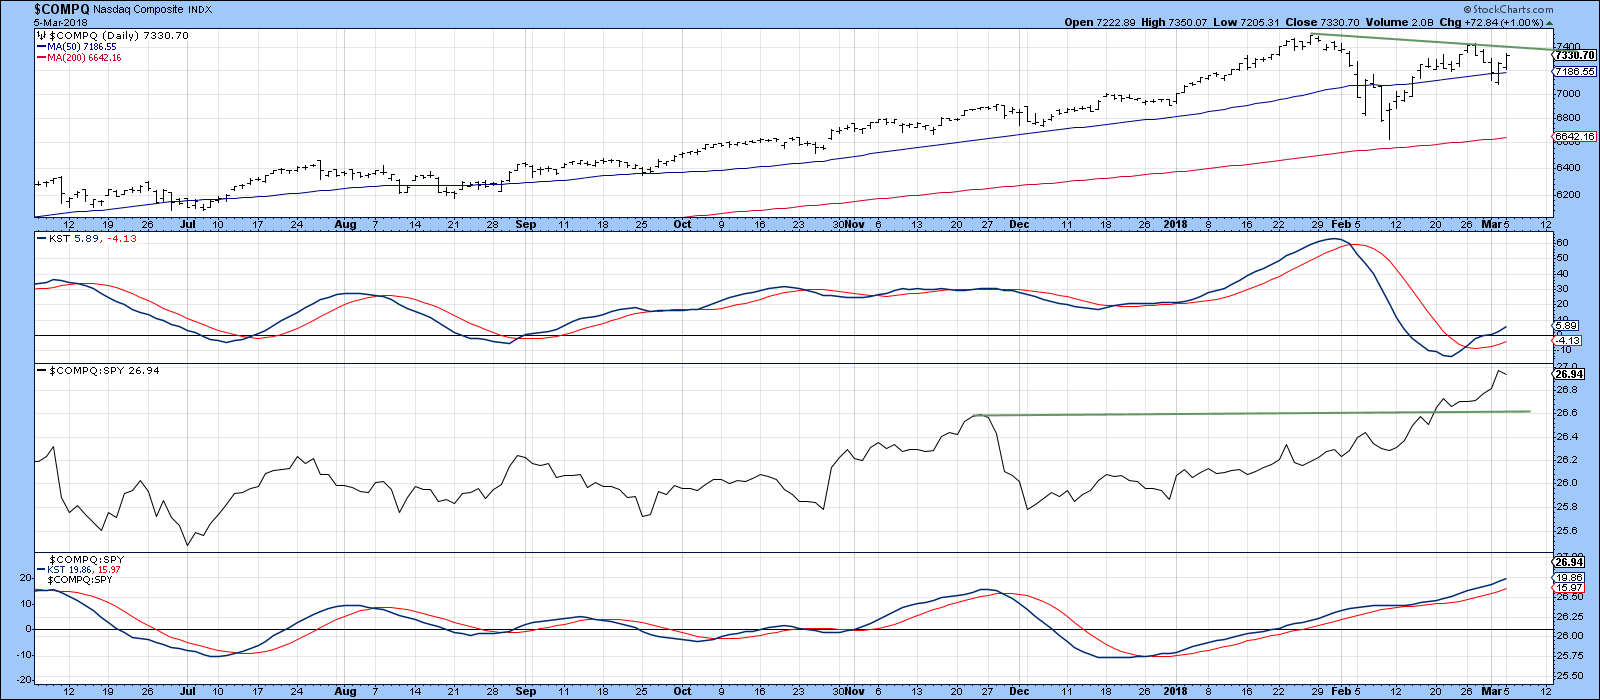
Chart 2
One close piercing white line call came from the Wilshire 5,000, which basically represents the total US Cap. The opening price on March 3, as shown in Chart 3, was technically below that of March 1, but barely so. However, it did reflect a change in market sentiment by closing more than half way up that March 1 real body. Now all we need is a confirmation with a break above the dashed down trend line at 28600 or the previous high at 2880.
What will happen from here is anyone’s guess. However, it seems likely that any further corrective action is likely to take the form of a 2-6-week trading range, rather than a serious new decline. If the market wanted to go down it was given a perfect opportunity to do so and blinked!
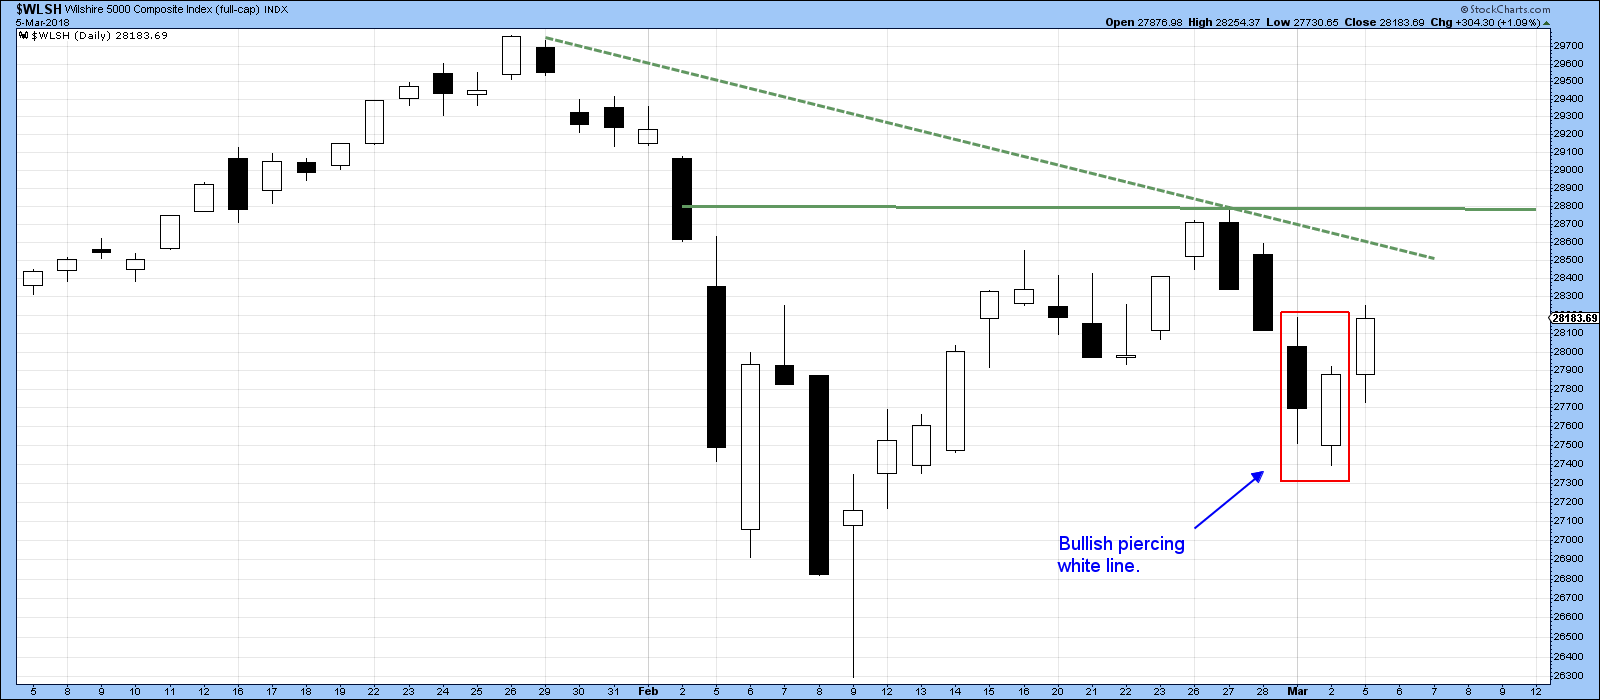
Chart 3
A sector spread that predicts new stock market highs
One of my favorite stock market spreads is one that reflects changes in confidence amongst investors and traders, as expressed by the ratio between the relatively speculative technology ETF, the XLK and that of the defensive consumer staples (XLP). It’s featured in Chart 4, where a rising ratio means investors are growing in confidence, because they favor technology stocks over staples.
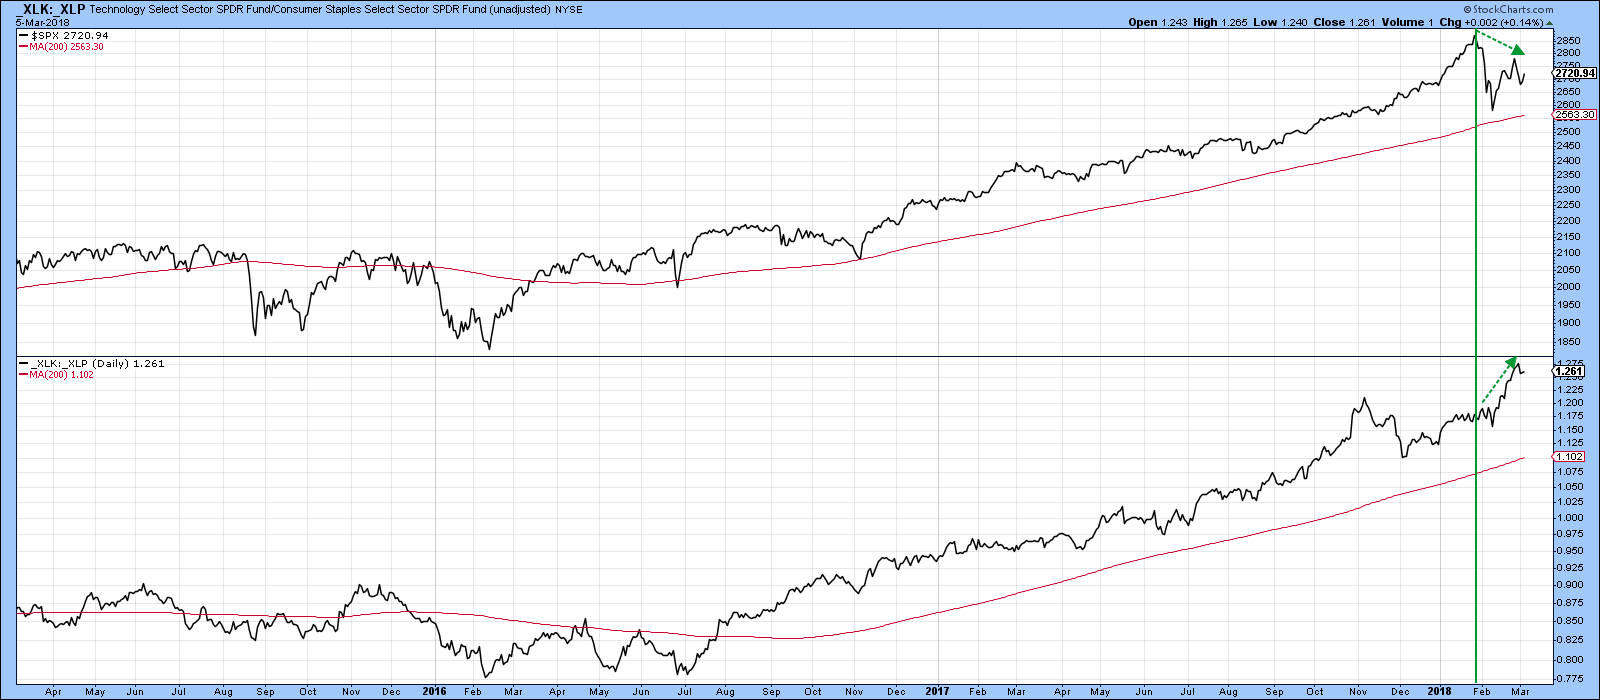
Chart 4
Recently, the S&P tested its late January high, but fell short. However, a burst of confidence, as reflected by the Tech/staple relationship pushed the ratio to a new bull market high. If the late S&P February low is to be taken out, I this relationship should have declined not rallied. For those interested, I’ll be examining this and other intermarket and inter-asset relationships on Wednesday’s MarketWatchers Live with Tom and Erin.
Two sectors affected by the proposed tariffs
The most obvious beneficiary of President Trump’s new proposed tariff is steel. In this respect, Chart 5 shows that the Van Eck Vectors Steel ETF, the SLX, has recently broken out from a huge 2011-18 base. It’s also comfortably above its 65-week EMA. Relative action is also positive, as is relative momentum, which recently re-accelerated to the upside.
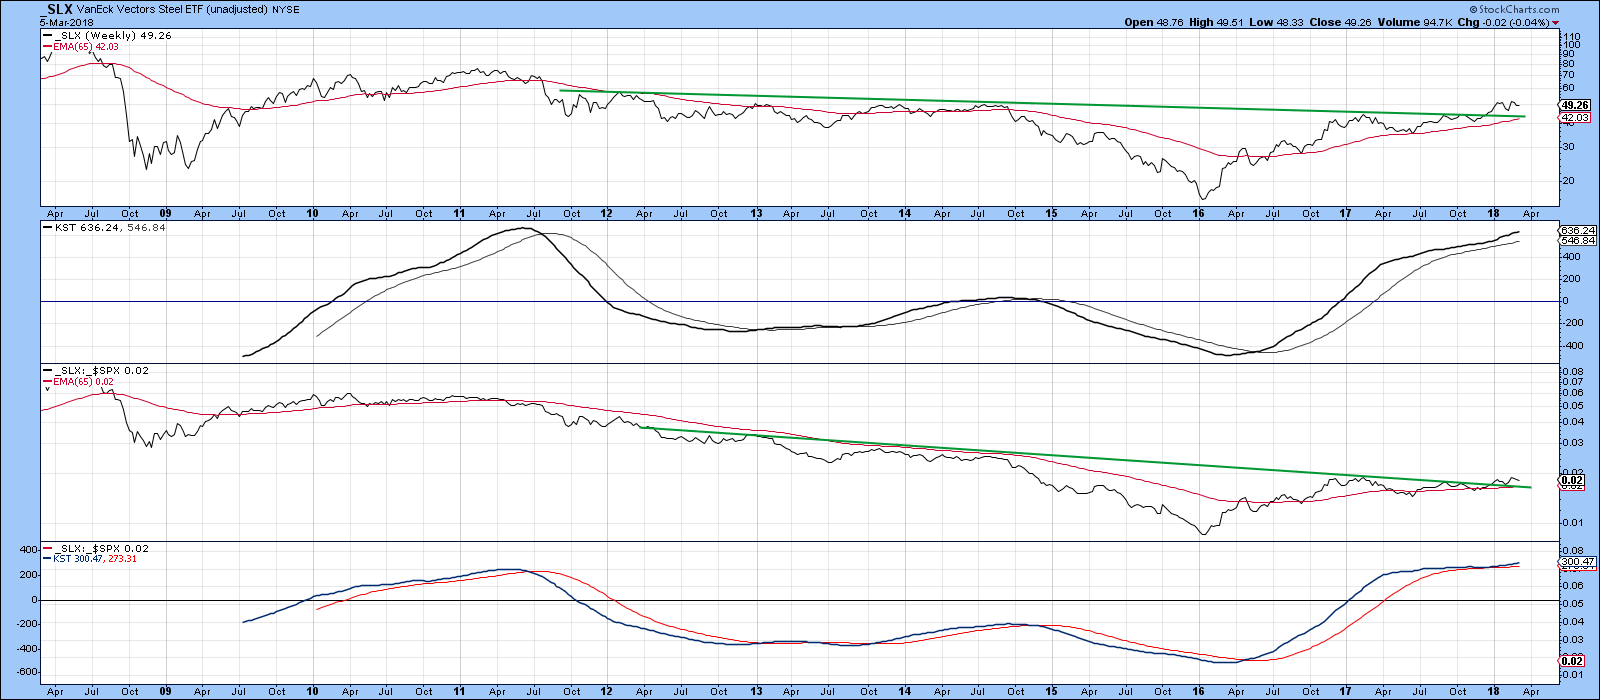
Chart 5
The short-term picture (Chart 6) shows that the price experienced a false breakout to new highs prior to the announcement. Since then it has edged down slightly and its RS line is now right at its December-March up trendline, and the short-term RS KST rolling over. This is not the kind of reaction we like to see from “good news”, and suggests that the longer-term picture in Chart 5, may not be as strong as it looks on the surface.
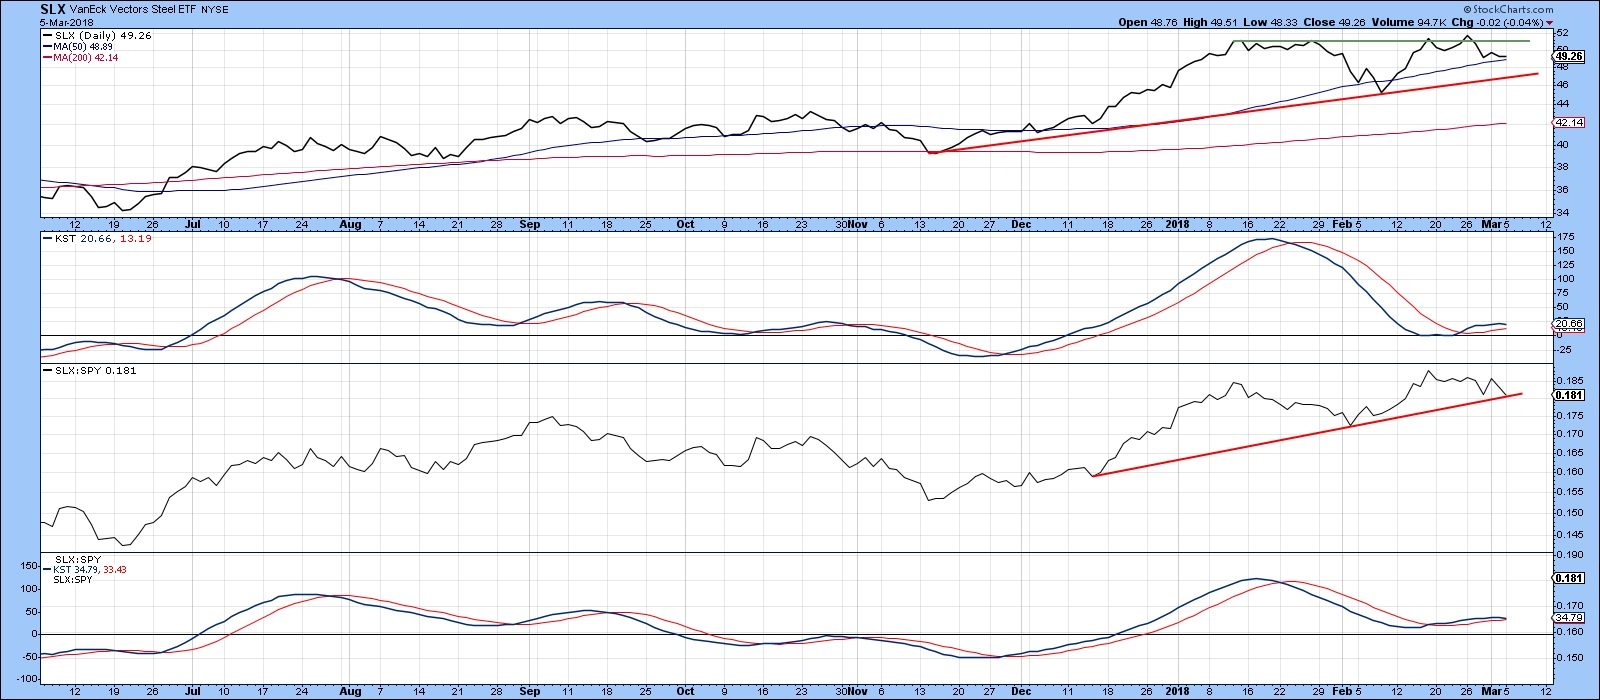
Chart 6
Housing is a sector that is supposed to be adversely affected by rising steel and aluminum prices, but Chart 7 shows that it had already been badly hit prior to last Friday’s news. We can see this from the fact that the price of the Spider Housing ETF, the XHB had already violated its 2016-18 up trendline, and with it, the early February Friday closing low. More to the point, the RS line dropped even more severely below its equivalent up trend line. Most egregious of all, the RS line peaked way back in 2015, and has been trending down ever since, even as the price itself touched a new high in January. That’s quite a serious and negative long-term divergence. Housing, because of its interest sensitivity, tends to be an early bird indicator for the stock market as a whole, so that’s something we will have to watch moving forward.
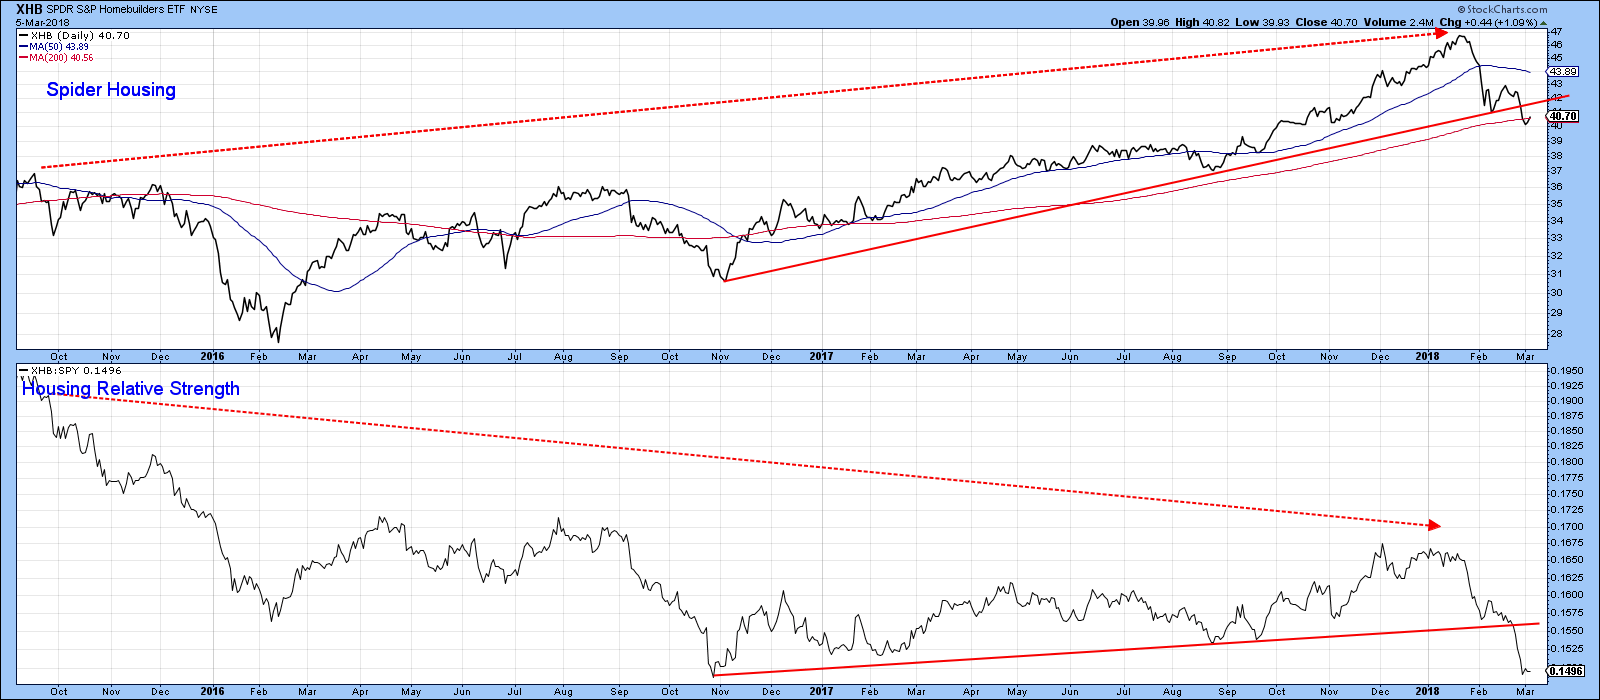
Chart 7
Broadening the housing analysis, we turn to Chart 8, which features the PowerShares Dynamic Building and Construction Portfolio, the PKB. The price of this ETF has already moved below its early February Friday closing low and now stands right at its 2011-18 bull market trendline. We are now waiting to see whether the line holds or not. Regardless though, the building and construction stocks included in its portfolio are likely to under-perform. That probability is demonstrated by the fact that the RS line has violated its 2011-18 bull market trendline and the KST for relative action has started to decline again.
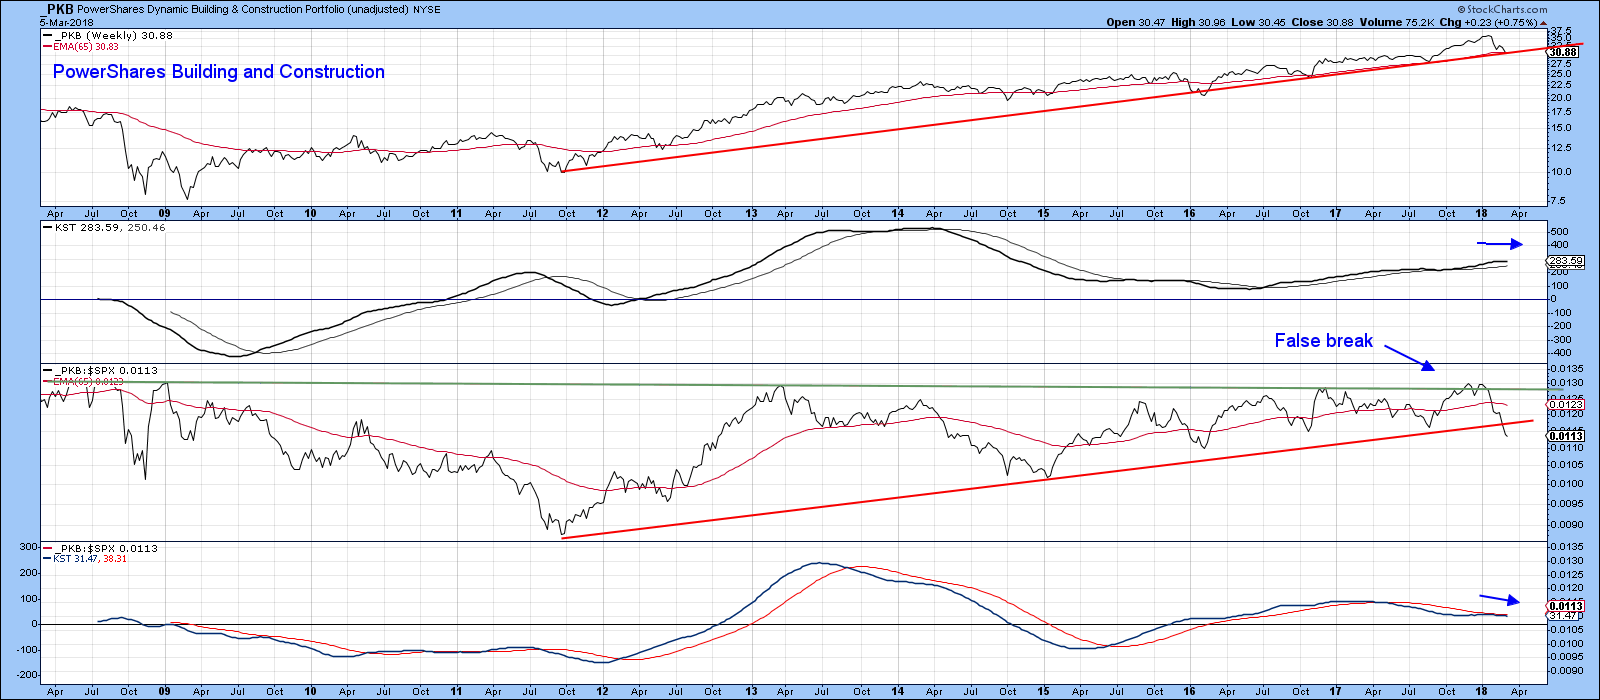
Chart 8
Good luck and good charting,
Martin J. Pring
The views expressed in this article are those of the author and do not necessarily reflect the position or opinion of Pring Turner Capital Group of Walnut Creek or its affiliates.


