Where's That Test Of The December Low?
- Long-Term Trend Still Points South
- It Would be Unusual Not to Experience a Test of the December Low
- Dollar ETF Breaking Out?
Last week, I pointed out that the major averages were running into resistance at a moment when they were moderately overbought. At the time, some form of a test of the Christmas low appeared to be a good possibility. However, the market thumbed its nose at my suggestion and, as you can see from Chart 3, barreled straight through that resistance.
Long-Term Trend Still Points South
None of this changes the bearish long-term picture illustrated by, for example, Chart 1. That’s because the S&P remains well below its 12-month MA and is experiencing a long-term KST, which is also still moving in a negative direction. When both series are simultaneously bearish, this usually results in a prolonged decline. However, the green arrows flagging the 1998, 2010 and 2012 whipsaws put us on notice that gauging the direction of the primary trend can be a tricky business. When we also consider the fact that the last December’s low and subsequent rally offered some extremely positive technical characteristics, bearish complacency is not appropriate. My working hypothesis is that the December bottom will remain in force for some time, but this is likely to be followed by ranging action, as opposed to significant new highs and ultimately lower prices. If the facts change, I’ll change too. However, since the S&P is still below its 12-month MA, it is better to assume that a primary bear is in force until the situation is reversed. That’s not the only thing we should be looking for, but it certainly would make the bearish case less credible. Just look at the two previous bear markets in 2000-2002 and 2007-2009. The 12-month MA certainly proved to be a solid insurance policy then.
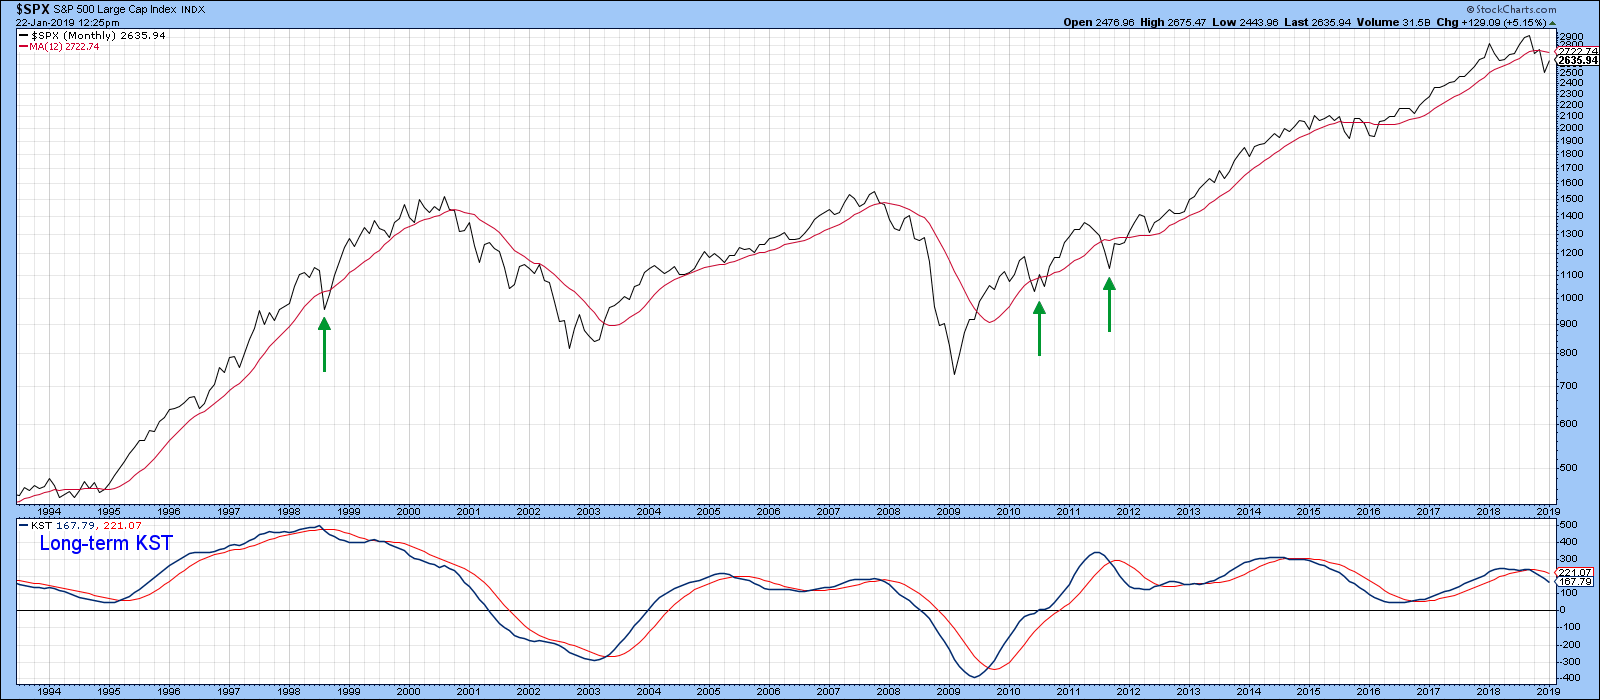
Chart 1
We can also see the same thing with the Dow Jones World Stock Index in Chart 2. In its case, though, the bear market is more advanced, indicated by a KST that is closer to zero and a series of declining peaks and troughs (as flagged by the small red arrows).
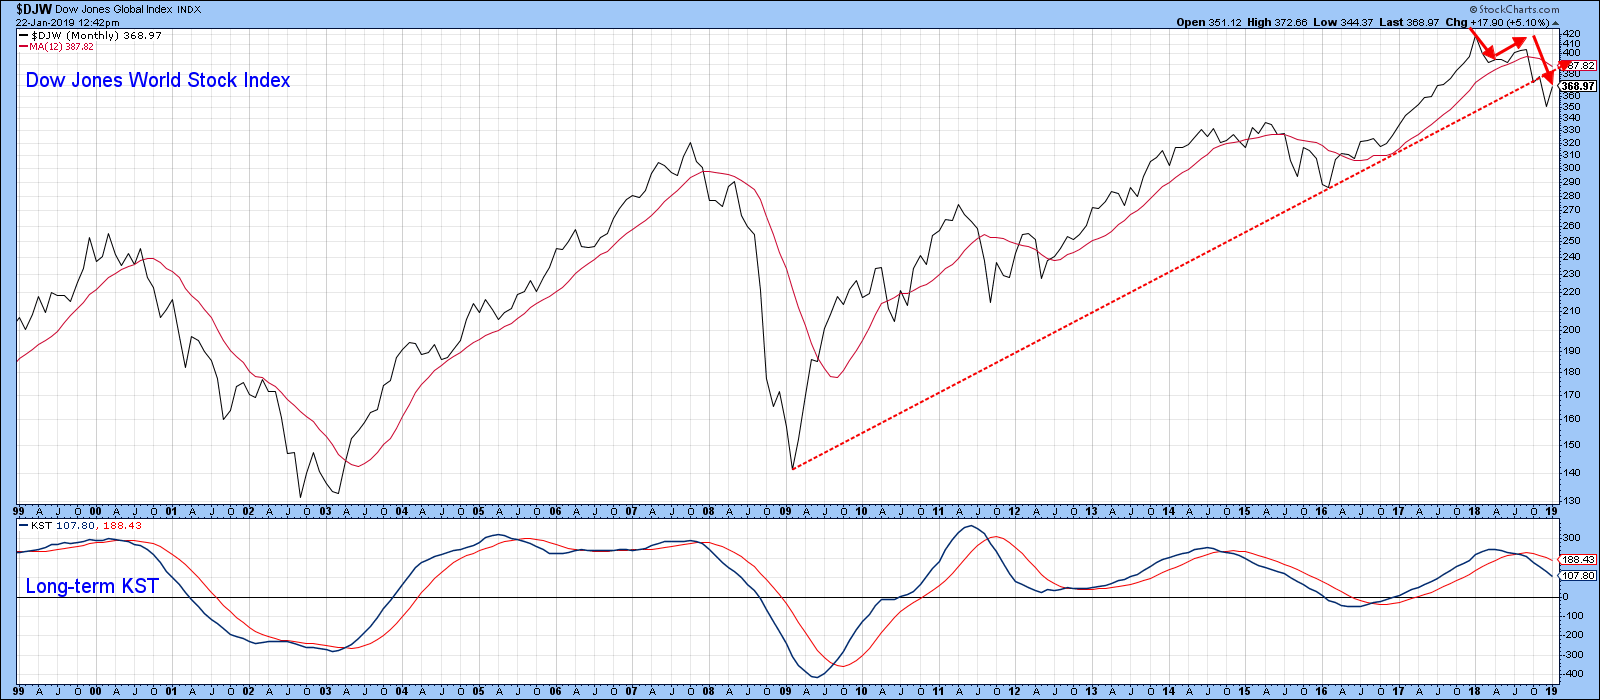
Chart 2
It Would be Unusual Not to Experience a Test of the December Low
Chart 3 features the DJIA together with two measurements of volume. The Index managed to rally back to its 200-day line but has, so far, been unable to push through it. Volume has continued to shrink, as evidenced by the new low just recorded by the PVO. However, it seems unlikely that it will continue to drop for much longer, meaning that volume is likely to expand. As you can see from the red and green arrows, rising activity tells us nothing about price, as it can move in either direction. If it expands on the upside, that would help to push the DJIA through its 200-day MA. On the other hand, if the expanded activity is accompanied by lower prices, that will signal that any decline would be motivated by urgent sellers, as opposed to prices falling because of a lack of bids. One thing that stands out is the fact that, in virtually every situation, an initial bottom (B1) is followed by a test (B2). We have not yet seen that B2 test.
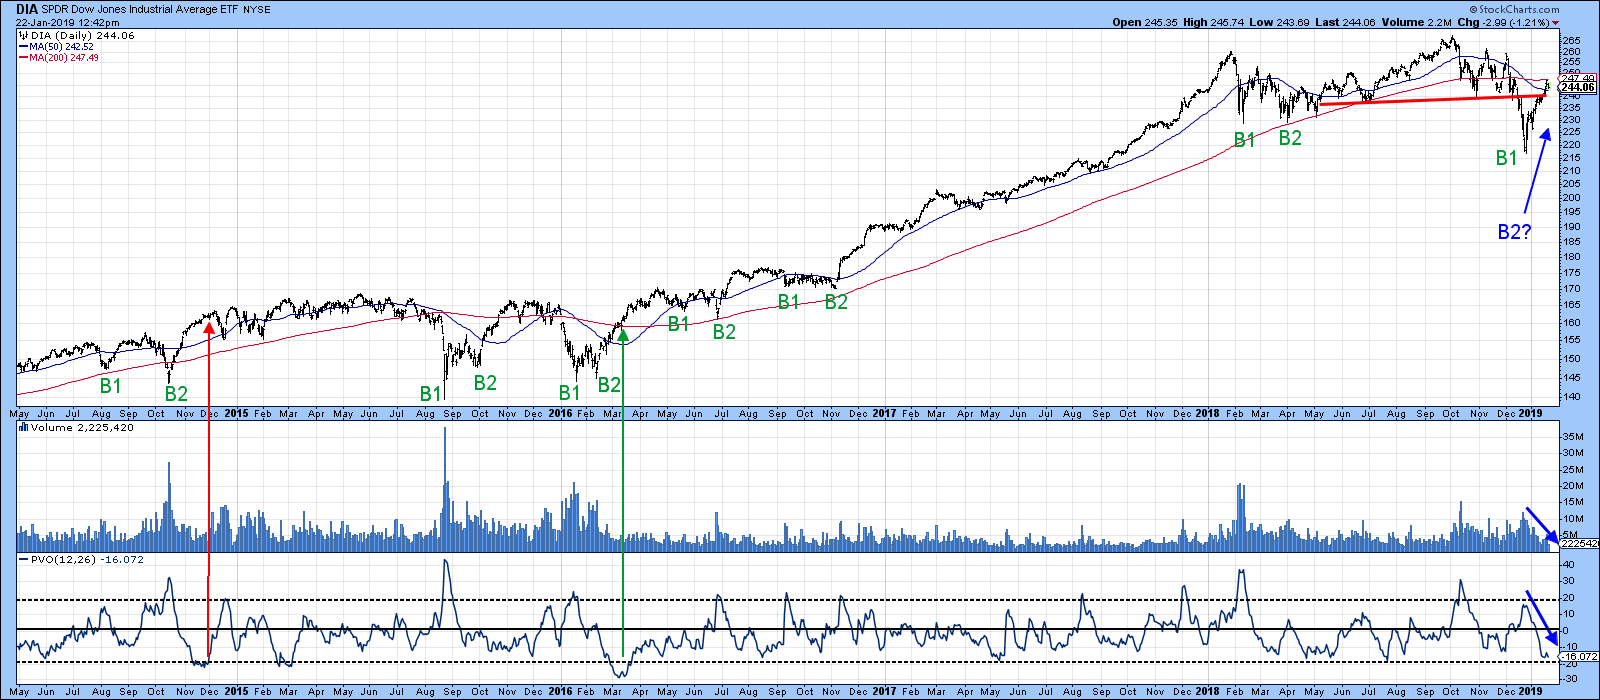
Chart 3
Last week I pointed out that the 9-day RSI for the S&P tended to trade in a higher range during the course of a bull market than when the index was under the influence of a primary bear trend. Last week, it managed to work its way slightly back above the normal bear range. If it should peak from here, that would be a normal bear market characteristic. On the other hand, further strength enabling it to push through into a blue overbought zone would alert us to the fact that the primary bear market case is not as airtight as previously estimated. Things are clearly coming to a head, as one of the two converging trend lines is about to be penetrated.
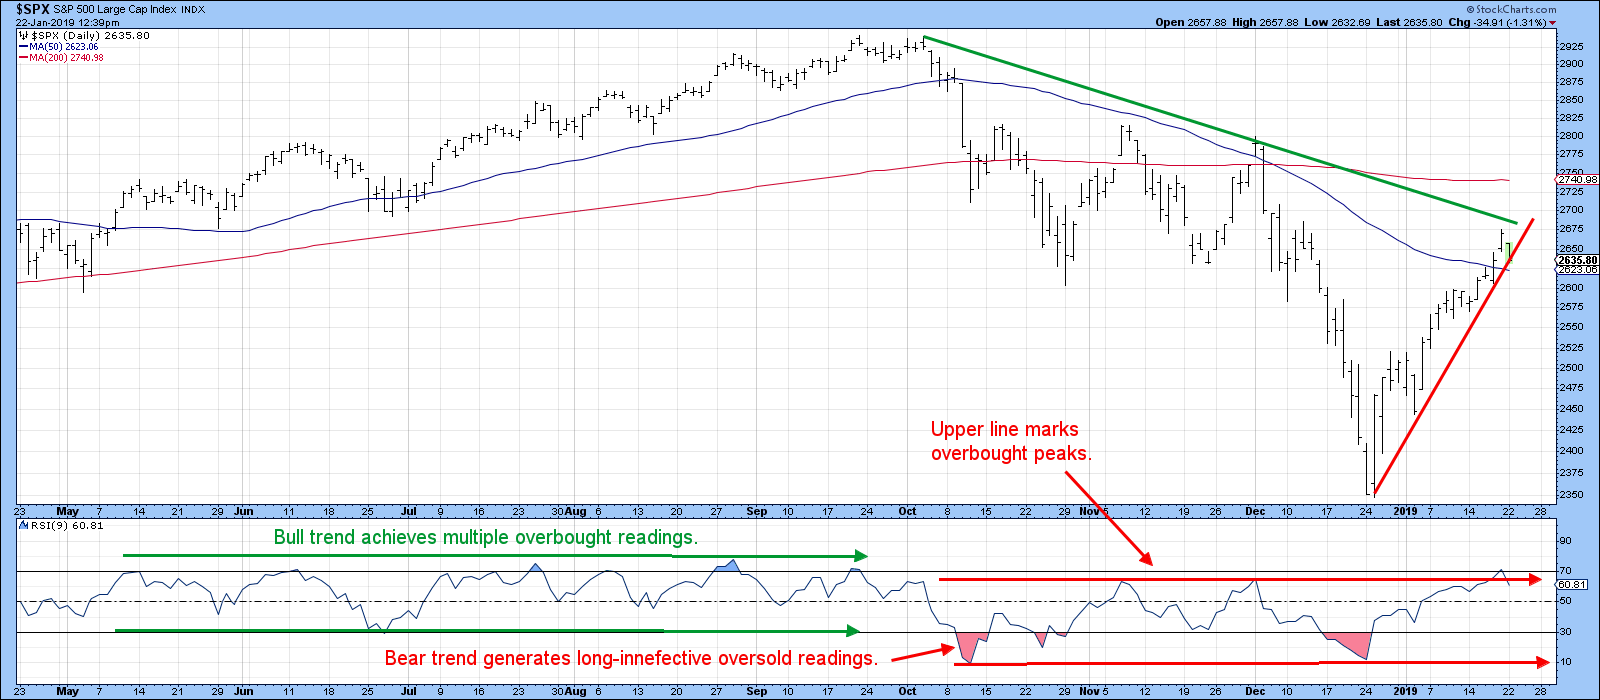
Chart 4
We can see the same sort of thing for the NYSE Composite in Chart 5. It, like the global index cited earlier, peaked way back in January of last year, meaning that the bear market is well advanced. In keeping with that characteristic, the RSI has so far failed to surpass its upper bear trading range trend line.
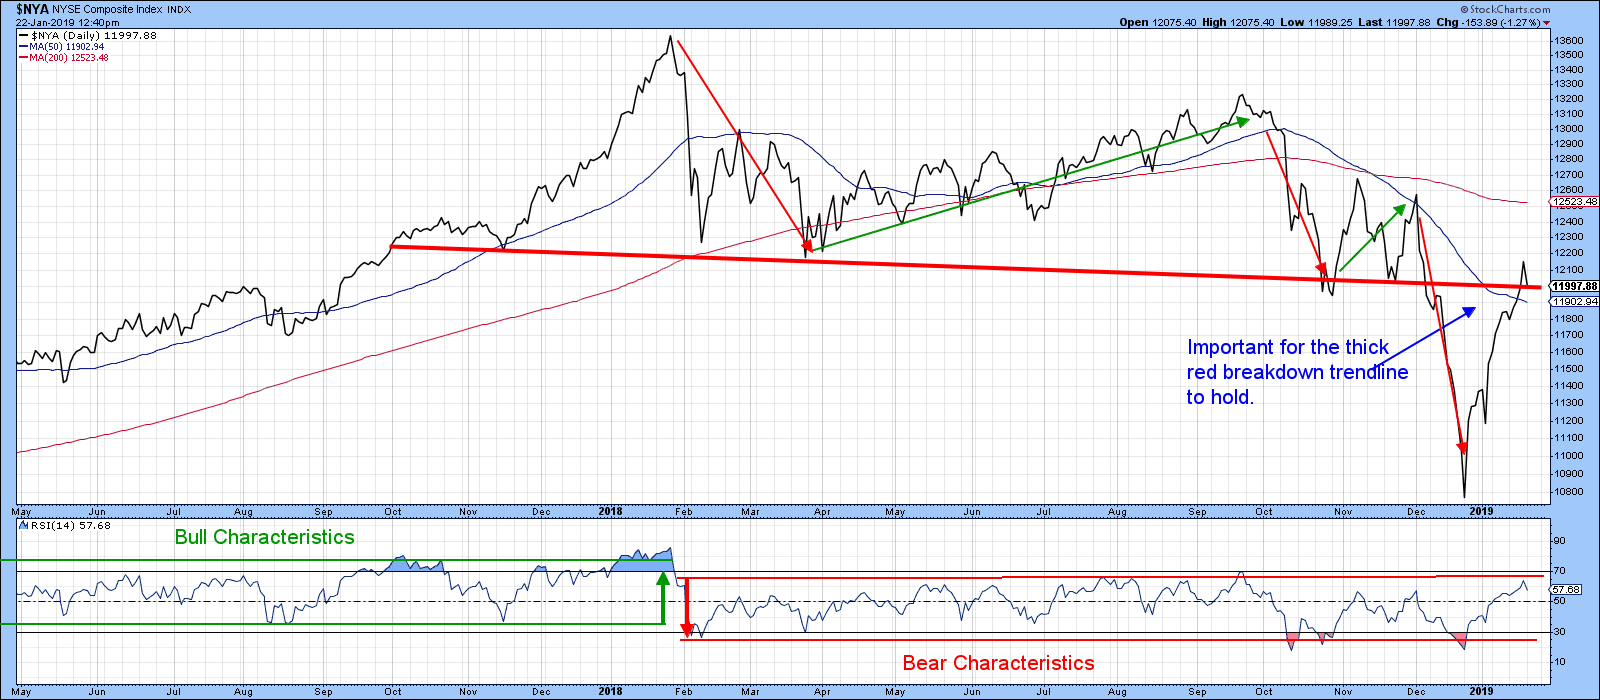
Chart 5
The red uptrend line in Chart 4 was quite steep. However, if we return to the S&P Composite and break it down into hourly information, you can see that it returns a better trend line. That’s because it has been touched or approached on more occasions than its daily counterpart. Moreover, you can see that the stochastic and RSI have both decisively violated their equivalent trend lines. The price itself has started to edge below the line, but nothing decisive has yet happened. Remember, this is an hourly chart, which does not have as much significance as a monthly or weekly one, so one should not read too much into any break that might materialize. However, the current overbought short-term condition does suggest that any decisive deterioration from current levels could trigger a test of that December low.

Chart 6
Dollar ETF Breaking Out?
Finally, Chart 7 shows that the Dollar Index ETF (UUP) may be in the process of breaking to the upside. Note that it broke down from the dashed red uptrend line a few weeks ago. However, it did not stay there very long, having since managed to rally back above the extended line as well as the small green downtrend line. Current action looks to be very similar to that which developed in late September of last year. Both instances evolved from a bounce from an oversold RSI, double trend line breaks on the price and RSI as well as a cross above the 50-day line. It’s nail-biting time as we go to press, since the UUP, having opened earlier at a higher level, has closed any gap that may have developed and fallen to support in the form of the two converging lines. However, false downside breaks are associated with primary bull markets, as is great sensitivity to an oversold condition. That all argues for a stronger dollar. Let’s see whether Mr. Market agrees.
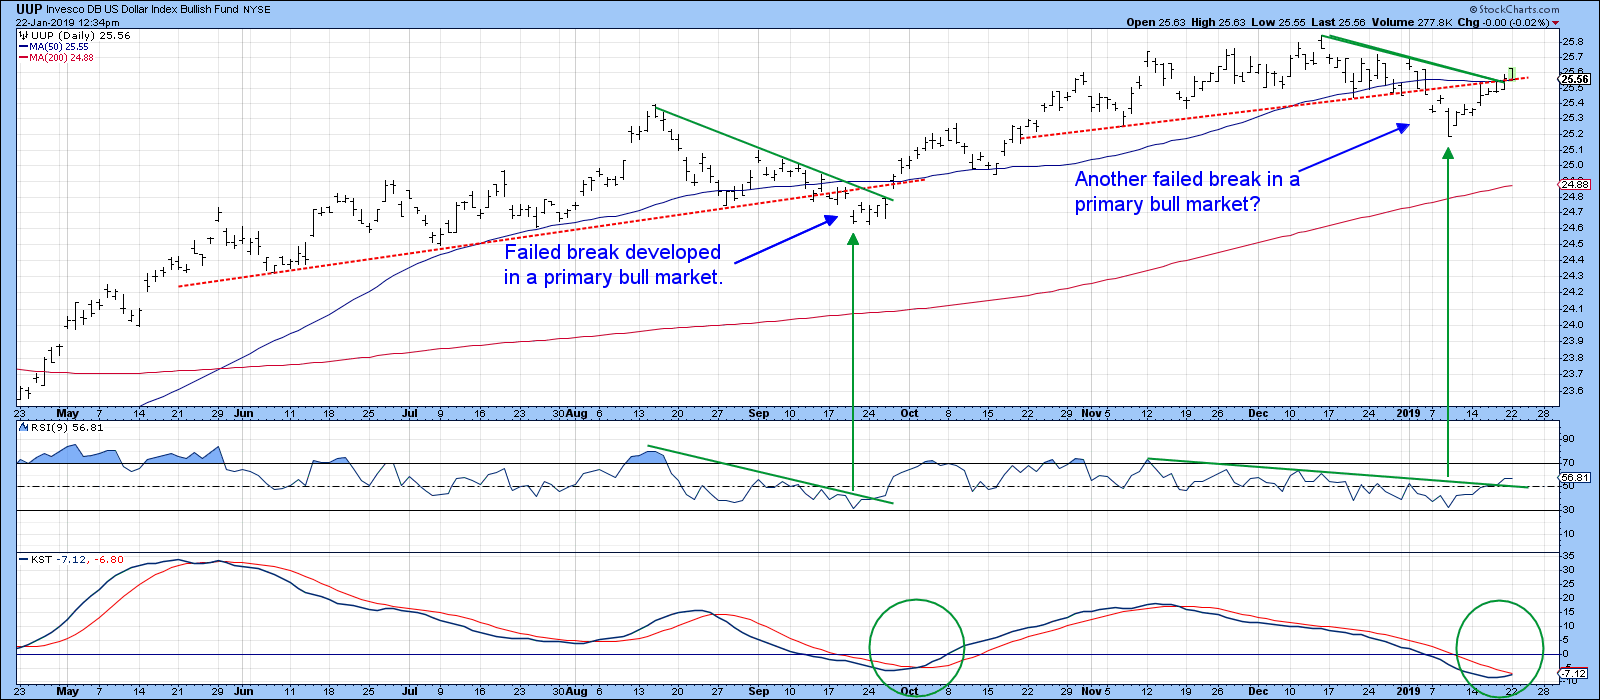
Chart 7
Good luck and good charting
Martin J. Pring
The views expressed in this article are those of the author and do not necessarily reflect the position or opinion of Pring Turner Capital Group of Walnut Creek or its affiliates.


