Dollar Index On The Verge Of A Breakout?
- Dollar About to Break New Ground?
- Euro Starting to Break Down
- Swiss Franc at a Major Juncture Point
- The Fortunes of the Canadian, Australian and EM Currencies are Tied to Commodities
Dollar About to Break New Ground?
I last wrote about the dollar at the end of January, pointing out that it had just broken above the green down trend line (flagged as “A” in Chart 1). That situation looked to be very similar to last September’s upside breakout; in both cases, the breakout followed a false penetration of a dashed red uptrend line, a positive break above a green RSI downtrend line and a short-term KST buy signal. As it turned out, Mr. Market did not immediately agree, as the UUP once again dropped below the extended red uptrend line.
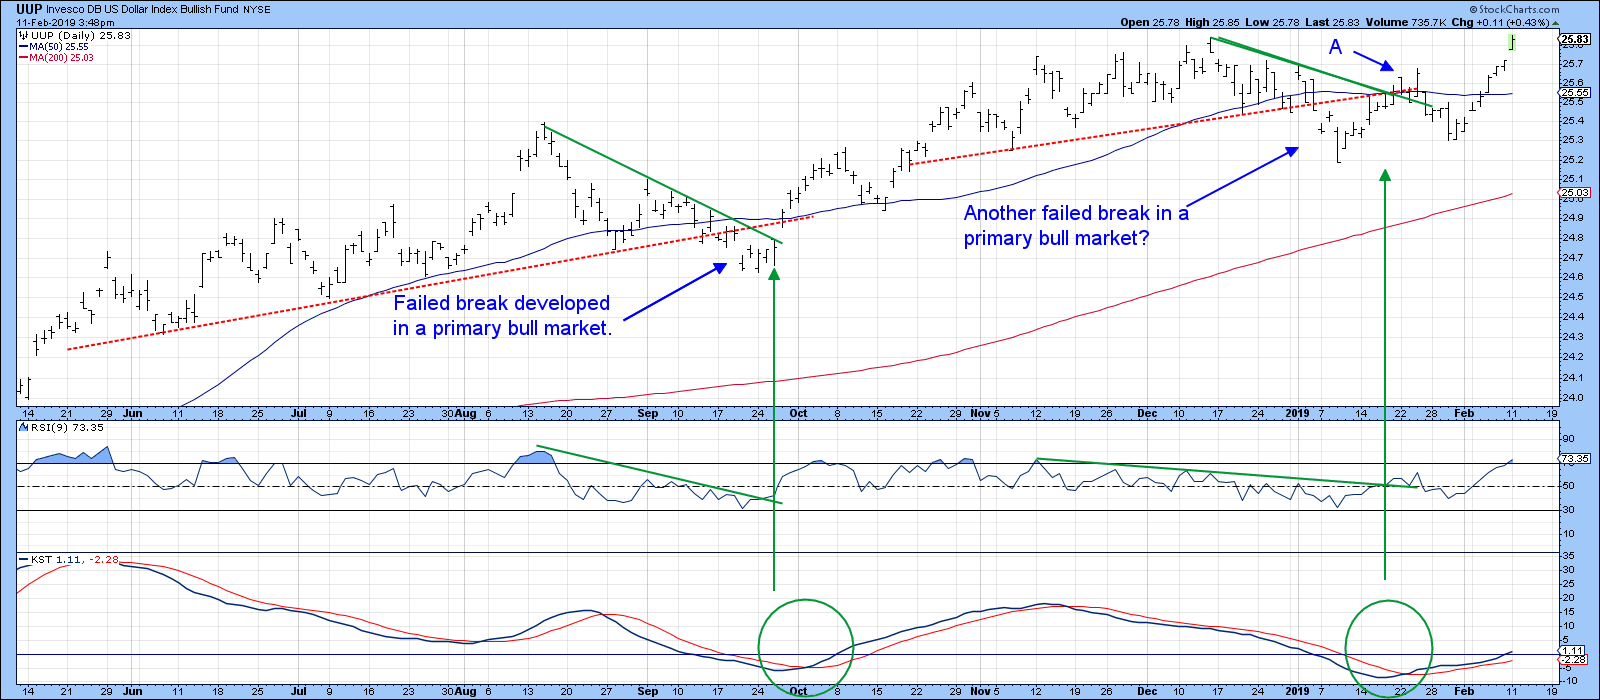
Chart 1
Since then, the UUP has broken above the horizontal green trend line joining the December-February intraday highs. The RSI is now overbought at a time when the 2018 high is being tested. Coming on top of eight consecutively higher closes and a small gap on Monday, that could present a temporary problem. However, the KST is still bullish and at a neutral level, which tells us that not all timeframes are overextended.
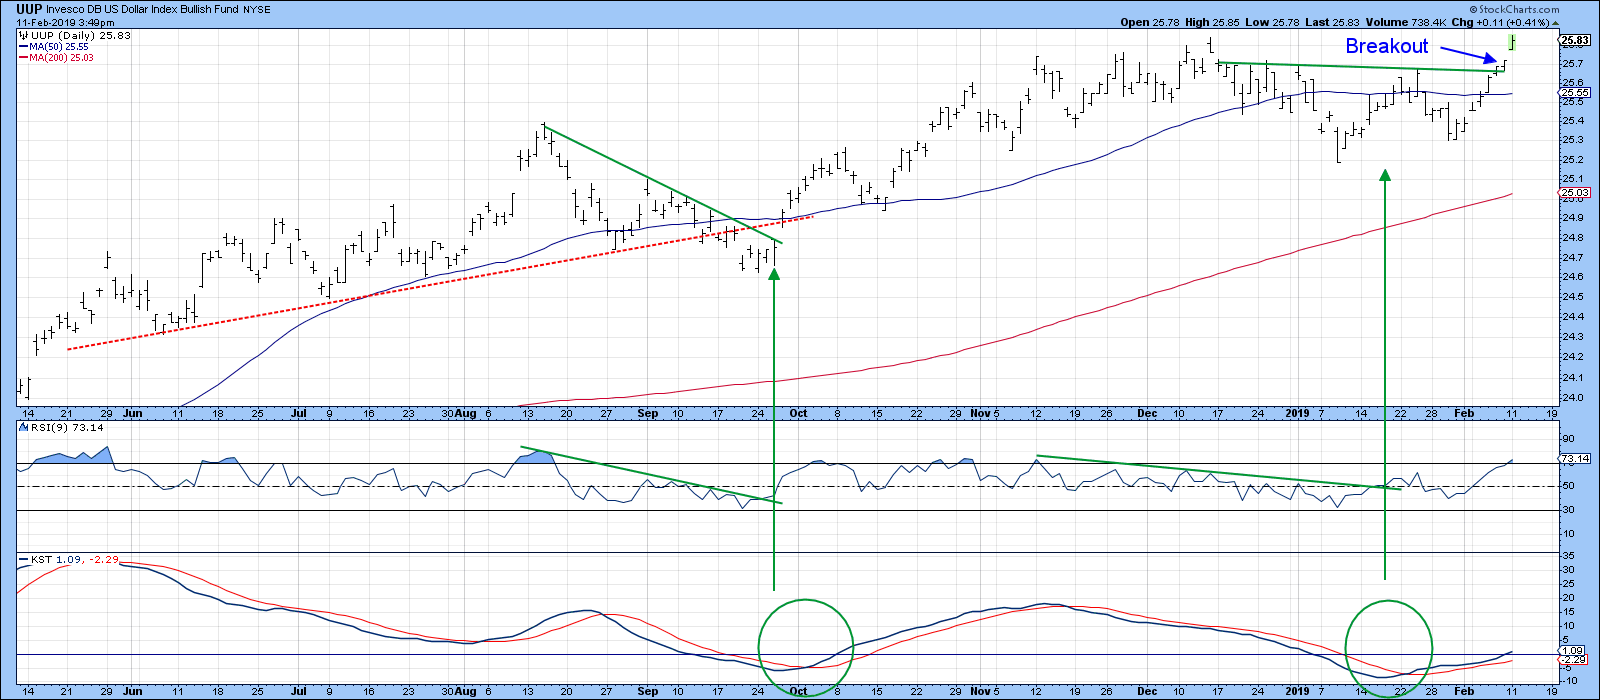
Chart 2
Moreover, Chart 3 shows that the Dollar Index itself is above its 12-month MA, while the long-term KST is positive. The green-shaded areas point out that, in the past, this condition has been associated with some of the strongest moves in the dollar. Generally speaking, bull markets have a habit of either ignoring or downplaying very overbought short-term conditions.
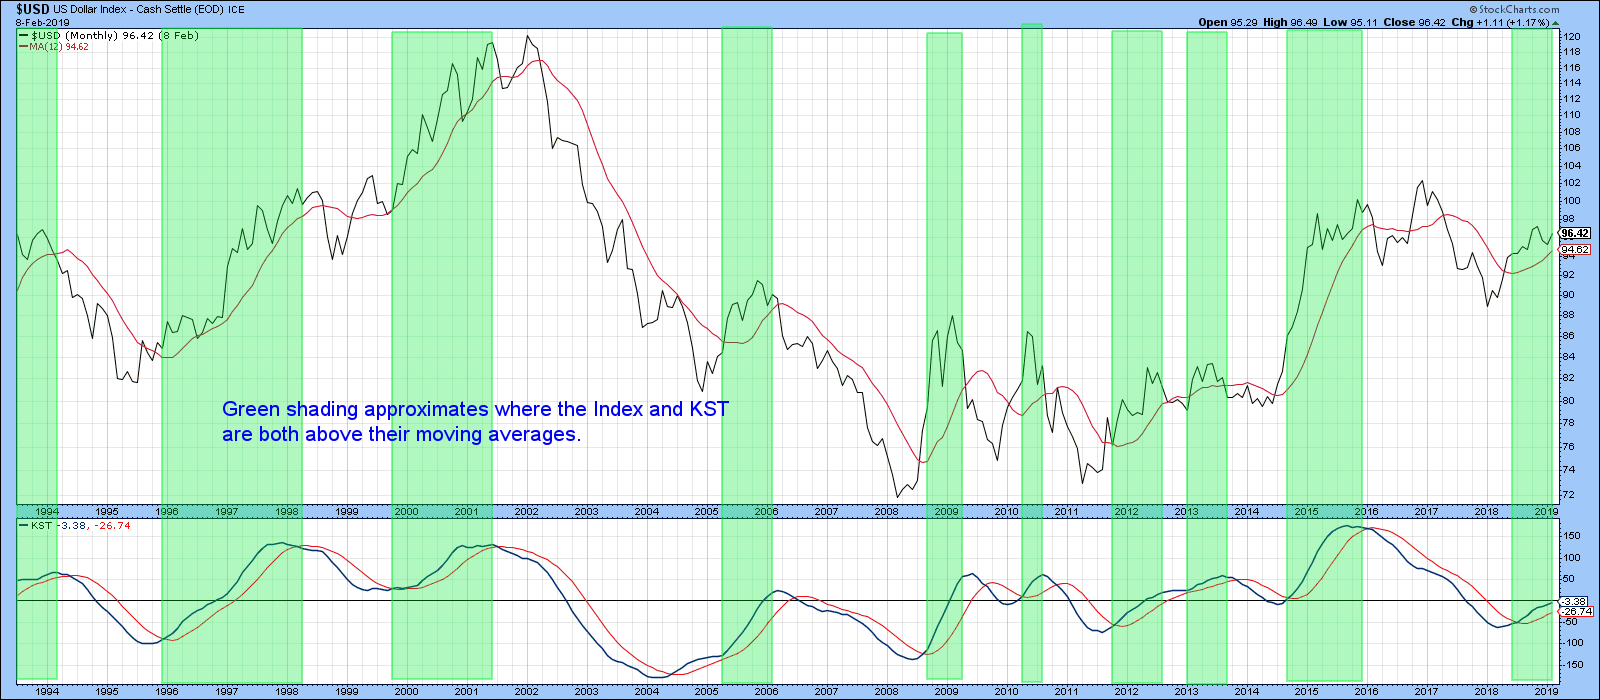
Chart 3
That’s important because the Special K (SPK) for the UUP (Chart 4) has recently broken above the 4-year downtrend line and remains above its red signal line. Both events suggest a higher Dollar Index. You can read about the SPK here.
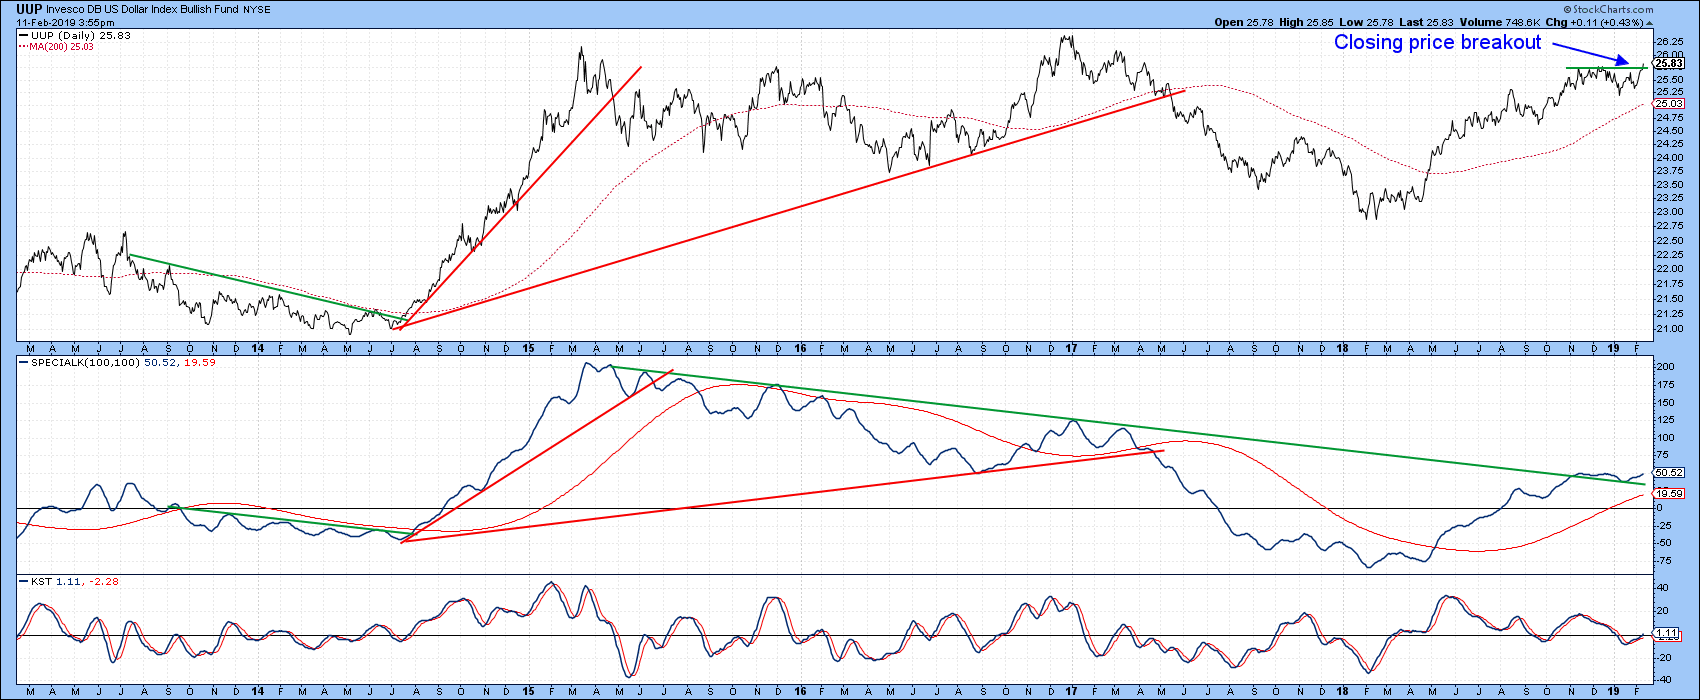
Chart 4
Euro Starting to Break Down
On Monday the Euro fell below its 2017-2019 uptrend line. Since it has been touched or approached on numerous occasions, this penetration is a serious one. However, the SPK itself has yet to drop below its 2015-2019 uptrend line. There are two likely reasons for this: first, the KST in the bottom window has gone slightly bearish; second, the SPK is already trading below its signal line. Remember, the Euro has a 57% weighting in the Dollar Index.
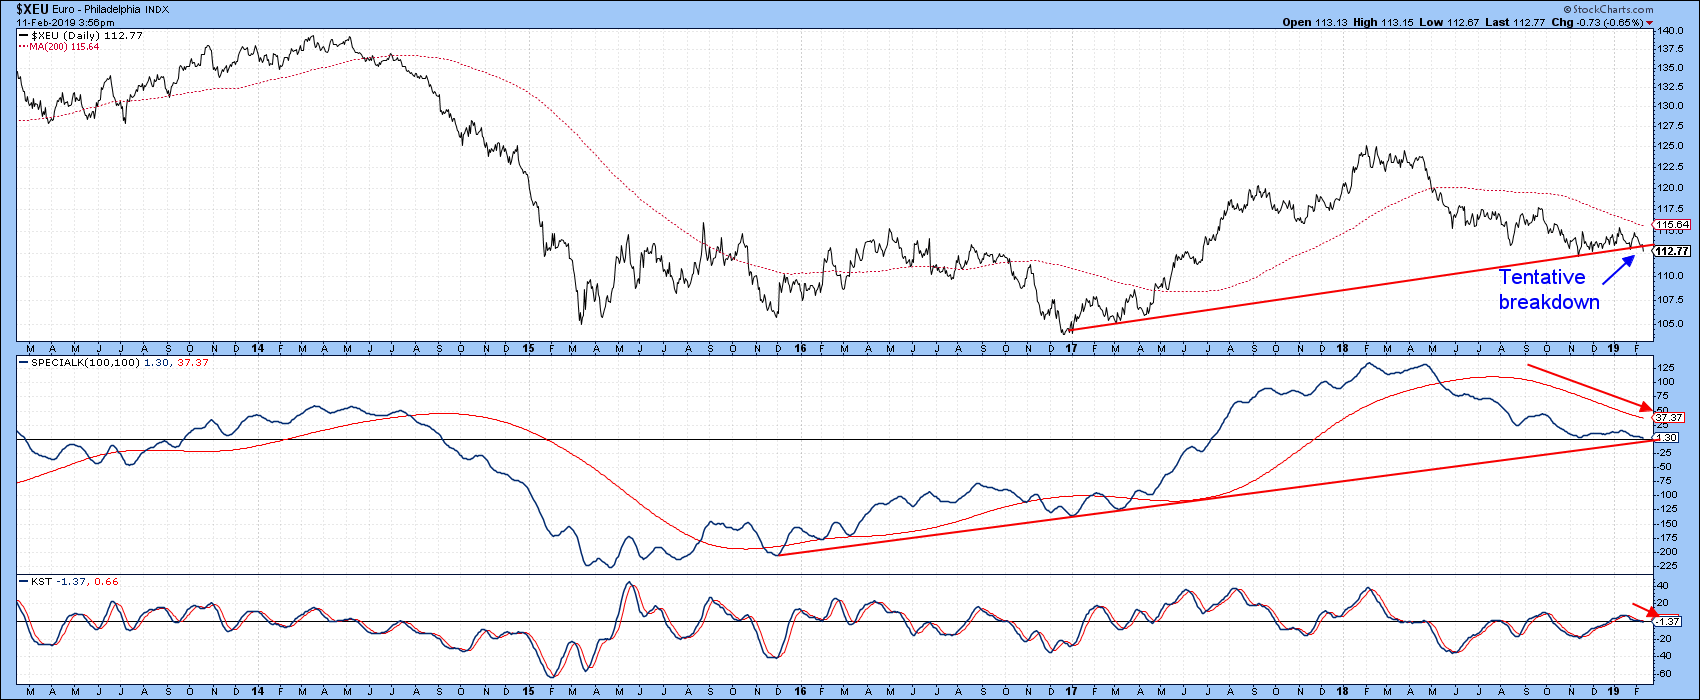
Chart 5
Swiss Franc at a Major Juncture Point
Chart 6 features the long-term action of the Swiss Franc, where we can see that it is trading in the lower part of a gradually narrowing long-term trading range. That range-bound activity may well turn out to be a symmetrical triangle - a pretty large one at that. We could point to the fact that the currency is currently below its 12-month MA. However, it has experienced so many false crossovers in the last 8 years or so that a penetration of one of those two converging trend lines is likely to provide us with a more accurate signal. If my interpretation of a resurgent dollar proves to be correct, it would seem that the Swiss Franc is likely to follow the lead of the long-term KST and break to the downside.
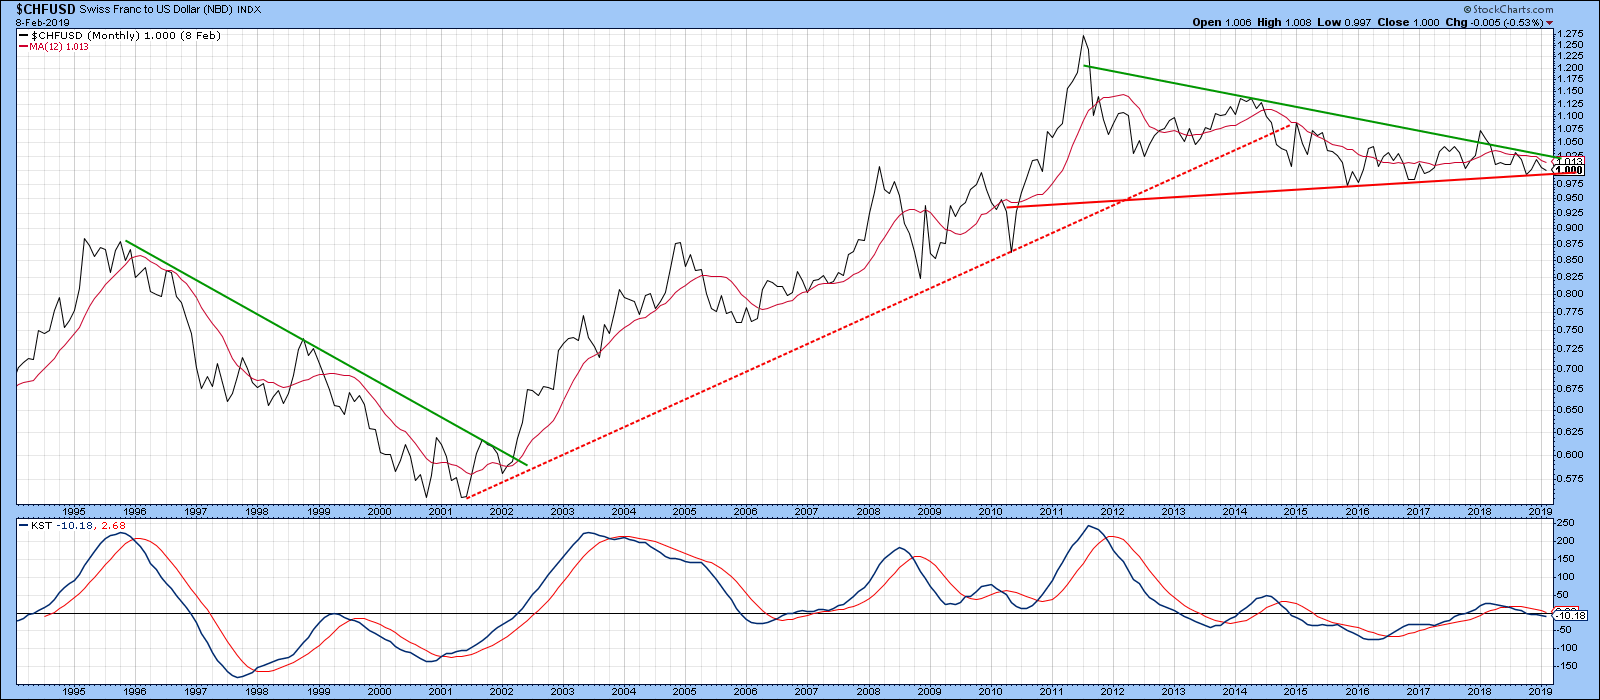
Chart 6
Chart 7 displays more recent action, where we can see that the currency, having completed a bearish head and shoulders pattern last week, looks set to challenge its November low. Bearing in mind the potential mega top in the previous chart, things do not look encouraging.
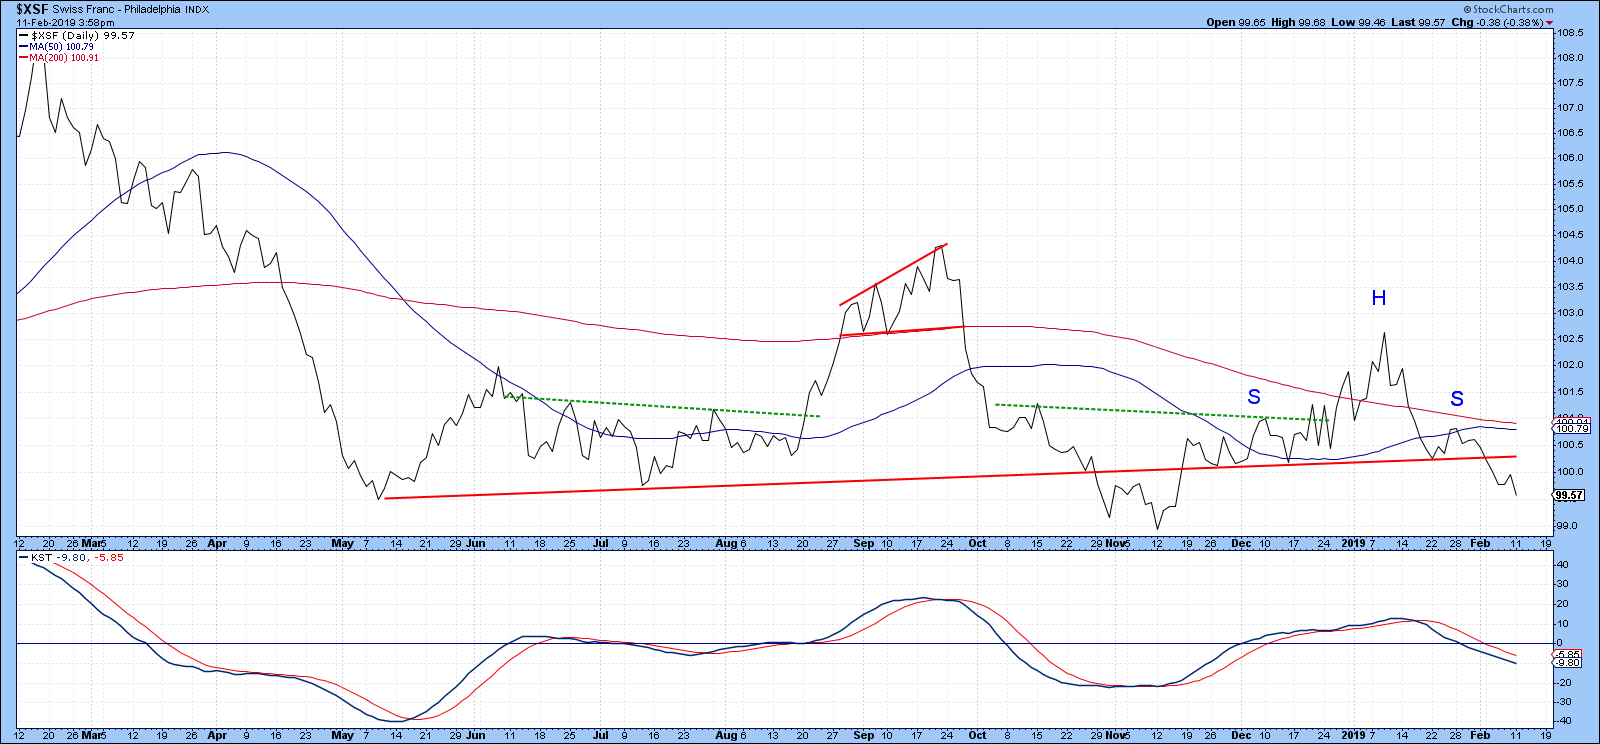
Chart 7
The Fortunes of the Canadian, Australian and EM Currencies are Tied to Commodities
When the dollar rises, commodities usually fall, as do currencies that are tied to commodity prices. Chart 8, for instance, compares the performance of the resource-based Canadian dollar to the CRB Composite over the last 25 years. The multiple joint trend line violations show that the Canadian dollar and the CRB usually move in the same direction. Indeed, when it is possible to construct a trend line for both series and these lines are violated, that usually represents a reliable signal of a reversal in both. Earlier this year, each series broke down from a 2016-2019 trading channel. Since the KST for the Canadian buck is also bearish, it looks as though the currency is headed lower.
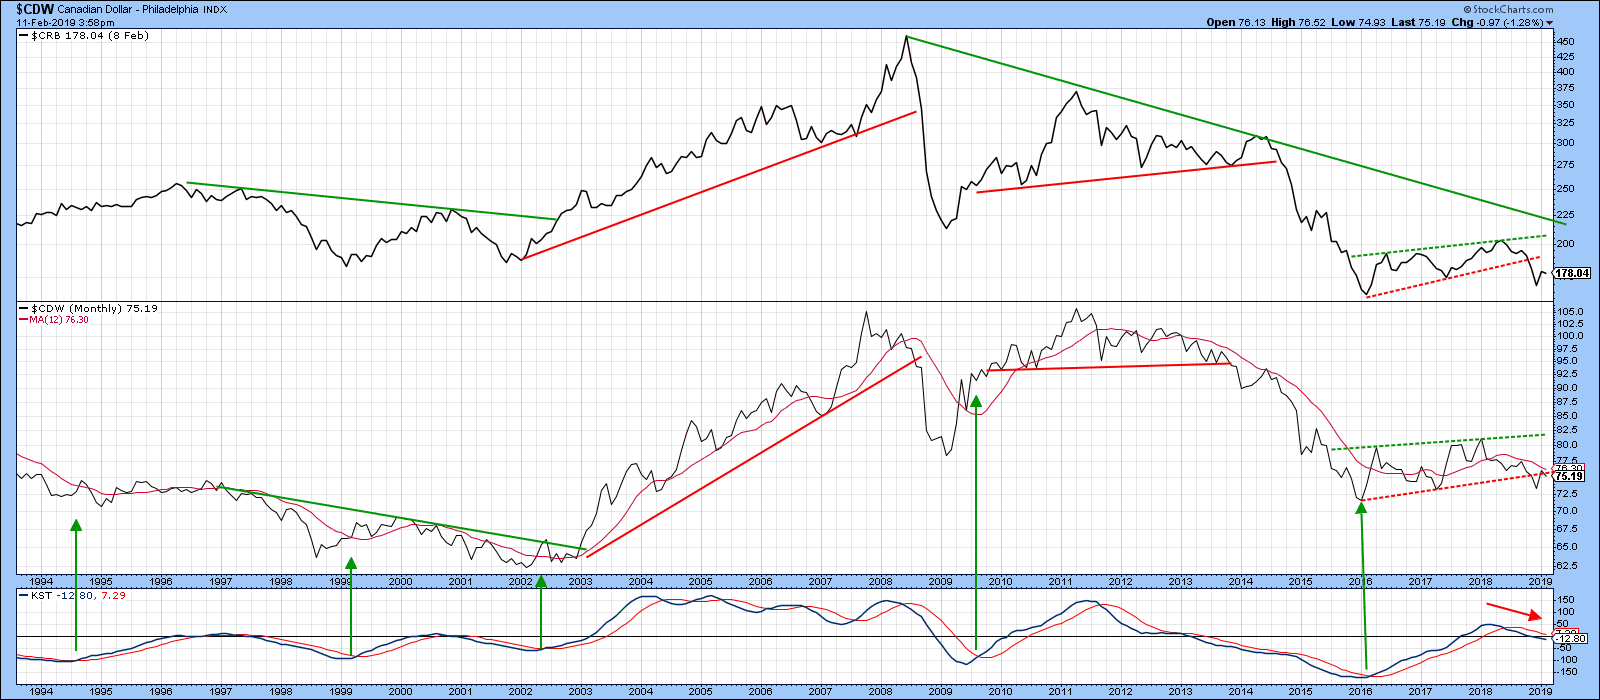
Chart 8
Chart 9 features a comparable setup for the Aussie Dollar. A similarly negative outlook appears likely, since this currency has followed the breakdown in the CRB with one of its own. Moreover, the long-term KST is bearish.
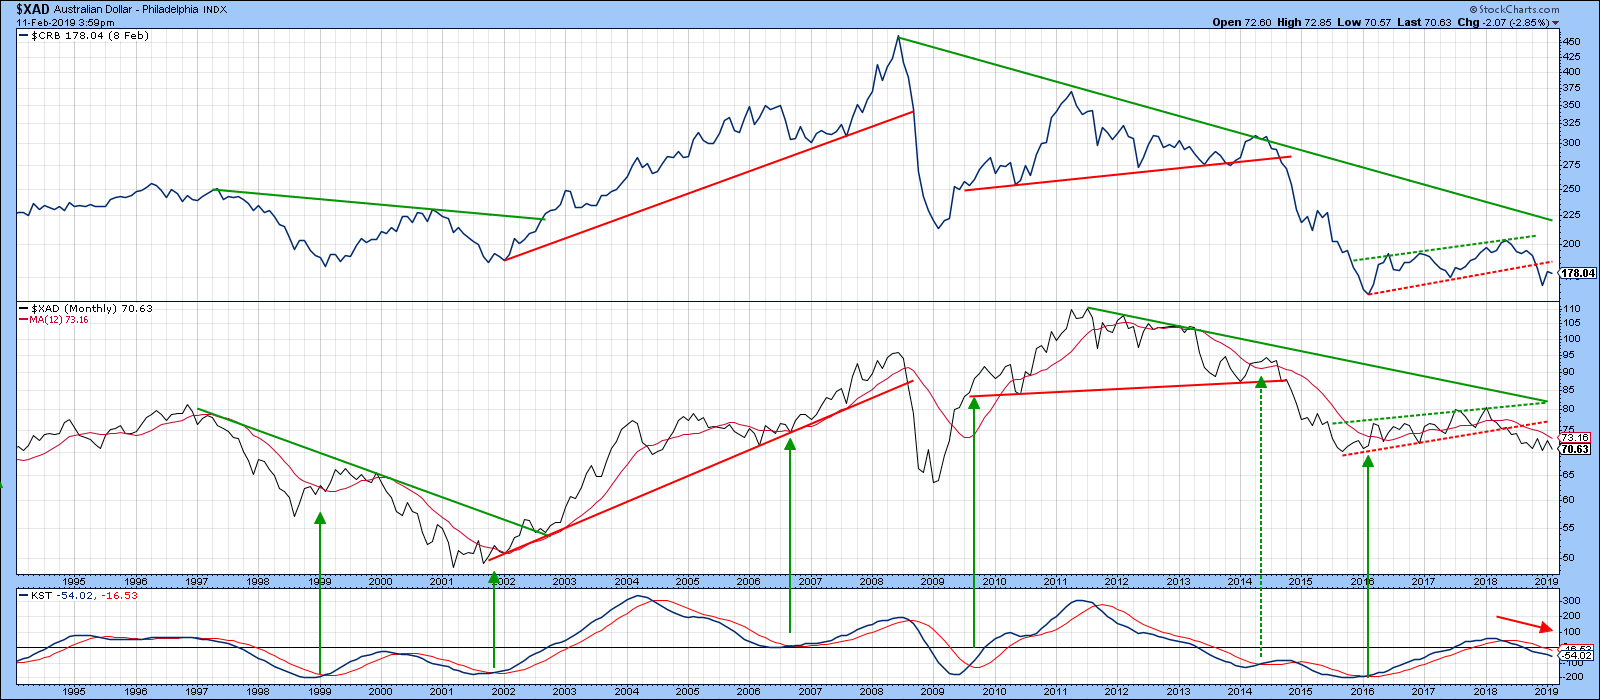
Chart 9
Chart 10 tells us that, as a group, the fortunes of emerging currencies are also tied to the commodity markets. To demonstrate this point, I am using the Wisdom Tree Emerging Currency Strategy Fund (CEW) and comparing it with the CRB. In this instance, however, the 2016-2019 recovery in the CEW has been stronger than those of the Canadian and Aussie dollars, to the extent that it is currently poised marginally above its 12-month MA.
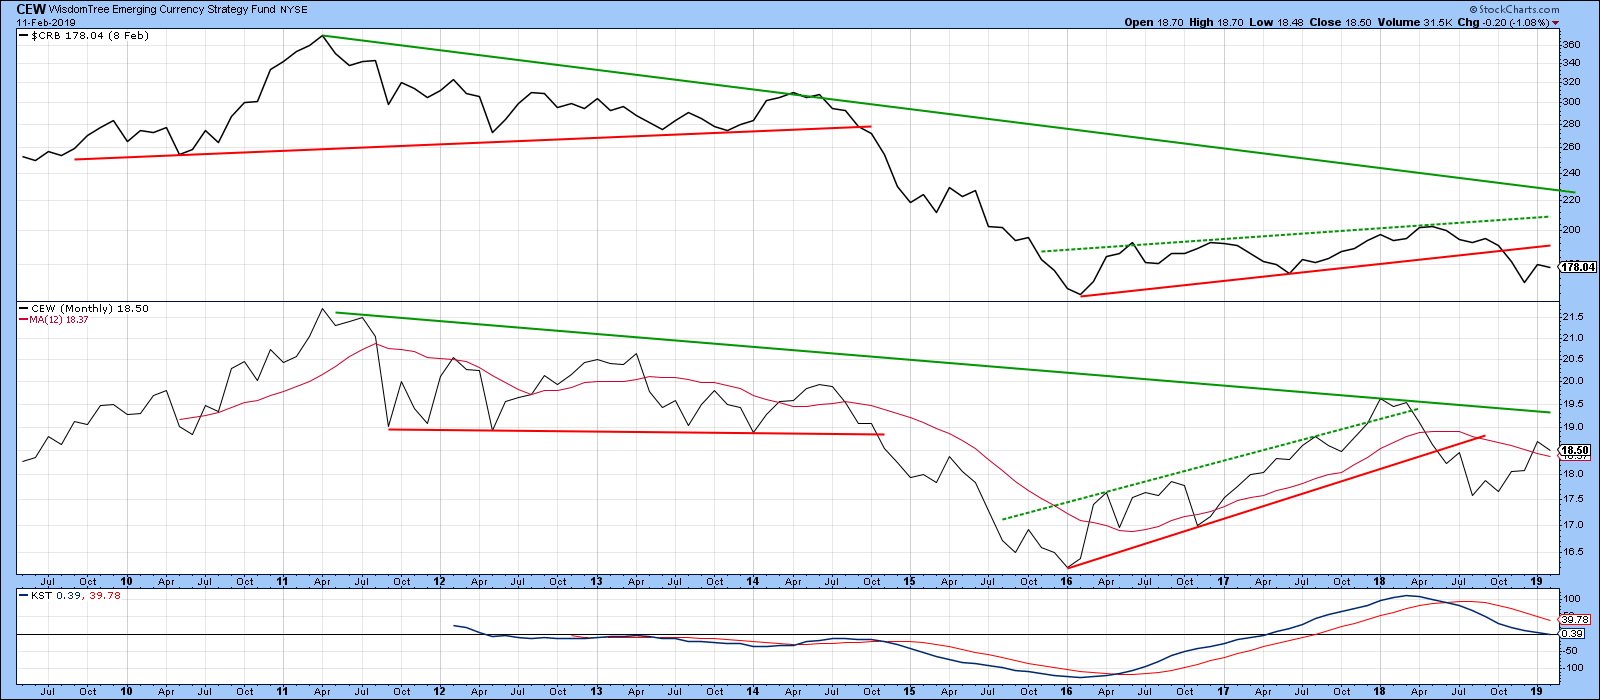
Chart 10
Finally, Chart 11 compares the CEW with the MSCI Emerging Markets ETF (EEM). Note that both series peaked or troughed jointly in 2011, 2016 and 2018 at points A,B and C. The EEM is currently below its 12-month MA and the extended 2016-2019 uptrend line (shown in red), which places it in a bearish mode. Given the strong possibility of a firmer dollar and consequently lower CEW, it seems likely that the EEM is headed lower in the period ahead.
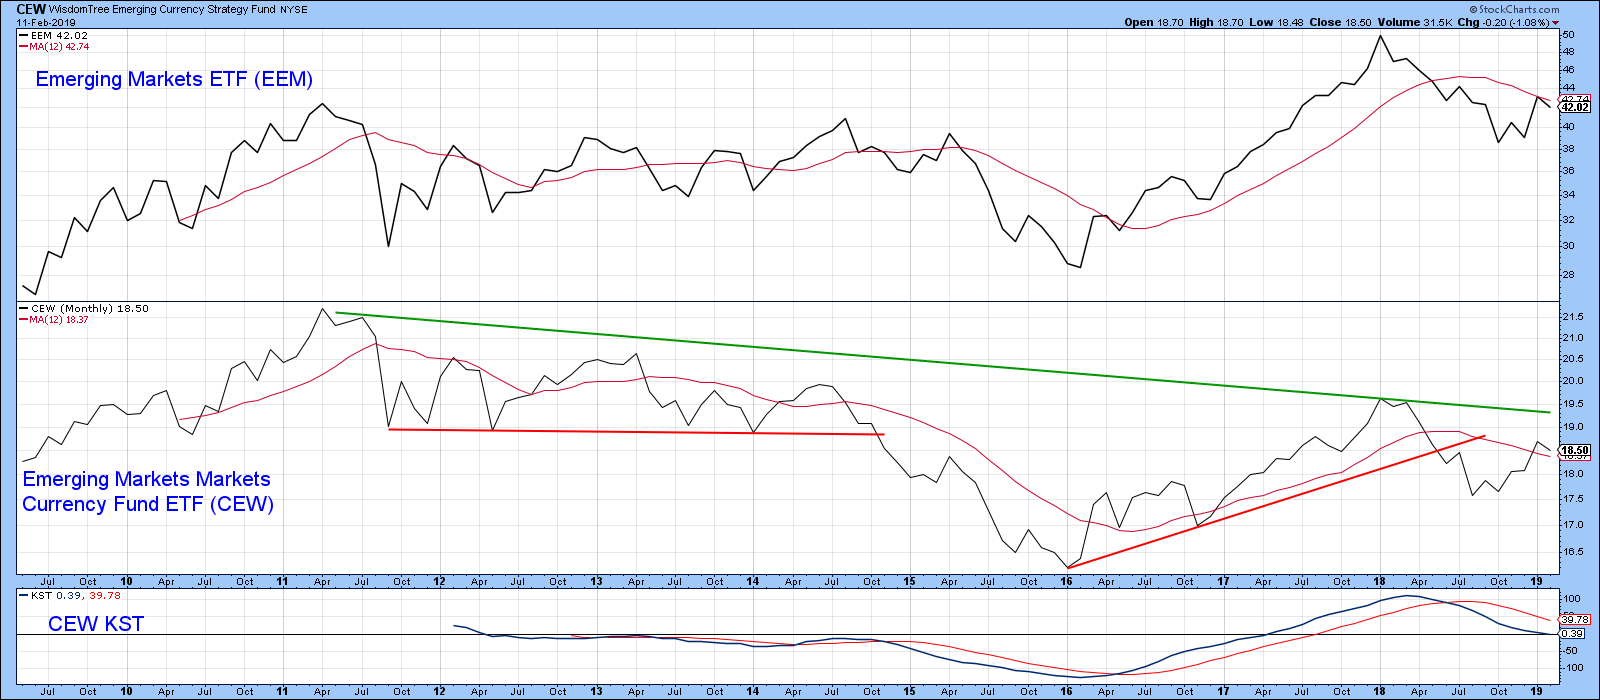
Chart 11
Good luck and good charting
Martin J. Pring
The views expressed in this article are those of the author and do not necessarily reflect the position or opinion of Pring Turner Capital Group of Walnut Creek or its affiliates.


