Is It Time For A Contra Trend Correction?
- Major Trend Remains Positive
- Weekly Bar and Candle Charts Offer a Warning
- Reliable Short-Term Indicators, like Sentiment, are Overstretched
Major Trend Remains Positive
Each weekend, I go through a ChartList featuring weekly bar and candle charts of key markets. The idea is to spot technical events that appear on the weekly data but that the daily charts totally miss. Today, I am specifically looking for one- and two-bar reversal or consolidation patterns. Examples would include outside bars on the bar charts or, alternatively, engulfing patterns and such like on the candles. Most of the time, there is nothing worthy of note, but, occasionally, some interesting patterns do show up. Assuming they “work,” one- and two-bar patterns are expected to have an effect for between 5-10 bars. For weekly charts, that means 5-10 weeks, so it’s well worth the exercise.
Last week saw a couple of important indexes trace out some bearish patterns, which I will get to later. First, though, I want to point out that the long-term or primary trend is bullish, which is what should be attracting your attention unless your time horizon is extremely brief. (Even then, the character of short-term moves is largely determined by the direction of the primary trend, so it’s still worth monitoring.)
Chart 1 puts the long-term picture into perspective, comparing the S&P Composite with a PPO using the 6/15 parameters. The vertical green lines show when it reverses to the upside in a decisive way from a position at or below the horizontal blue line. I count twenty four-signals since the 1940s, only two of which could be regarded as failures. Those are pretty strong odds in favor of a bull market, which certainly has relevance for the latest signal. The reason I bring this up is because we need to put any potential correction into perspective. Generally speaking, contra trend moves are difficult to identify and are often deceptive in nature. If a false buy signal is going to materialize, it’s usually going to happen in a bear market. Similarly, sell signals under the context of bull trends are often limited in scope or take the form of trading ranges.
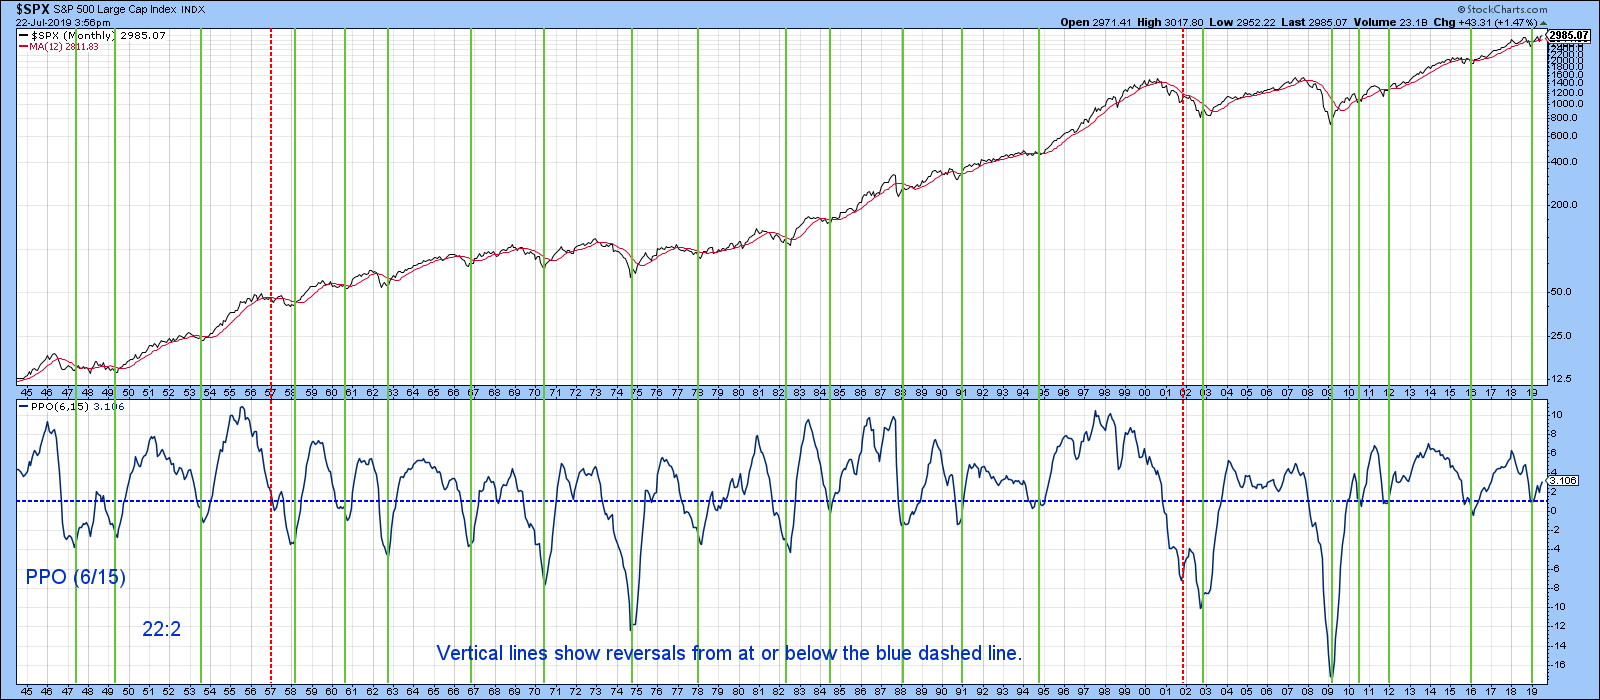
Chart 1
Weekly Bar and Candle Charts Offer a Warning
Bearing that in mind, Chart 2 shows that the S&P formed a two-bar reversal in the last two weeks. A bearish two-bar reversal occurs when the first bar, following a short-term uptrend, opens near its low and closes near its high, thereby fulfilling the expectations of the bulls. The second bar opens near the close of the first bar, as traders expect more from the rising trend. However, it closes near the open of the first bar, indicating a complete turnaround in psychology. More to the point, virtually anyone who bought during the formation of this pattern is coming home with a loss. By way of demonstrating the power of these one- and two-bar patterns, the chart also features a bullish outside bar back in June. It seems to me that last week’s completion of a two-bar reversal may not pack as big a punch. First, it is a contra trend signal, as opposed to June’s reversal, which was triggered in the direction of the main bullish trend. Second, that June bar was very wide, indicating an important battle between buyers and sellers that was won decisively by the buyers.
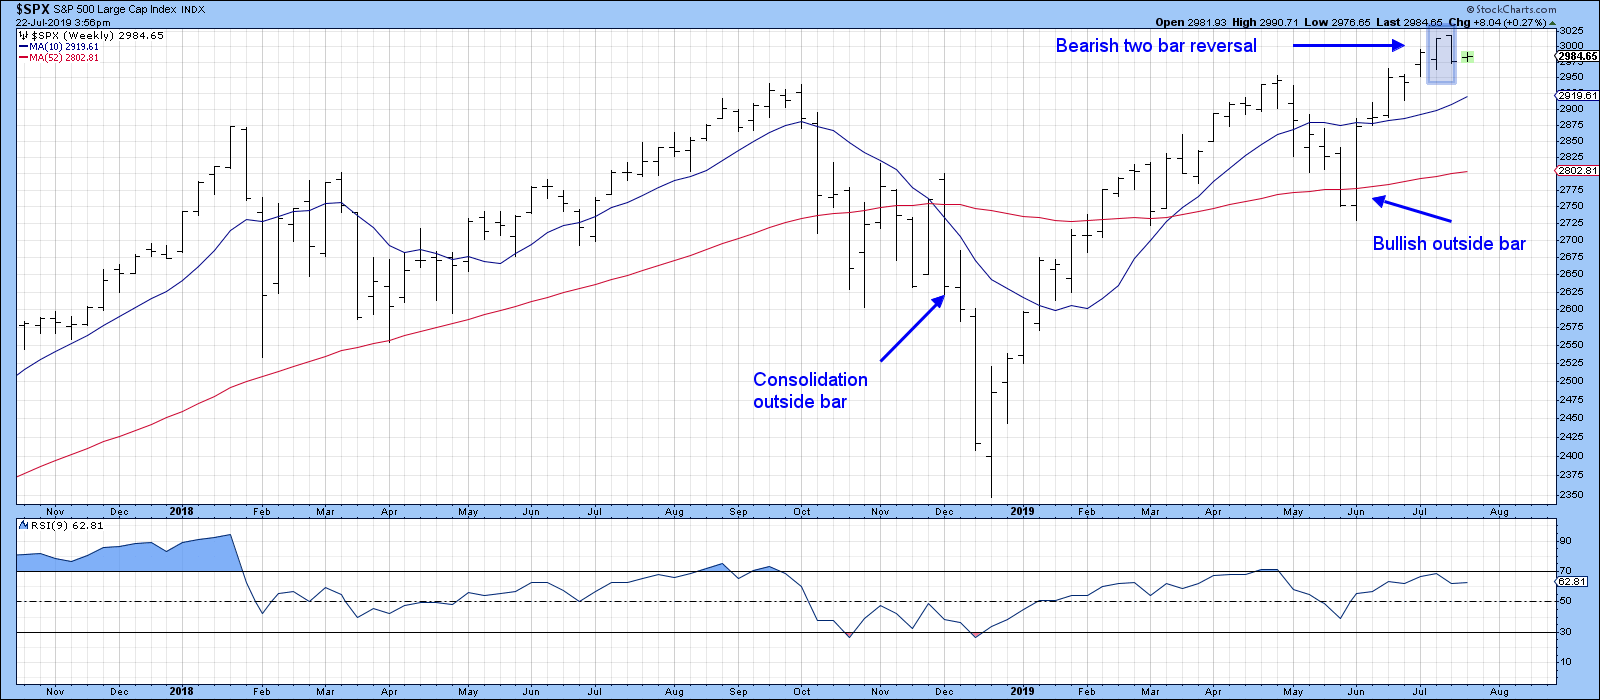
Chart 2
The width of July’s two-bar reversal was substantially less. The same can be said from a comparison of the bullish and bearish engulfing patterns in Chart 3.
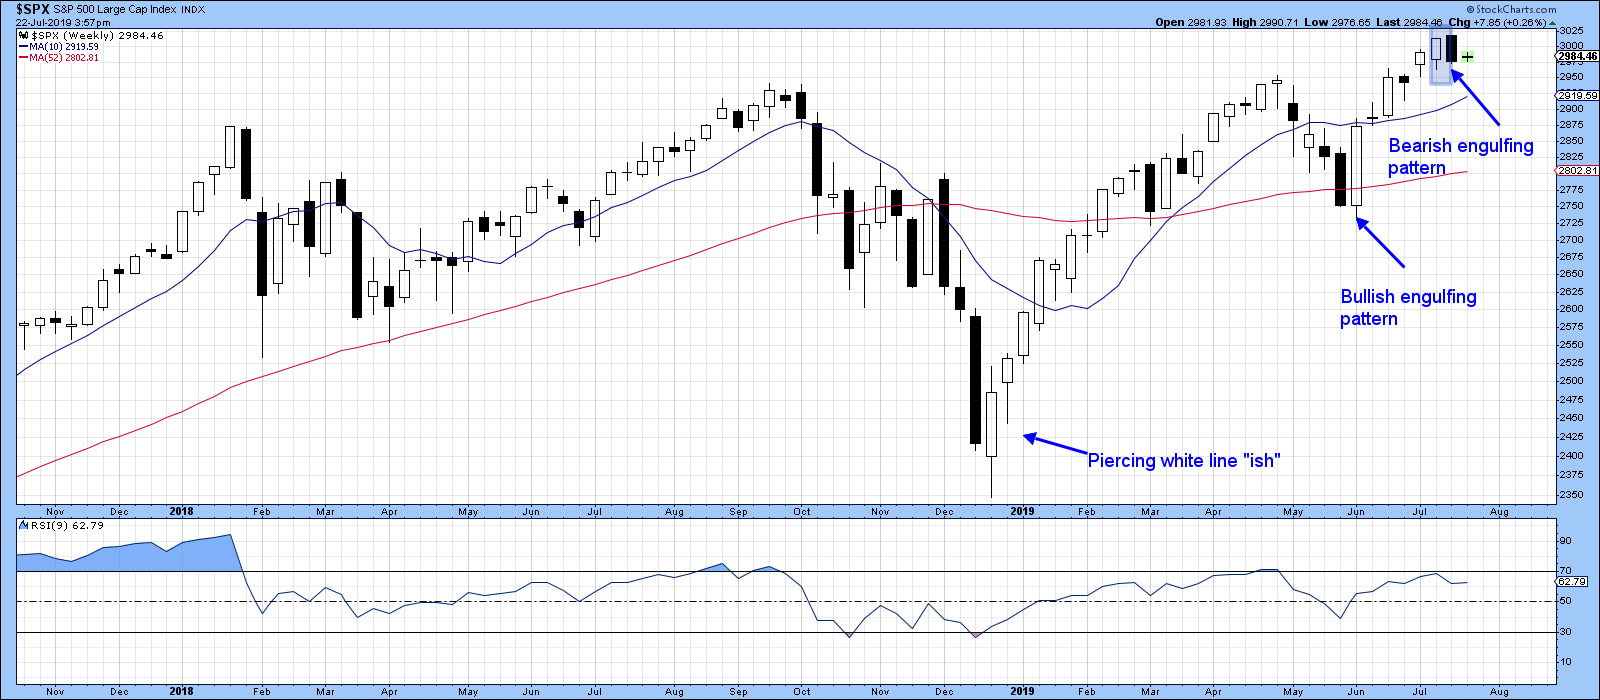
Chart 3
Over at the NASDAQ, we see a mild form of two-bar reversal in Chart 4. I say “mild” because the close on the second, less wide, bar is well above the opening of its predecessor. That means we do not get as strong of a message that the balance of power has switched to the sellers.
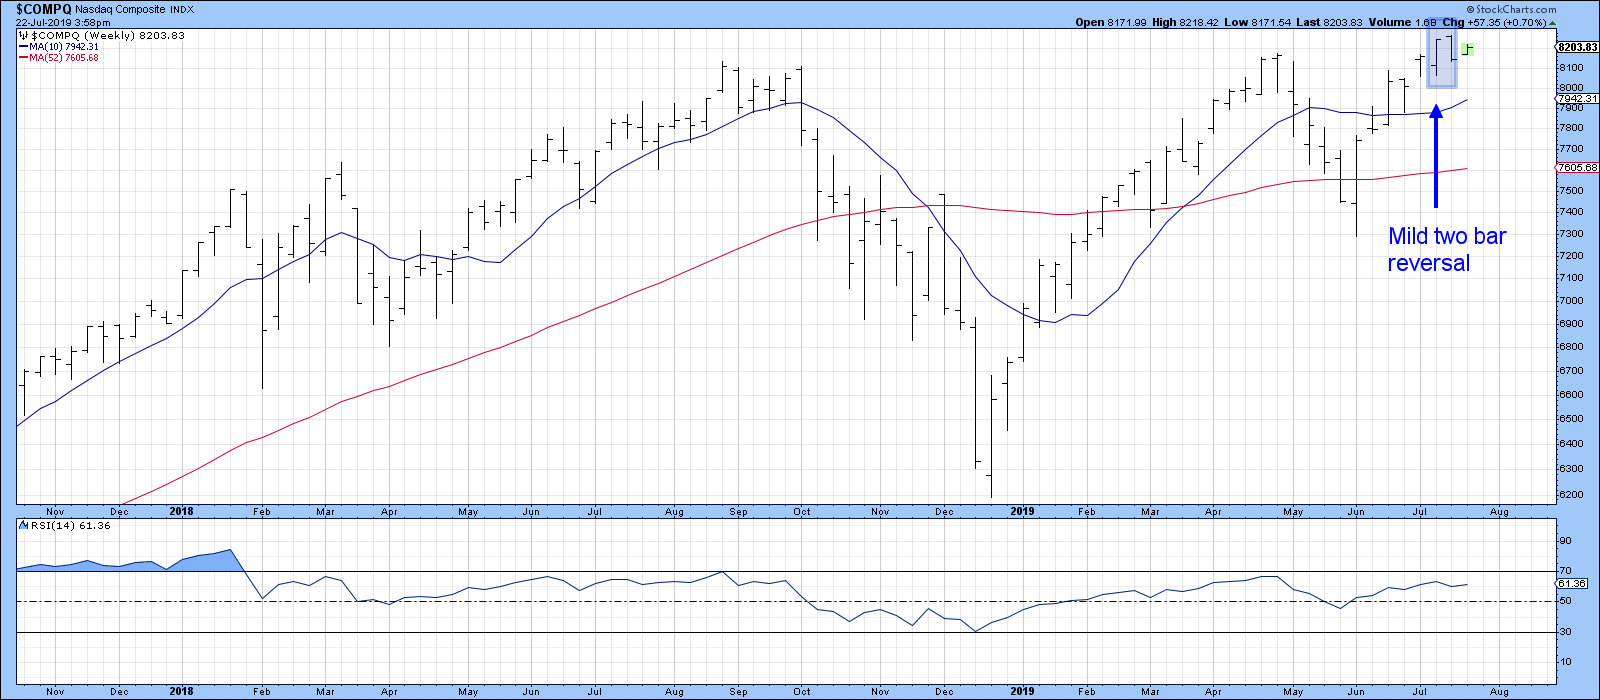
Chart 4
Chart 5, featuring the candles, has a slightly more powerful message, as it contains a bearish dark cloud cover. That’s where the high of the second candle's real body is above the upper wick of the first and where its real body closes more than halfway down the initial candle. Neither candle is particularly wide, so we do not come away with the impression that a great battle has been won by the sellers.
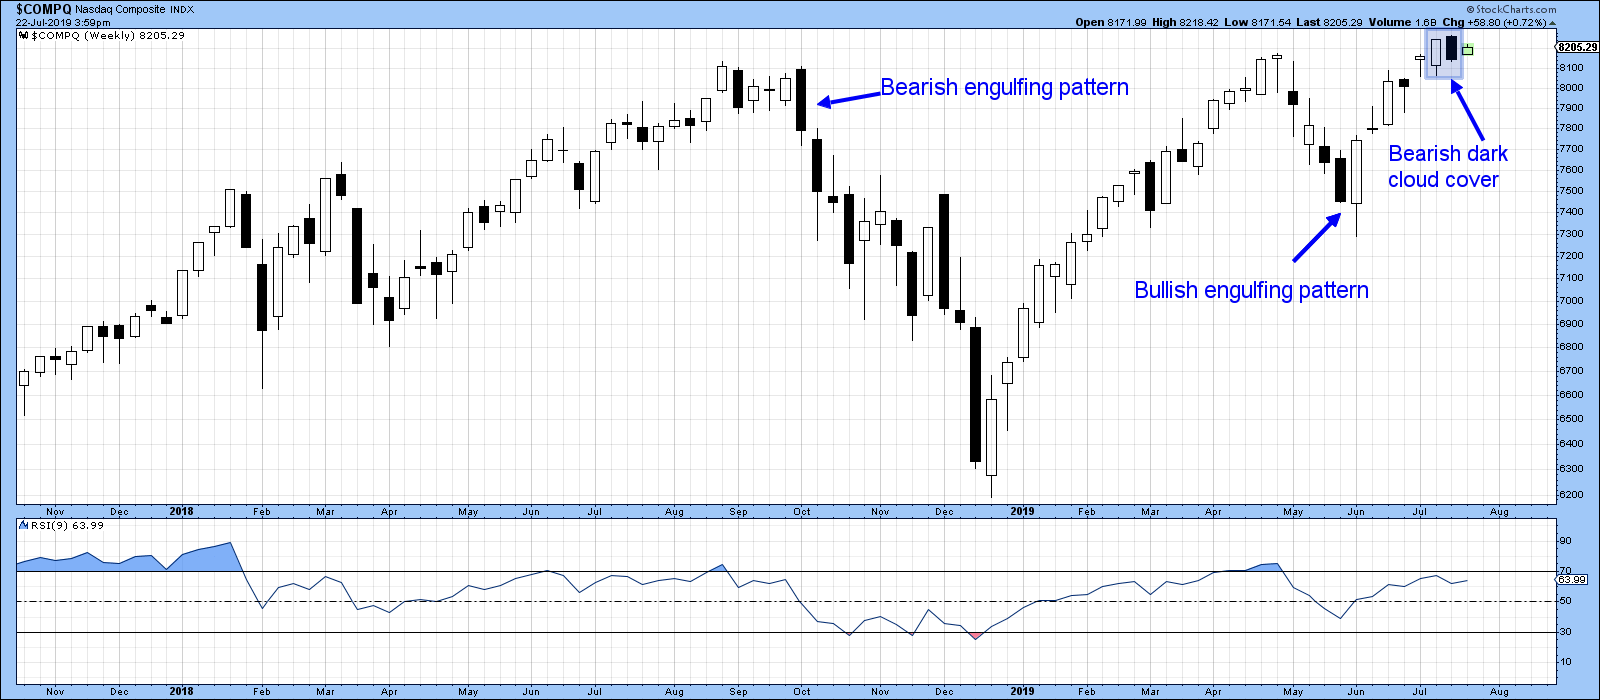
Chart 5
Reliable Short-Term Indicators, like Sentiment, are Overstretched
These bearish weekly patterns do not appear in isolation, as several short-term oscillators are also overbought. For instance, Chart 6 features my Dow Diffusion indicator, which monitors the percentage of Dow stocks that are above their 40-day MA. The plotted series is a 10-day smoothing of that calculation. As you can see, it has reached the red overbought line. A definitive downside reversal has not yet taken place, but, when it does, the red arrows indicate that some form of correction is likely to follow. A couple have been quite nasty, as per 2018. Alternatively, others have been brief and taken more of a rangebound format, like the spring and fall of 2016. Either way, it may be time for a pause in the ongoing uptrend.
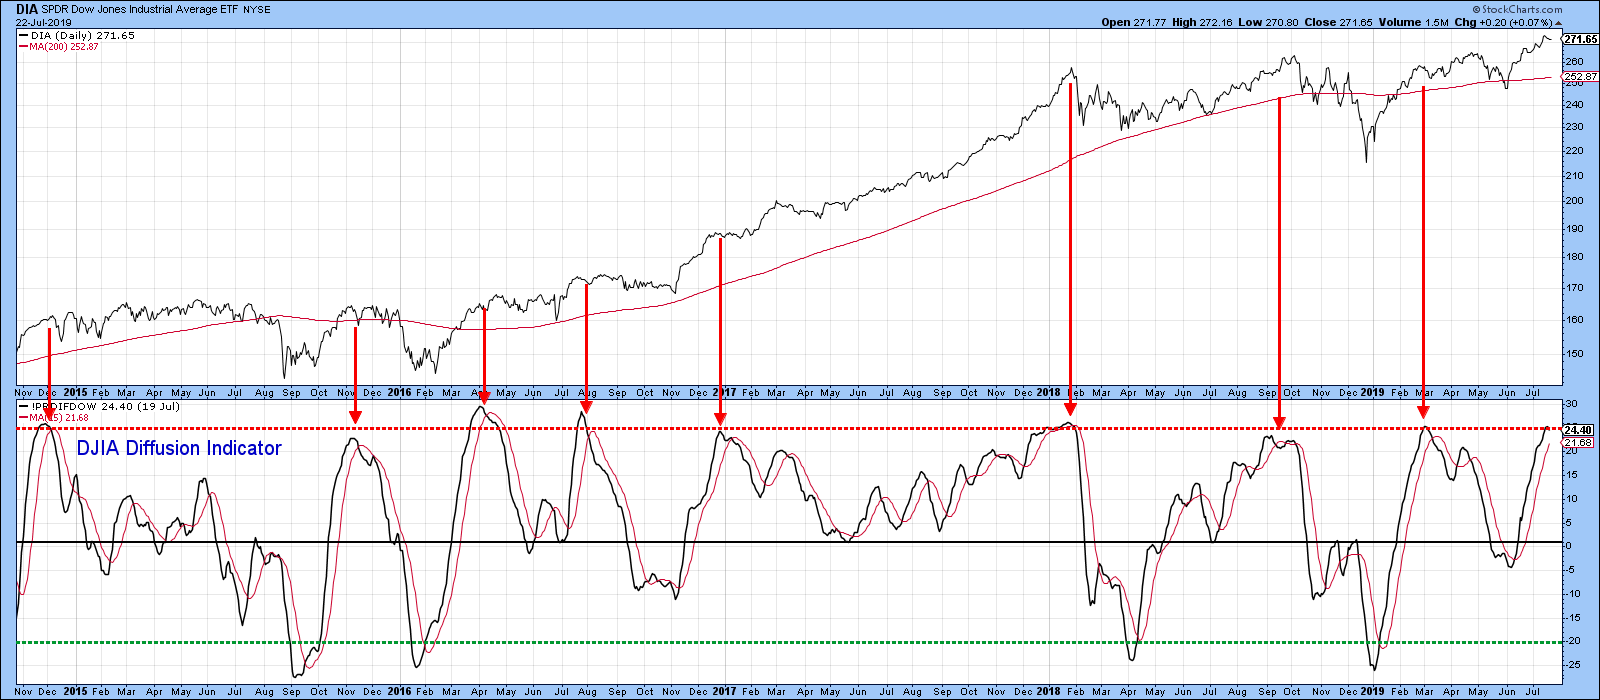
Chart 6
The more broadly-based NYSE stocks above their 50-day MA, in Chart 7, are offering a similar message. In this case, it looks as if the downside reversal is already underway.
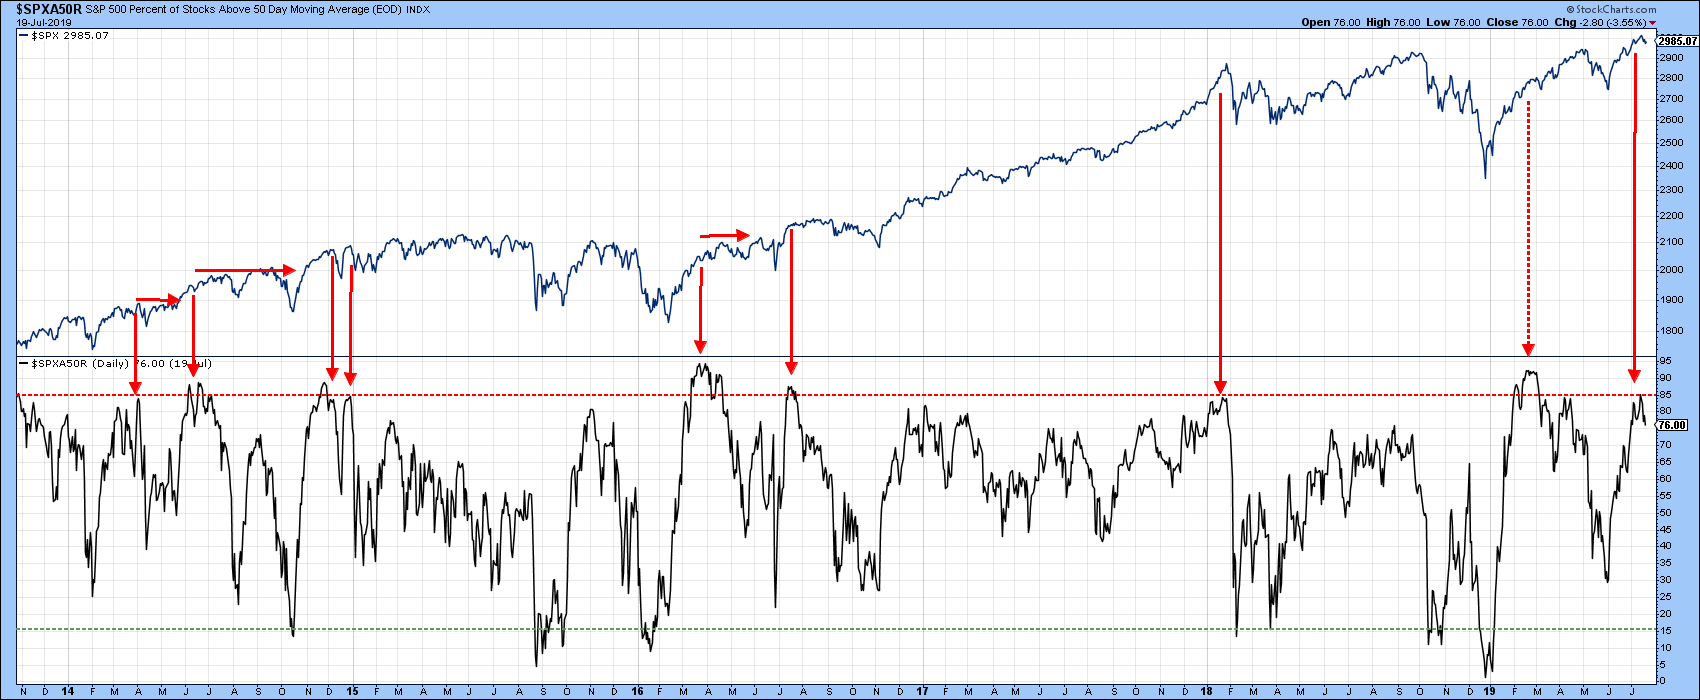
Chart 7
Finally, Chart 8 informs us that the daily KST has just triggered a sell signal, which suggests that that small potential 3-week head-and-shoulders top may well be completed.
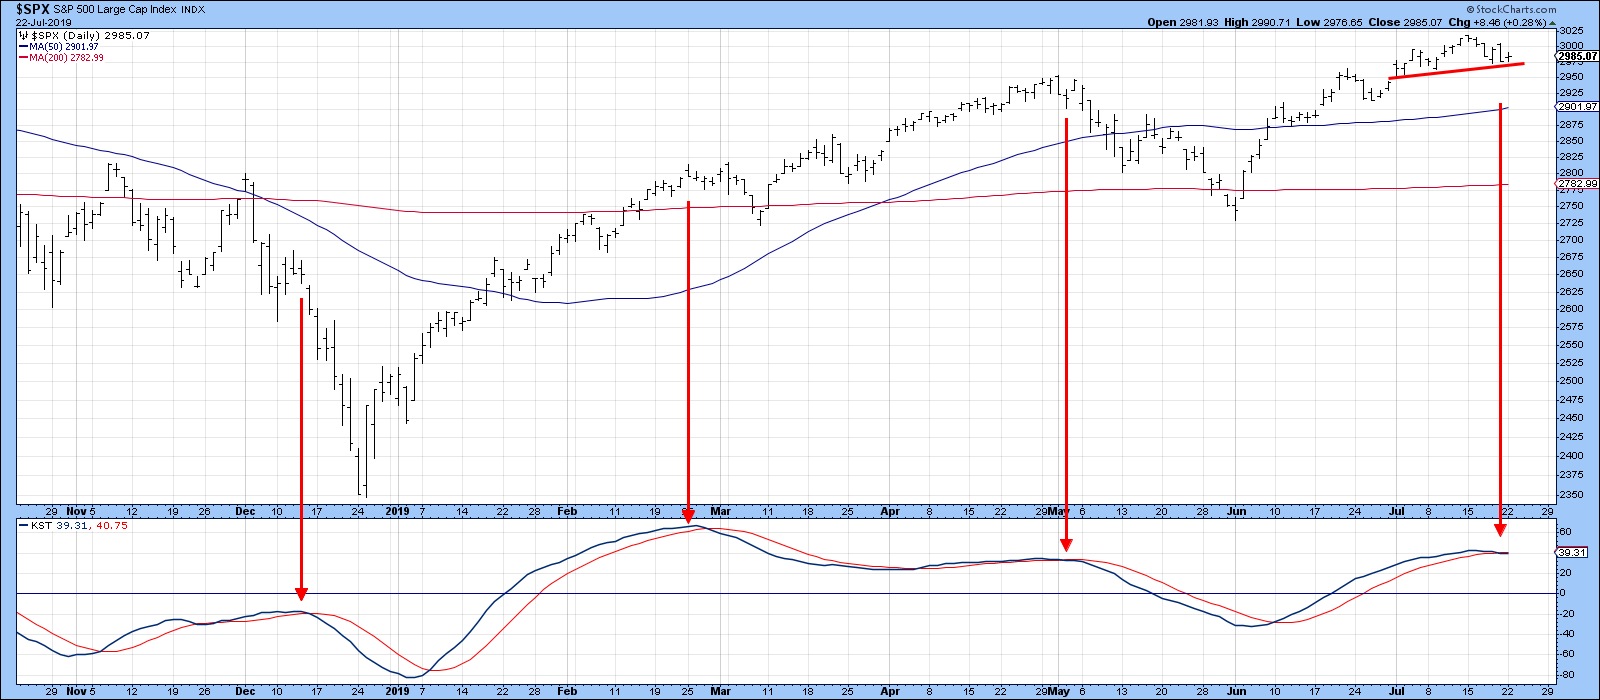
Chart 8
None of these indicators argue for a massive decline. However, they do suggest that if a correction is to materialize, now might be an intelligent place to expect it. That said, the balance of evidence argues in favor of a bullish primary trend, which is what we really should be focusing on. Needless to say, if the highs of those weekly two bar reversals are taken out, that would be very positive, as it would imply that these formations had not “worked” - a typical bull market characteristic.
Good luck and good charting,
Martin J. Pring


