Thinking the Unthinkable - Bonds are Peaking
- Long-Term Bond Oscillators Almost Fully Stretched
- Key Reversal Bars and Other Evidence Suggests Bonds are Exhausted on the Upside
- The Trend is Your Friend.... Until It Isn't
About a month ago, I wrote an article entitled "Bond Yields May Not Be Headed Lower After All". In the intervening weeks, yields have collapsed, so that prognostication could hardly be called prescient. In my defense, I did point out that we needed a short-term trend reversal to confirm the idea of a primary trend reversal. Specifically, I was looking for a daily close in the 5-Year Yield ($FVX) above 1.9%, as such an action would confirm a breakout from an 8-week base. That signal never came. Despite the recent yield drop, it's still possible to make a credible case for a long-term bottom in bond yields.
Long-Term Bond Oscillators Almost Fully Stretched
Firstly, bond yields, as reflected in long-term oscillators, have swung with an almost rhythmic regularity over the last 30 years. Take Chart 1, for instance; the green and red arrows flag reversals from close to, at or beyond the two +/- 40% extreme zones. Once an actual reversal can be established, which isn't always an easy process in real time, the arrows show that this technique has worked pretty consistently since the early 1980s. The two dashed arrows are there to remind us that this is not an exact science.
Right now, the oscillator is pretty overstretched, but has not yet begun to reverse. Consequently, it's not possible to say that another buy signal has been triggered. However, it is sufficiently stretched that the next short-term rally will likely trigger a reversal.
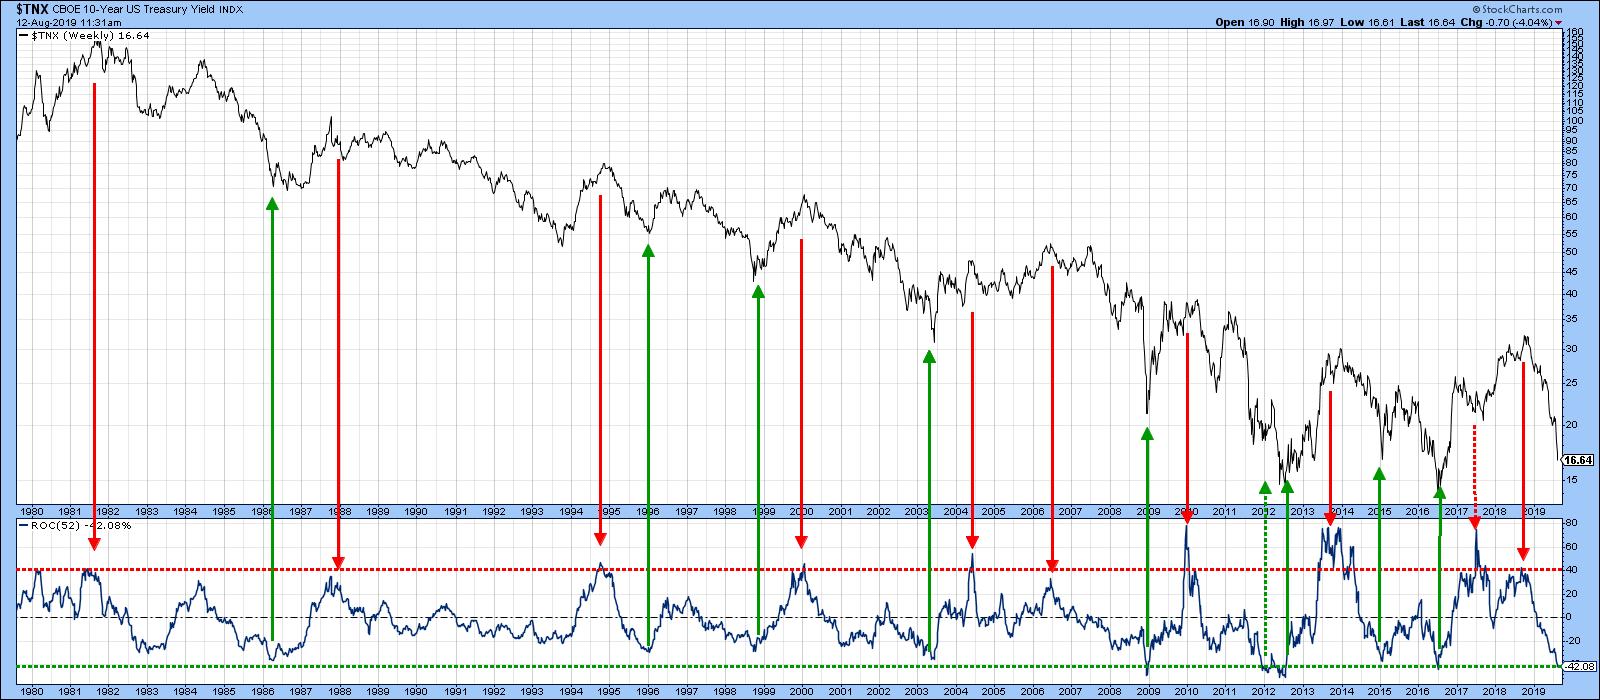
Chart 1
Chart 2 offers a similar approach. In this instance, though, I have substituted the 30-year yield and expanded the oscillator to incorporate a 78-week (18-month) time span. It, too, is overstretched, but it is still in a declining mode.
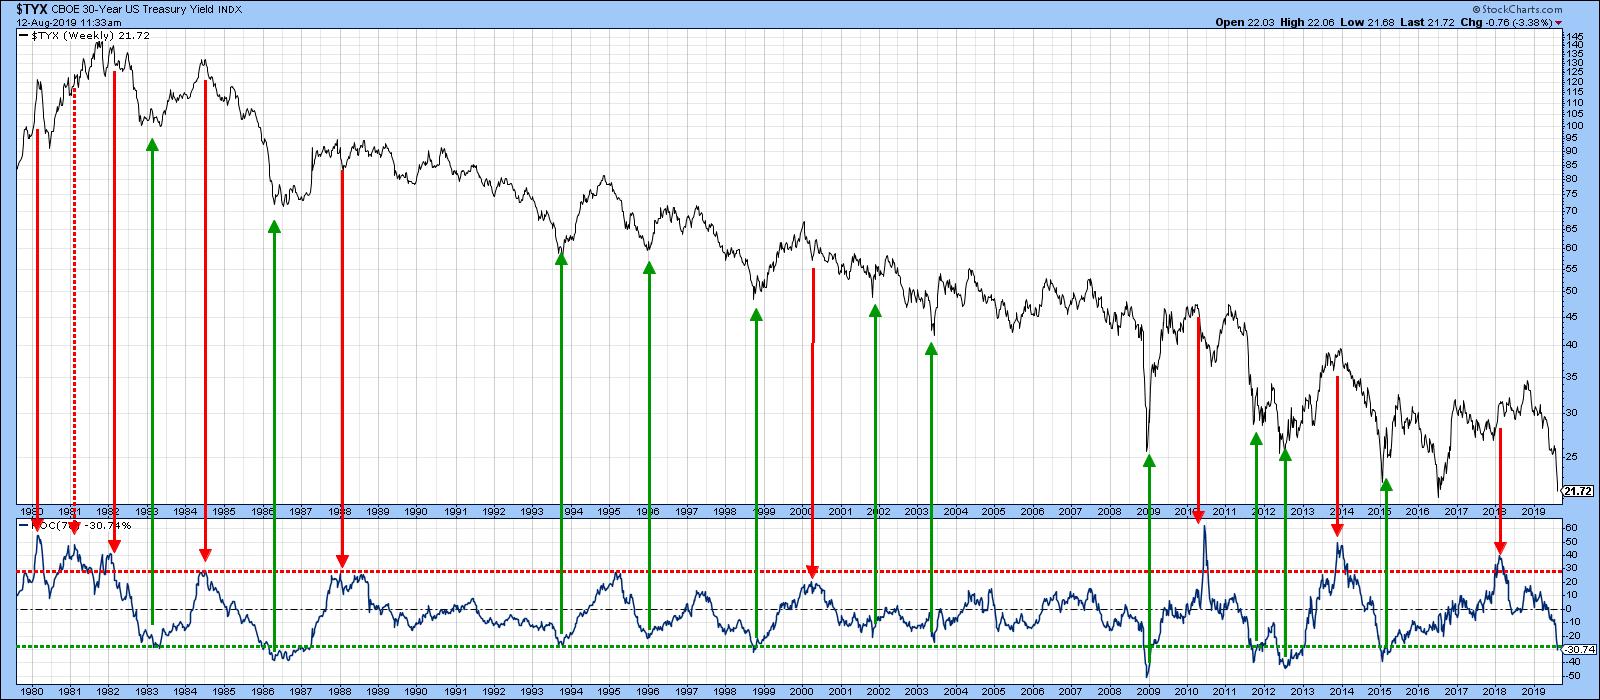
Chart 2
Key Reversal Bars and Other Evidence Suggests Bonds are Exhausted on the Upside
With last week's sharp drop in yields and rally in prices, we are starting to see some strong signs of a reversal. Chart 3 features the iShares 20+ Year Treasury Bond ETF (TLT); I have highlighted the key reversal that took place on Wednesday. A key reversal is a fairly rare phenomenon that is reflective of buyer or seller exhaustion, depending on where it forms in the chart. A bearish reversal develops at the cumulation of a strong and persistent rally, where buyers come into the bar (in this case, a daily session) in a fully optimistic mode. They are so pumped up, in fact, that the opening price experiences a wide gap above the high of the previous day. By the end of the day, though, prices have reversed back to close near the close of the previous day. Thus, virtually everyone who bought during that day is going home with a loss.
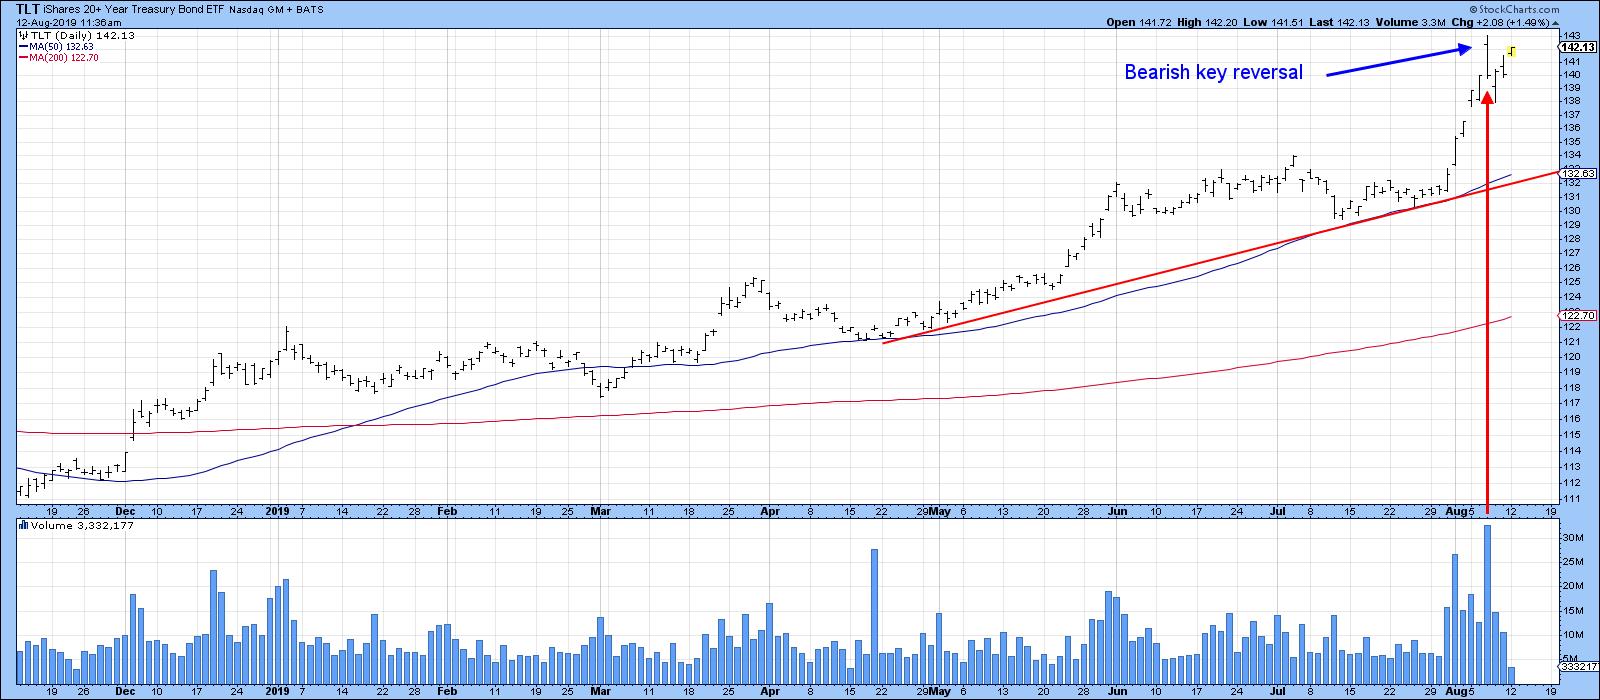
Chart 3
We can give extra marks to a key reversal if it has three characteristics. First, it is preceded by a strong and persistent rally, which established that the bulls were very much in control and that sentiment has reached an extreme. The key reversal is the first sign that there has been a change in the buyer/seller relationship. Second, it should be a very wide day, thereby reflecting a substantial battle between buyers and sellers. The bigger the battle, the more significant the outcome. Finally, heavy volume accompanying the key reversal confirms that a lot of buyers are trapped at higher prices. Last Wednesday's action qualifies on all three fronts in spades. Does that guarantee a downside reversal? No, because there are no guarantees in technical analysis. Technical analysis only deals in probabilities, but the presence of those three characteristics renders those probabilities of a reversal pretty high. Most one- and two-bar price patterns are only expected to have an effect for between 5-10 bars. However, the key bar reversal, due to being rare and developing after a prolonged advance, usually has a far greater impact.
In the last few days the price has rallied back a little, but this has been on lower volume and is typical of a normal retracement move. Only if the high of the key reversal is taken out in a decisive way - and over several days - is it declared invalid. It's important to note that, in many key reversal instances, prices initially decline, but, a week or two later, rally back to (unsuccessfully) test the key reversal high.
Chart 4 puts the volume aspect into greater perspective using the price volume oscillator for the TLT. An overbought PVO can mean one of two things: a buying or selling climax. To differentiate between the two, it's important to study the direction of the preceding price trend. In the examples shown in Chart 4, the green arrows represent selling and the red ones buying climaxes. The current overbought reading represents a buying climax, which would normally be followed by some range-bound action or, more likely, a decline.
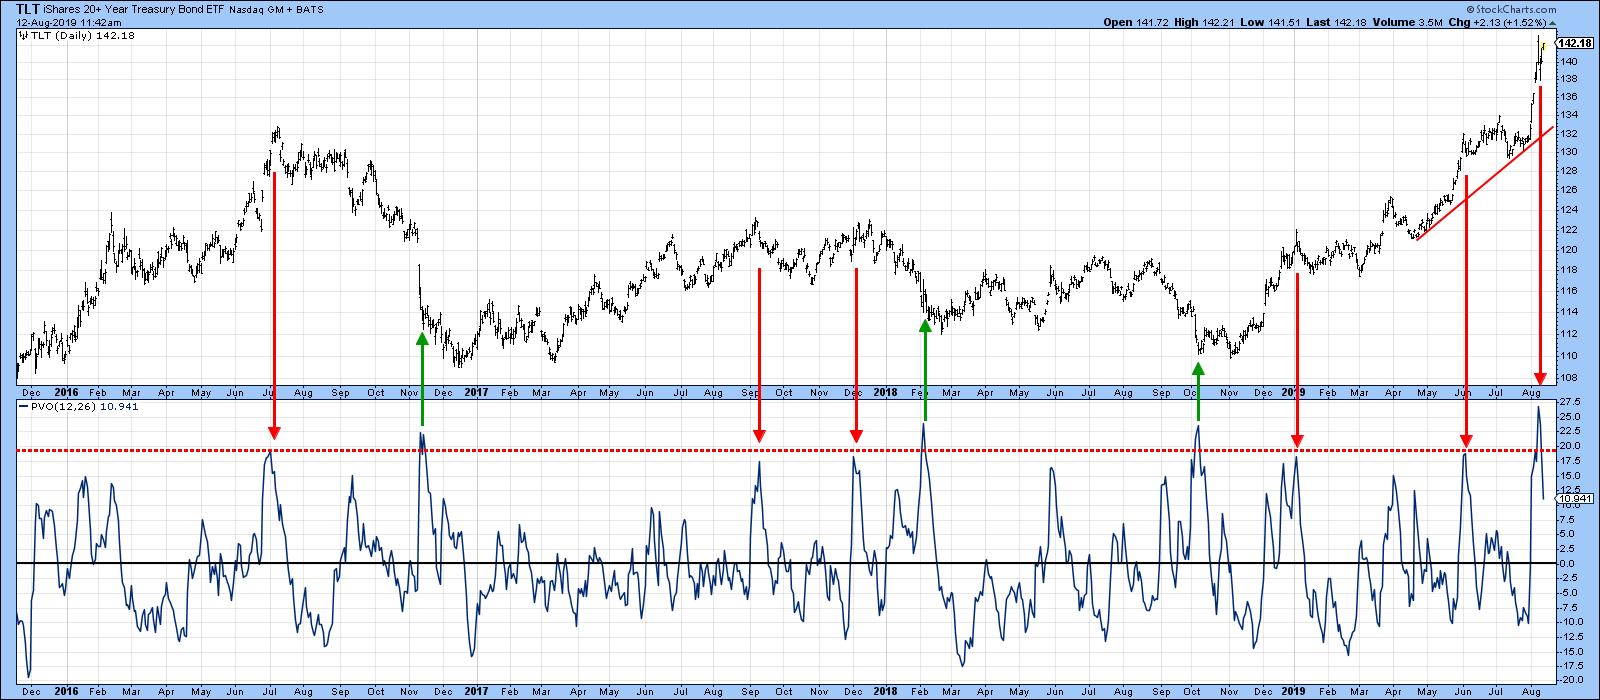
Chart 4
Chart 5 compares the iShares 7-10 Year Treasury Bond ETF (IEF) with my bond net new high indicator. Note that the latest high in the price itself has yet to be confirmed by the indicator. A reversal in this series from a high level does not guarantee a reversal in the ETF, but, when the current rally runs its course as seems likely, that would be the fourth sell signal in 9 months. Four hits in a row does not sound that positive to me.
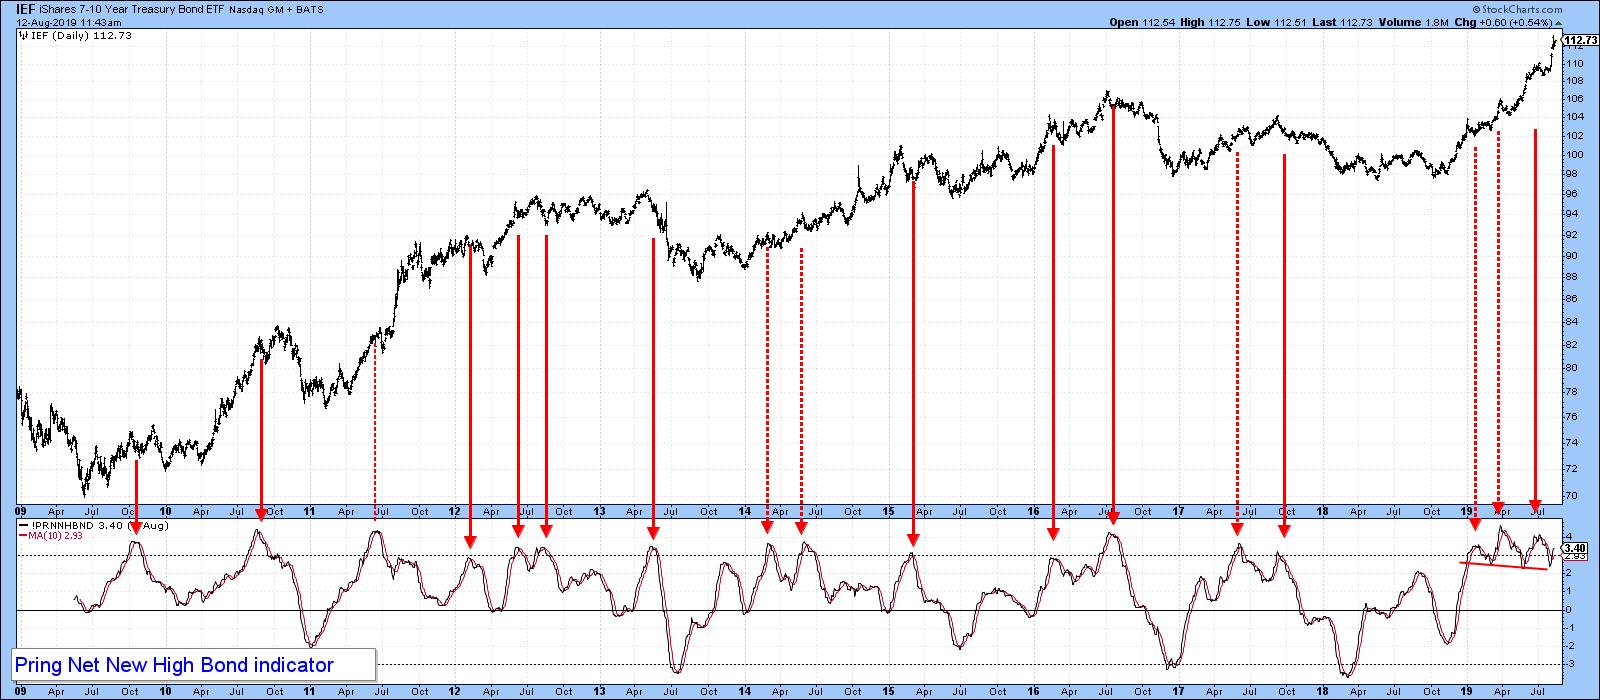
Chart 5
The Trend is Your Friend.... Until It Isn't
The evidence I have presented has been confined to momentum and price characteristics. Whilst powerful, we still need some actual trend reversal evidence, which could be some ways away.
In terms of the 5-year yield, Chart 5 shows that we are still looking for a decisive break above the dashed trend line, say, at 1.9%.
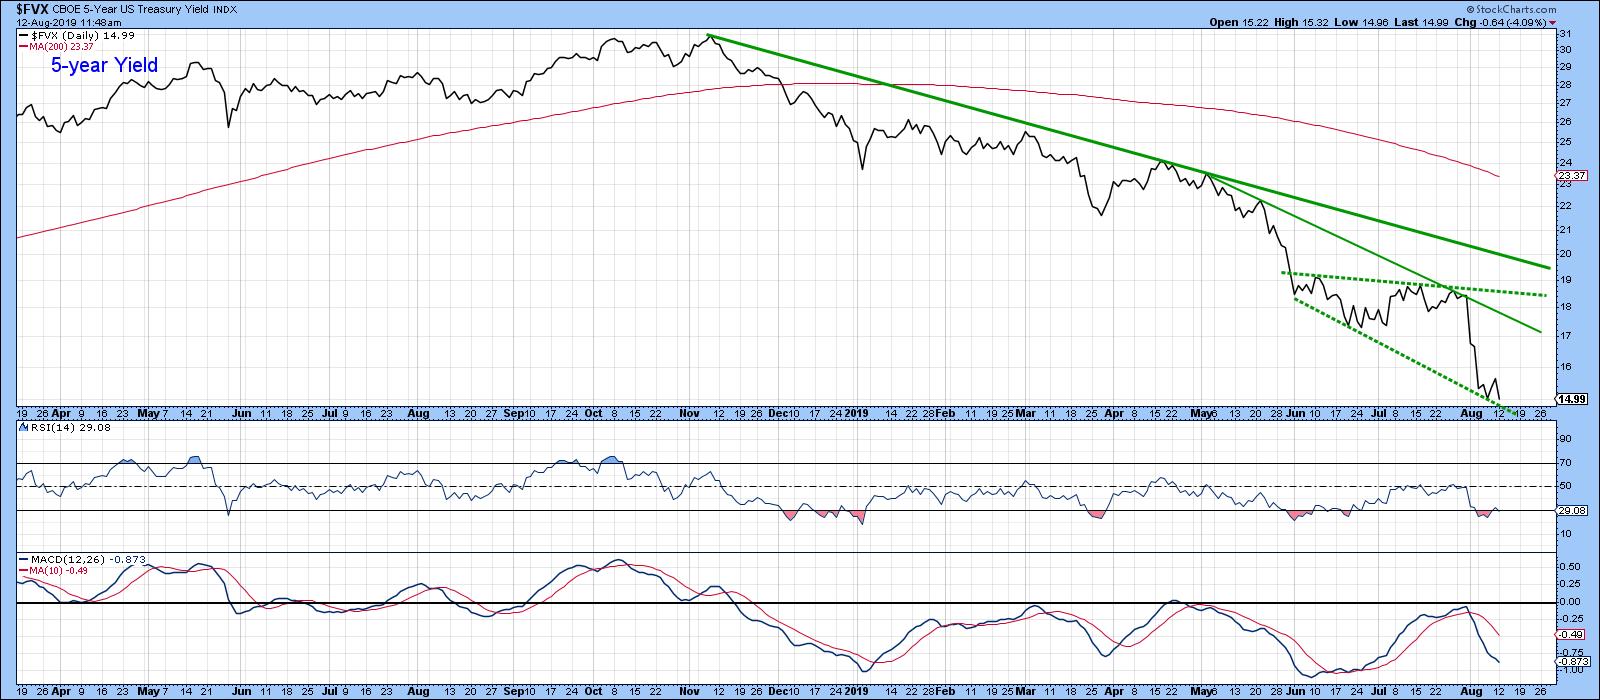
Chart 6
Using the iShares Aggregate Bond ETF (AGG), the required break would be at $111. That line is rising at just under 50¢ per week.
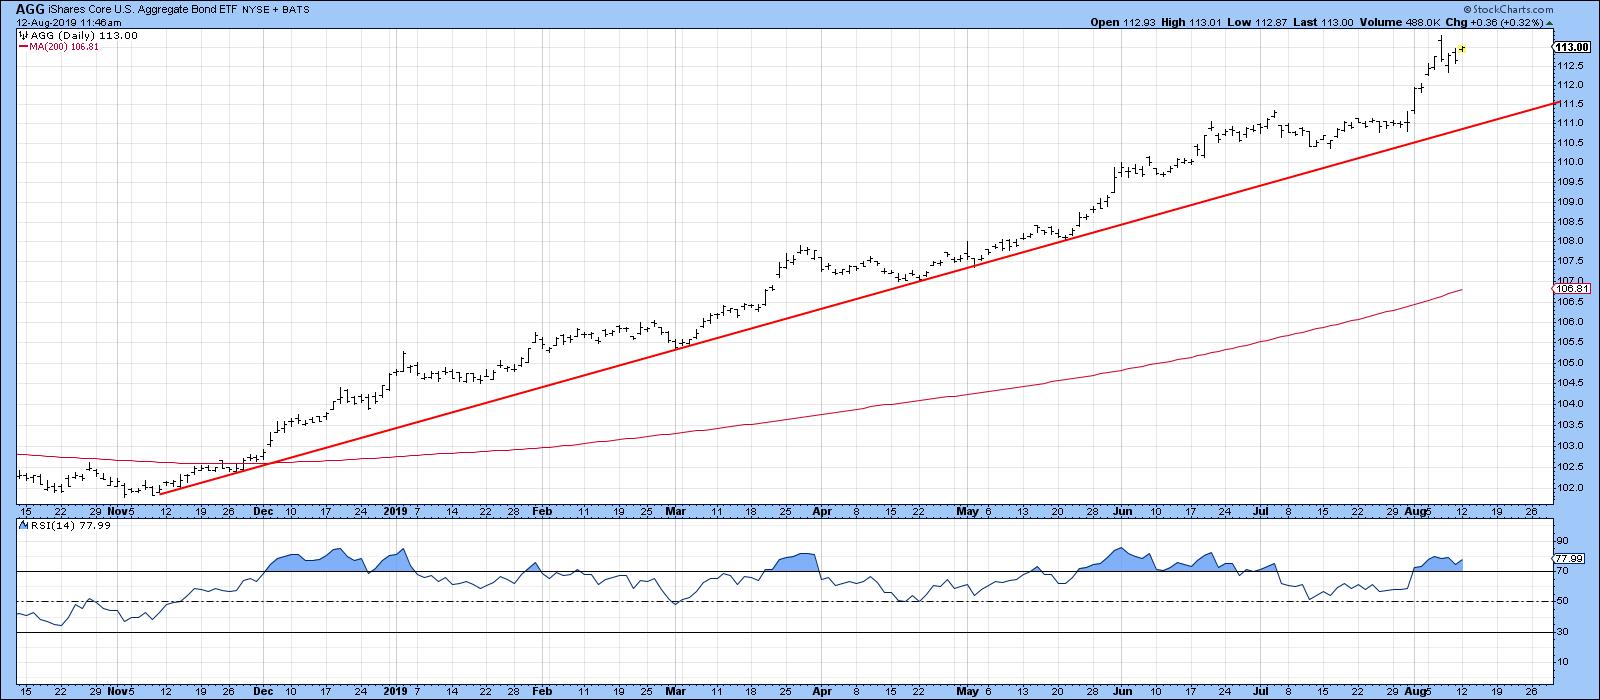
Chart 7
Good luck and good charting,
Martin J. Pring
The views expressed in this article are those of the author and do not necessarily reflect the position or opinion of Pring Turner Capital Groupof Walnut Creek or its affiliates.


