It's Time To Watch For A Bottom In Commodities
- The Markets and the Business Cycle
- Using Other Markets to Forecast Commodities
The Markets and the Business Cycle
In my Monthly Market Roundup last week, I repeated a talk that I recently gave at the CMT Summit in Mumbai. The talk in question began with an outline of the approach we take at Pring Turner for our sub-advisory services and in the Intermarket Review, my monthly publication that analyses the the US and world markets from a long-term technical point of view. Figure 1, which portrays the growth path of the economy, sets the scene by pointing out that most US business cycles go through a set series of chronological events, as well as that the primary trend turning points of bonds, stocks and commodities fall into that sequential approach. We use this approach as a road map to help determine where we are in the cycle. In that way, we can optimize our asset allocations to favor bonds and interest sensitive equities at the start of the cycle and inflation-sensitive sectors as the cycle matures.
The sequence begins during a recession, when the Fed is adding liquidity to the system. This causes rates to peak and bond prices to bottom. Later, the players in the stock market begin to realize that lower rates will result in a recovery, so they start buying equities in anticipation of it. Then, when the economy does perk up, commodities bottom, so now all three markets are in a rising phase.
All good parties must come to an end, which means a peak in bond prices as credit demands pick up and the Fed is less accommodative. Rates may be rising, but profits are improving faster, so stocks continue to advance until they eventually begin to anticipate the next recession by entering a bear phase. Finally, commodities peak and the cycle begins again. Virtually all of my long-term indicators, including my consensus Bond, Stock and Commodity models are indicating that the current cycle is in the green-shaded rectangle. With bonds and stocks both in a primary bull market, the next event on the calendar to look for is a low in commodities.
"But wait," I hear you saying, "how can that be, as we are not coming out of a recession?"
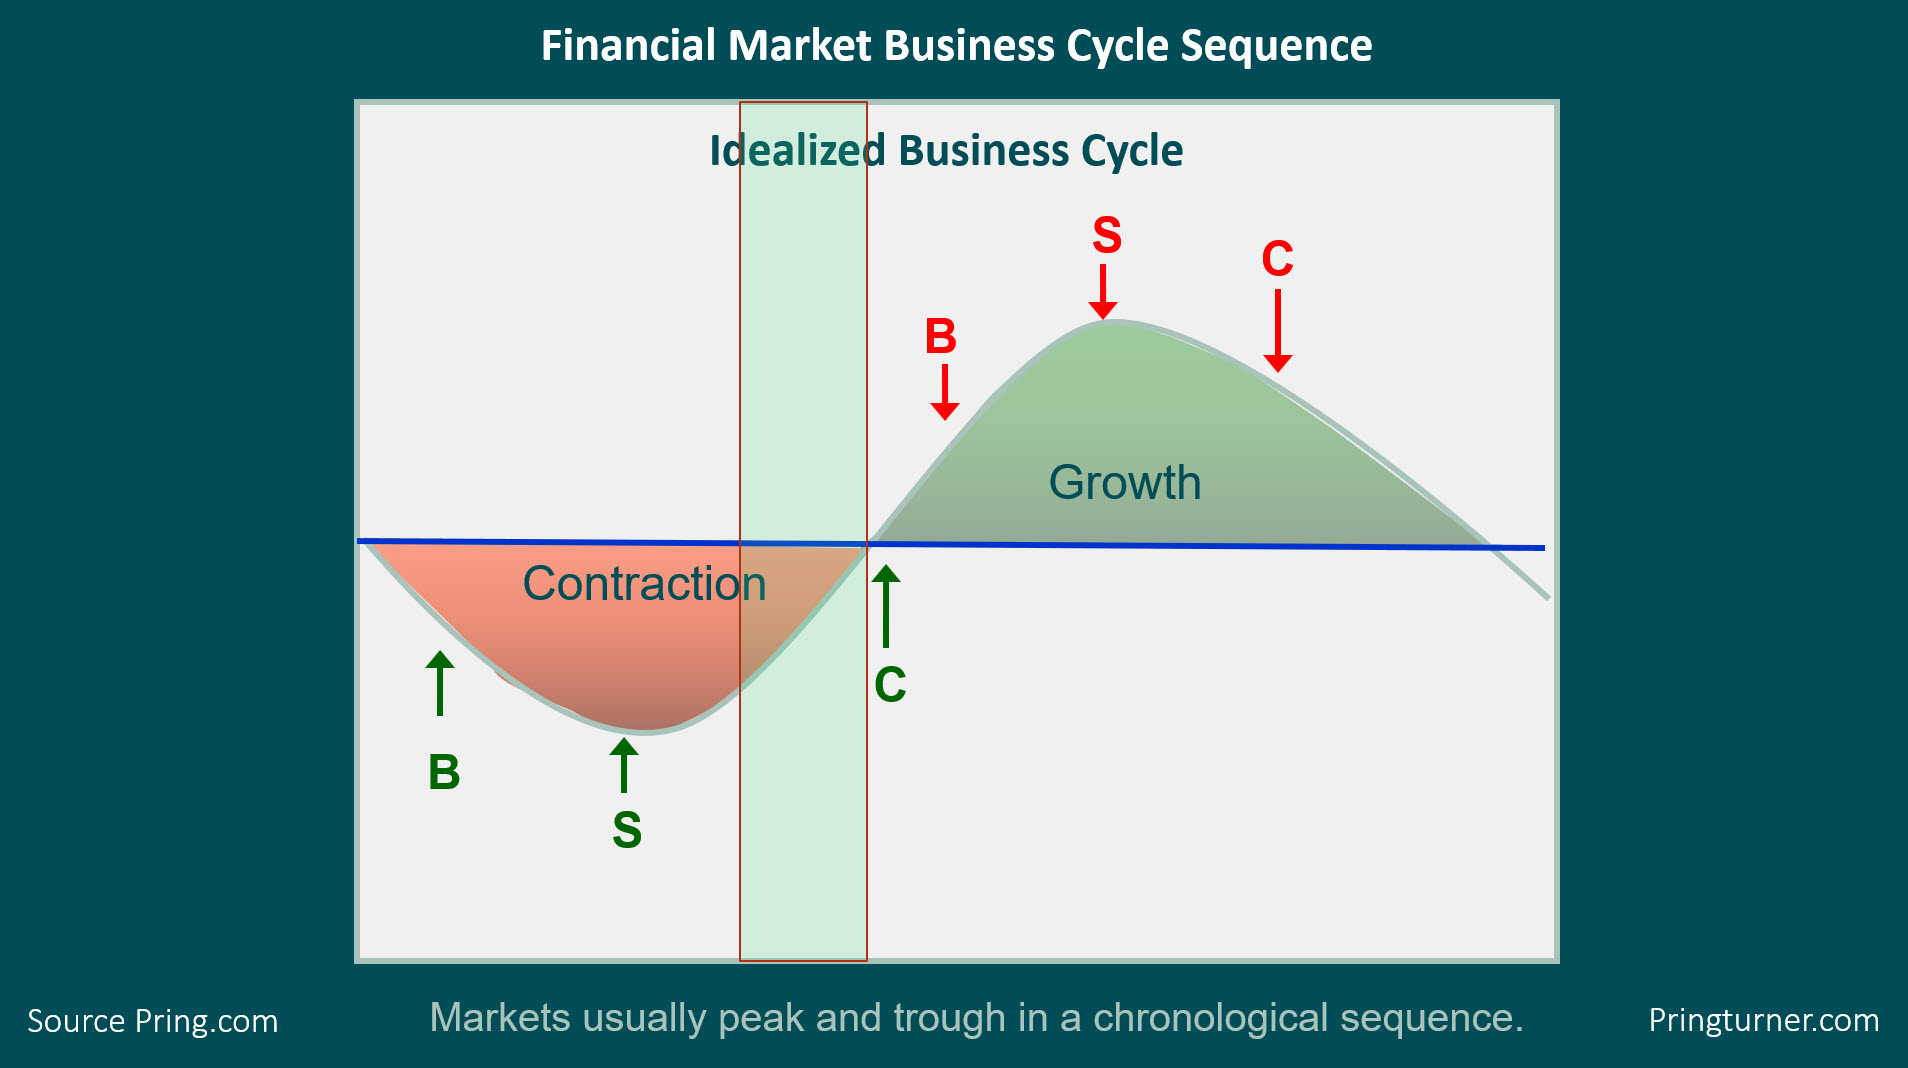
Figure 1
The answer is that, since 1960, there have been just as many slowdowns as recessions. Slowdowns develop when the growth rate of the economy declines (without seriously dropping below zero) but the sequential bond/stock/commodity relationship remains valid. The major difference is that the magnitude of equity and commodity bull markets is far lower. This concept is featured in Figure 2. My estimate, based on the trajectory of several long-term indicators, is that we are currently around the position of the green arrow. If that's the case, that elusive bear market bottom in commodities may not be far away.
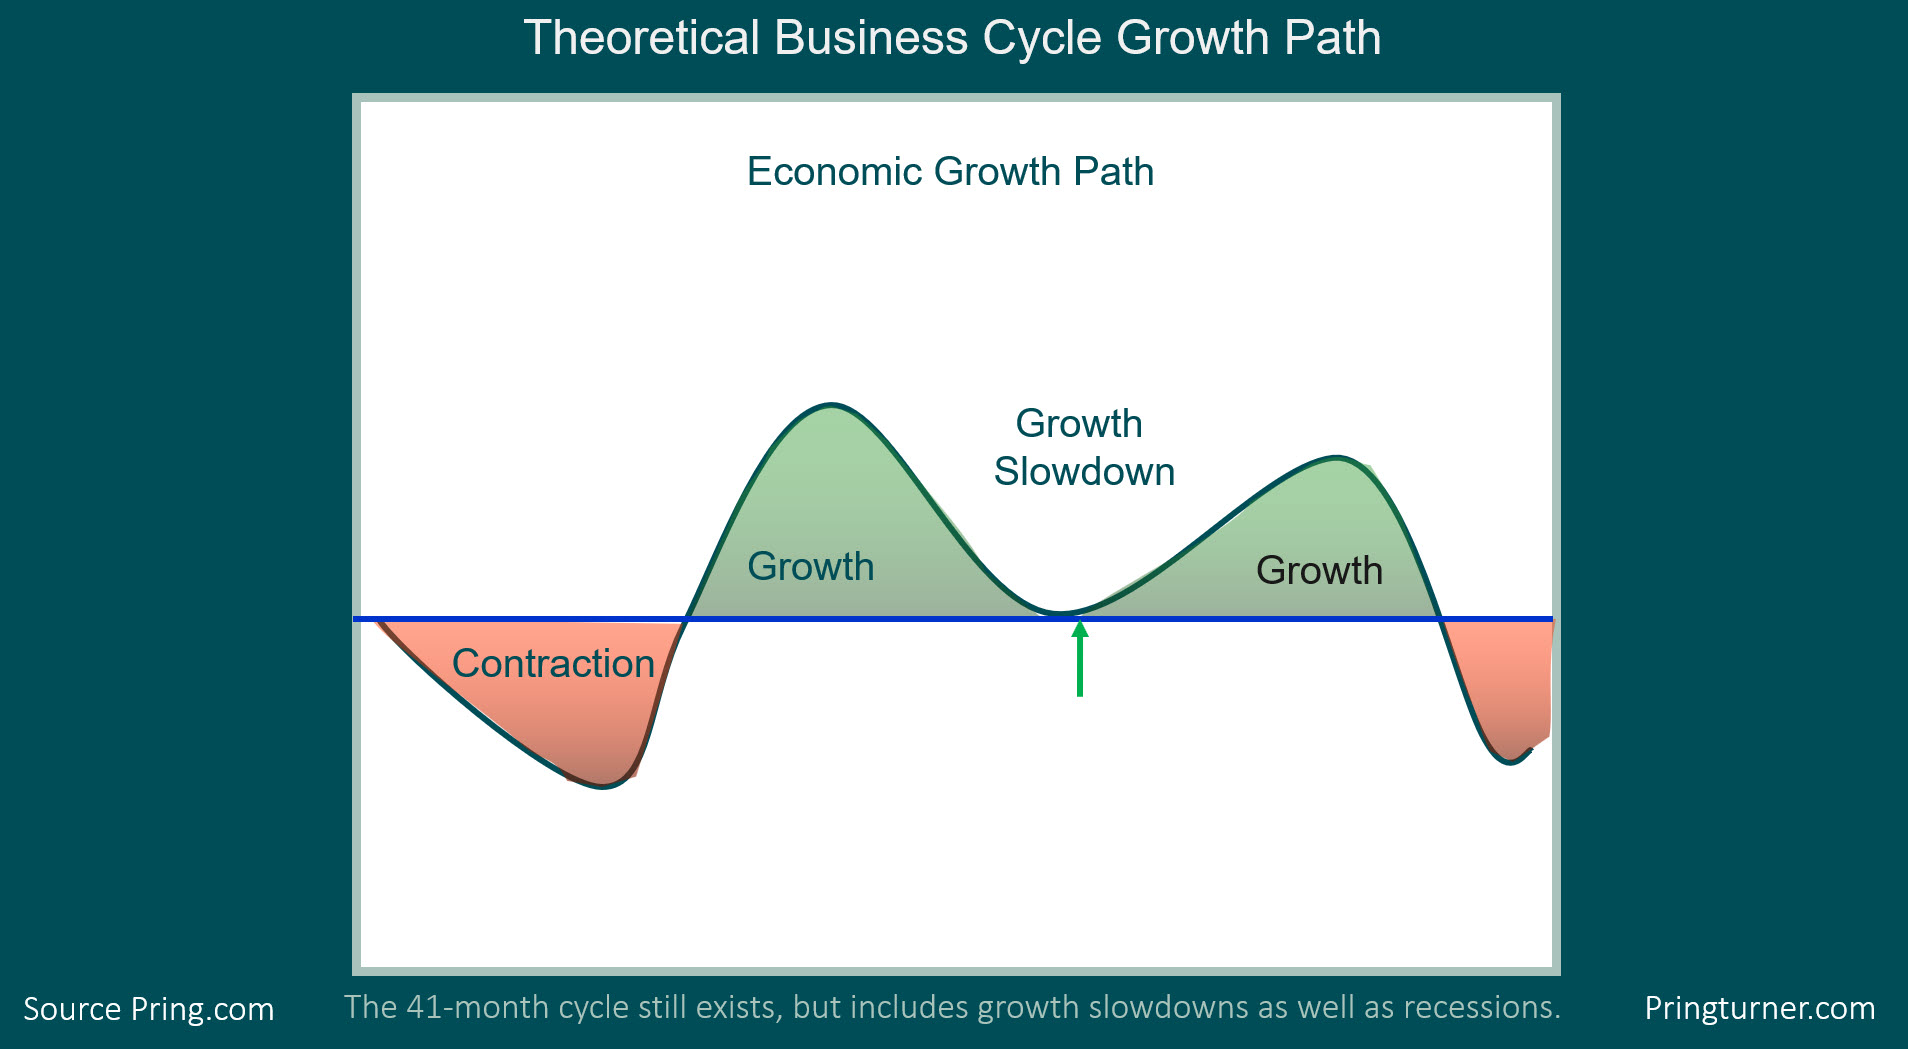
Figure 2
Using Other Markets to Forecast Commodities
The CRB Composite is featured in Chart 1. It made its bottom in 2016 as the previous slowdown was coming to a close. The subsequent recovery into 2018 did not have the usual positive effect on prices. However, it's also accurate to say that the slowdown since then has not had the same disastrous results as the 2014-16 slowdown. The possibility always exists that the trading range will be resolved on the downside, but that seems inconsistent with a stock market that appears to be discounting an end to the slowdown. The key will be to see if the Index can move decisively above its green downtrend line with a month-end close above 190.
I am also watching the stock and bond markets, as they get to (indirectly) vote on where they think commodities are headed. Our stock measure is plotted in the lower windows in the form of the Inflation/Deflation (!PRII/!PRDI) ratio and its long-term KST. This series is calculated by dividing a number of industry groups that do well when commodities, such as resource stocks, are running by a similar index comprising defensive and interest-sensitive stocks. The slanting arrows show that it has a tendency to lead commodities themselves. Note that its long-term KST is very close to crossing above its MA for a bull signal.

Chart 1
Chart 2 compares this relationship to the DB Commodity ETF (DBC). In addition, we have another stock market ratio that acts as a crosscheck, which is the ratio between The Goldman Sachs Natural Resource ETF (IGE) and the SPDR Consumer Staples (XLP). It too tracks the DBC quite well. What is interesting is that all three series are currently resting at important downtrend lines, the violation of which would likely tip that long-term balance in the previous chart.

Chart 2
The bond market has its say in the form of the ratio between the iBoxx High Yield ETF (HYG) and the iShares 7-10-year Treasury ETF (IEF). The latter is a credit spread that closely tracks the CRB Composite, as flagged by the arrows. The reason is that this relationship reflects confidence (or lack thereof) in the economy, and its fluctuations in business activity influence commodity prices. The ratio recently broke below the red neckline of a bearish head-and-shoulders, but it has since pulled back. It's not totally out of the woods yet, but it would not take much for it to join the CRB above its green 2019 dashed downtrend line. You can see that we are getting to a situation whereby a breakout in commodities would likely be confirmed by internal relationships in both the stock and bond markets.

Chart 3
Chart 4 shows the recent daily action for the CRB itself. A break above the green trend line (at around 182) would signal the completion of a large bullish inverse head-and-shoulders. If that happens, that would act as a kind of reverse first domino to tip the intermediate and long-term technical positions into a bullish mode. Such an event seems likely, as the PPO has started to turn to the upside. Moreover, it seems as though the Index itself experienced a false break below a head-and-shoulders neckline and is now back above its 200-day MA. Whipsaws are often followed by above-average price moves, which could well take place.

Chart 4
In this period of Cyber Monday and Black Friday sales, I would be remiss if I did not point out that we at Pring.com currently have a special on our already discounted Intermarket Review 3-month trial, provided you use the code "Trader1".
Good luck and good charting
Martin J. Pring
The views expressed in this article are those of the author and do not necessarily reflect the position or opinion of Pring Turner Capital Groupof Walnut Creek or its affiliates.


