Stocks are Overdue for a Correction, But These Charts Say It Doesn't Matter
- Confidence is Breaking Out All Over
- Alternative Risk Relationships are Starting to Get Riskier
Right now, stocks are very overextended and likely due for a correction. In Chart 1, for instance, you can see that my Global Diffusion indicator has just triggered a sell signal from an extreme level. The solid red arrows show that the MSCI World Stock ETF (ACWI) has usually responded to such an event with a sell-off. However, the dashed ones tell a different story. That's because they were triggered during a strong bull market. Indeed, the price has so far failed to respond in a negative way to the most recent signal. That suggests that the current advance is packing a lot of upside momentum and that the short-term indicators will continue to thumb their noses at such bearish technical events. In my experience, that's a typical characteristic of a powerful young bull market. The first sell signal triggered in the chart in the spring of 2016 is a classic example. These failed bearish signals are the exception, rather than the rule, but there are several other charts that suggest this bull has only just begun.
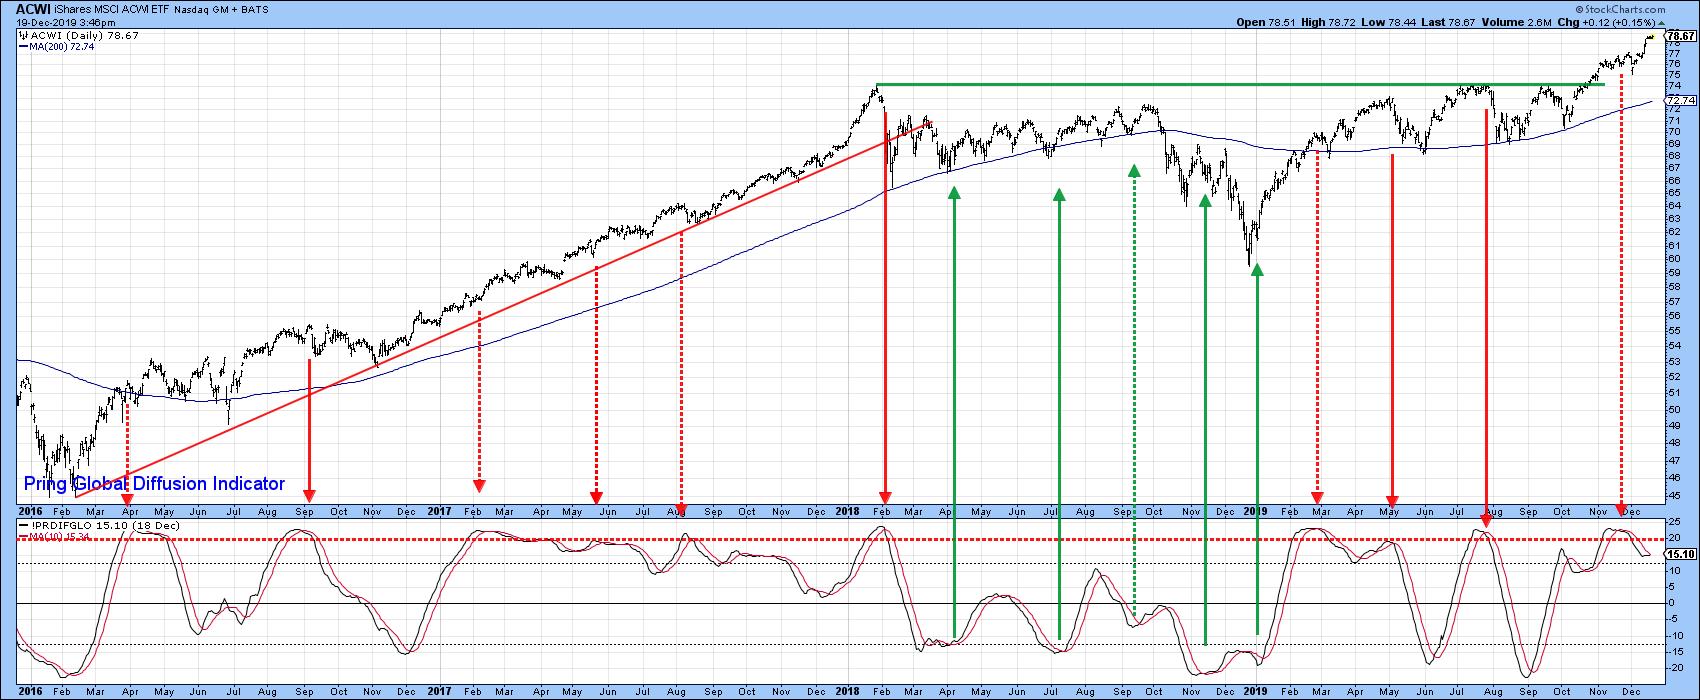
Chart 1
Most of these indicators come from an improvement in the trend of several of my confidence indicators that I actively follow in my monthly Intermarket Reviewand as strategist forPring Turner Capital. Let's take a closer look.
Confidence is Breaking Out All Over
Technicians closely follow sentiment indicators in order to have a better understanding of what the crowd may be thinking. Generally speaking, this data is used from a contrarian aspect, as most groups of investors are usually wrong at major turning points. An alternative is to monitor not what people say they are but what they are actually doing. In this respect, it is possible to come up with relationships that act as a proxy for such swings in confidence.
One possibility is to compare the performance of a risky item with one that is far more defensive. An example might be the ratio between the S&P High Beta to the S&P High Quality stocks. The two ETF symbols are SPHB and SPHQ, as plotted in Chart 2. It is apparent that confidence, as monitored by this relationship, peaked in 2018 and has been slowly deteriorating since. In the latest sessions, though, the ratio has violated its 2018-2019 downtrend line and 200-Day MA, suggesting that it is headed higher. In other words, a new trend favoring the more risky high beta stocks is underway. The current setup looks to be similar (and actually stronger) than that indicated by the two trend line breaks in late 2017. There is one other important takeaway from the chart, which lies with the fact that while the S&P has been making its way higher since the soring of 2018, this confidence ratio has not. That's not a good sign from a long-term point of view, but there is always the hope that it might get cleared up as we move forward. Since the current indicated trend is up, I am not currently worried about this potential discrepancy. However, if down the road the ratio fails to confirm the new high in the Index, that will be the time to become concerned.
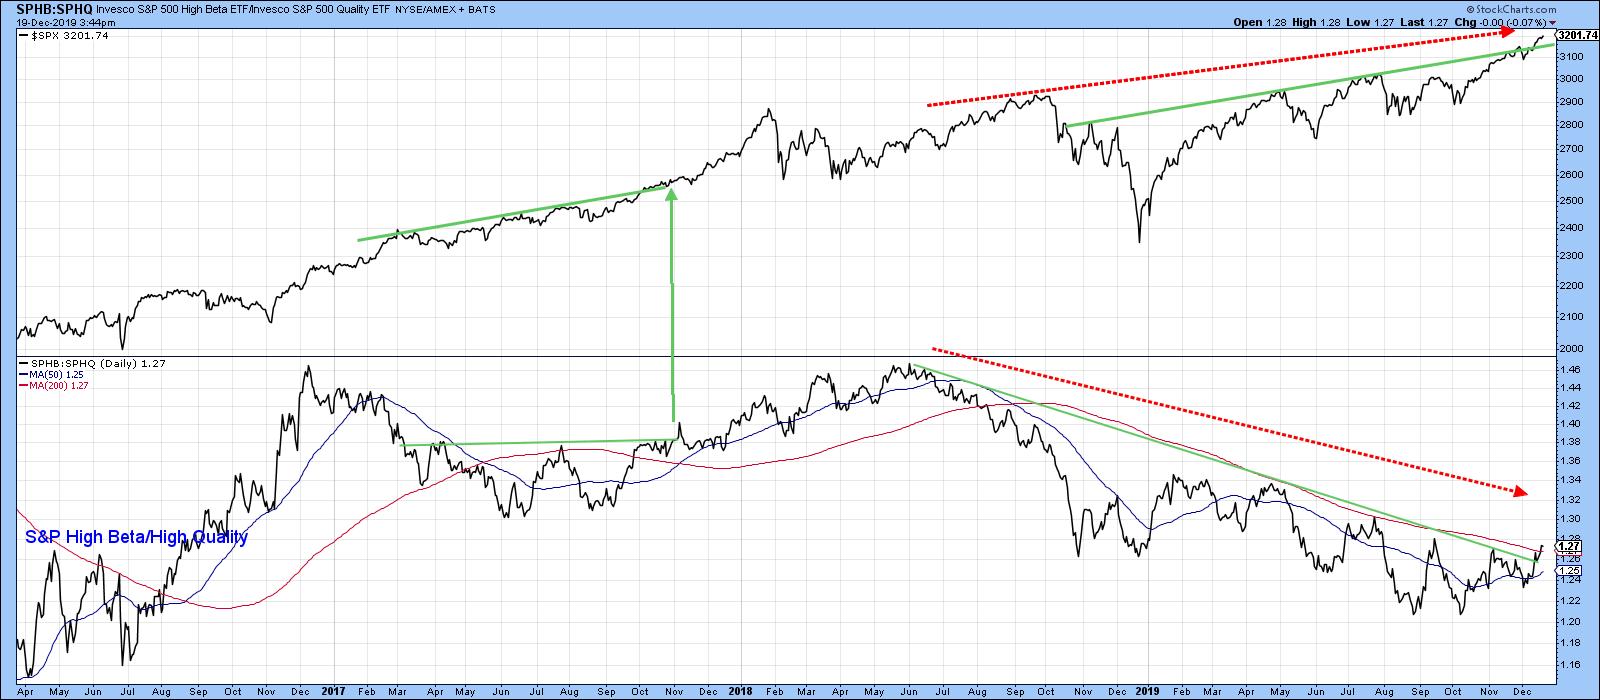
Chart 2
Swings in confidence also show up in the bond market in the form of credit spreads. In Chart 3, for instance, the SPX is compared to the ratio between the iBoxx High Yield Corporate and the iShares 7-10-year Treasury Bond ETF (HYG/IEF). Note that both series have been plotted using the underscore. In that way, interest and dividends are excluded from the calculation. Once again, the two thick dashed red arrows are pointing up the potential for a large negative divergence, as we saw in the previous chart. However, the ratio itself has completed a base, broken above its 2018-19 downtrend line, and has also managed to clear its 200-day MA. More importantly, the Special K has violated its 2018-19 down trend line. All these factors suggest that a major uptrend in this confidence relationship is underway.
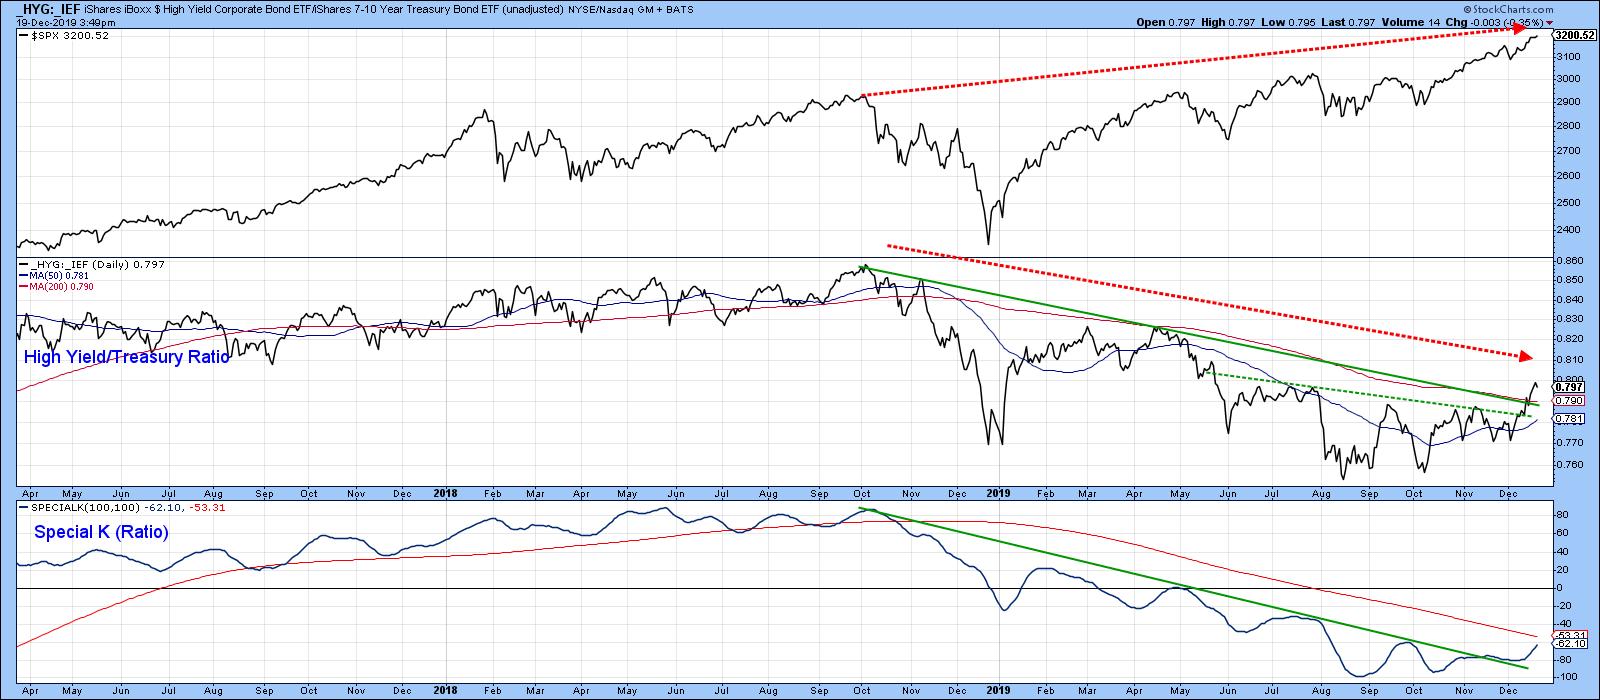
Chart 3
Finally, Chart 4 compares another risky bond ETF with a safer one. This time, though, the relationship is a global one in the form of the iShares International High Yield with the Barclays International Treasury (_HYXU/_BWX). This relationship is being compared to the Dow Jones World Stock Index. As with the US-based ratios, we see a long-term negative divergence with the two red dashed arrows. However, the ratio itself has just completed a base and is experiencing a bullish short-term KST. Given its close short-term correlation with the Index, I am expecting this breakout to result in higher global equities in the first quarter of 2020.
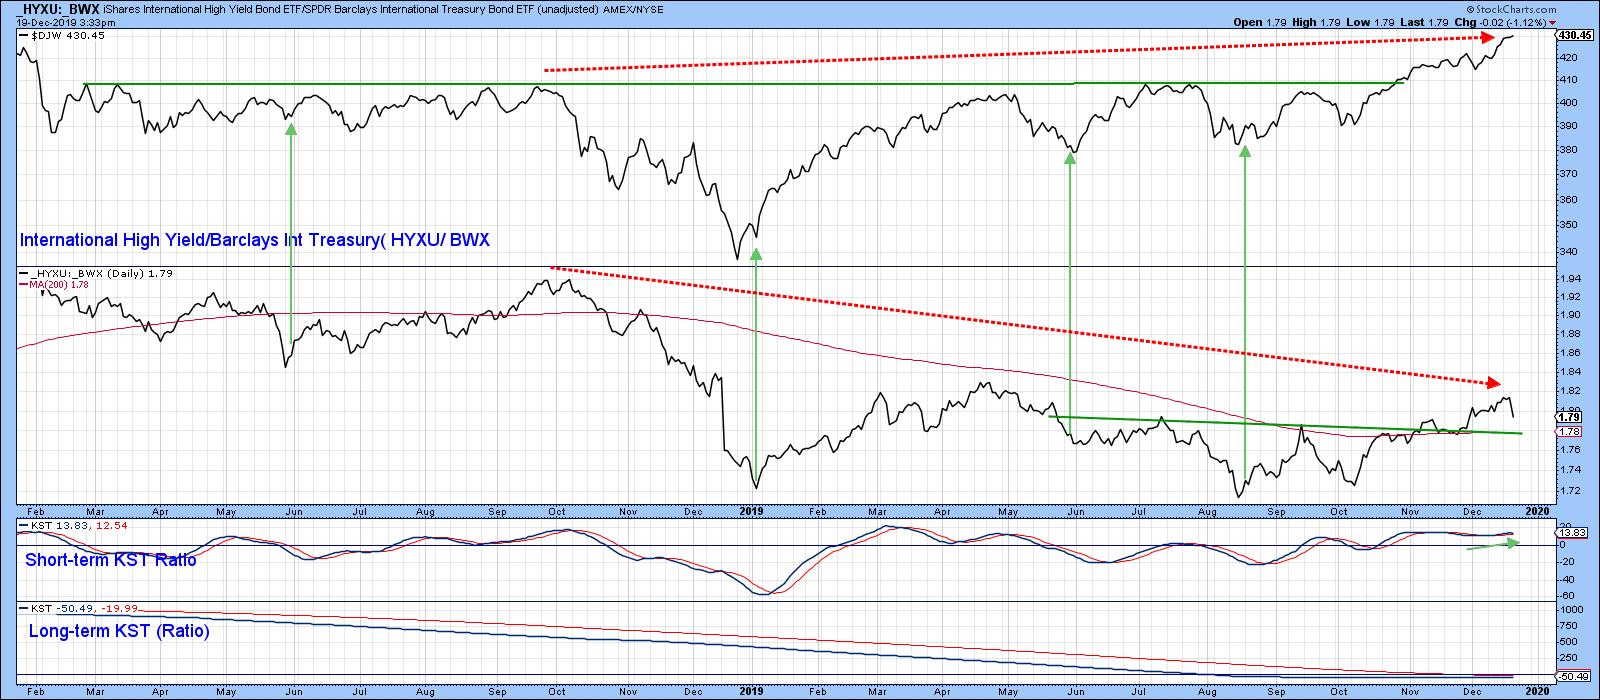
Chart 4
Alternative Risk Relationships are Starting to Get Riskier
Charts 5 and 6 feature two more relationships; this time, they more aptly fit into the inflation/deflation category. Chart 5 compares the DB Commodity ETF with the iShares 20-year + Bond ETF, (DBC/TLT), arguably the ultimate inflation/deflation relationship. This series has completed a large base and looks headed higher. That suggests higher-risk commodities have begun a trend of superior performance against bonds.
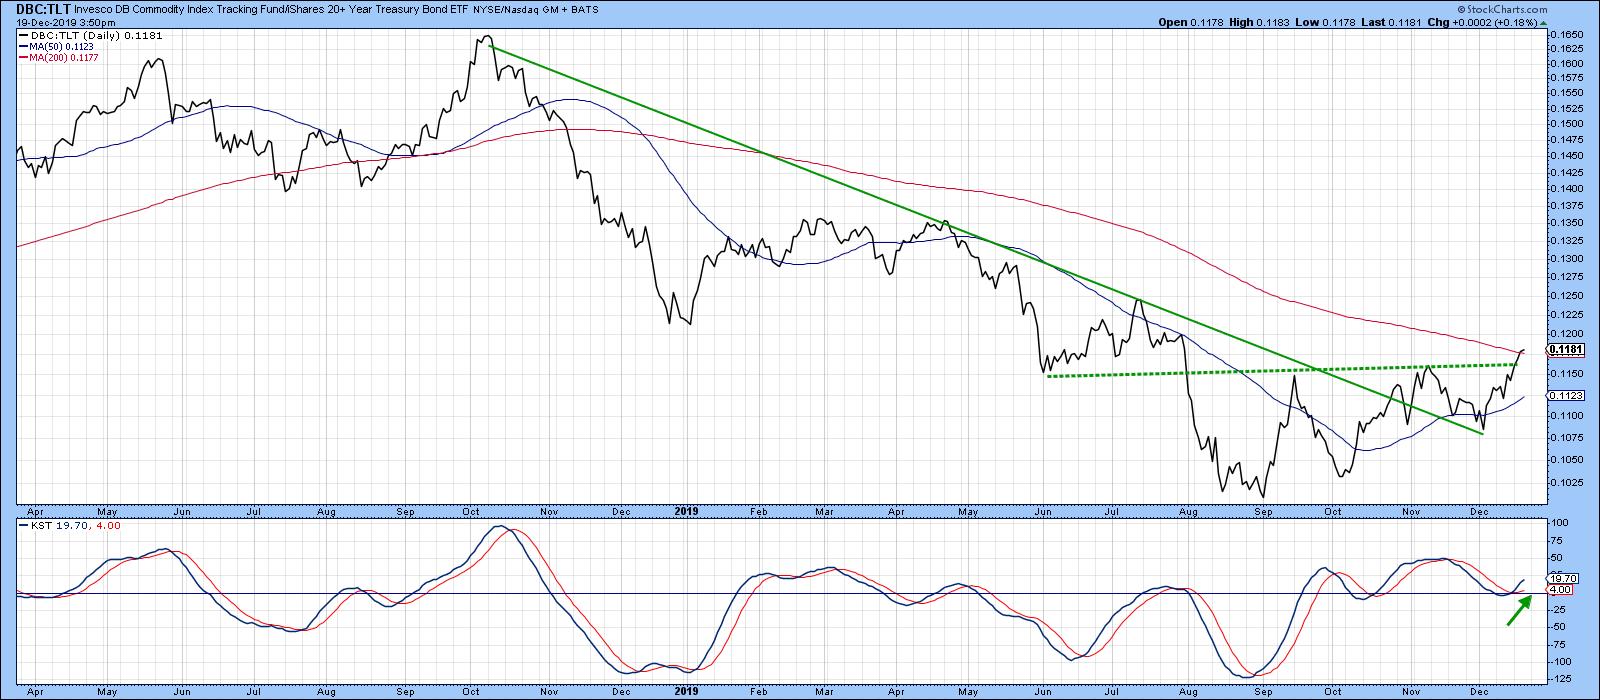
Chart 5
Chart 6, on the other hand, shows the IGE/XLP relationship, comparing the Goldman Sachs Natural Resource with the SPDR Consumer Staples ETF. A rising ratio indicates an inflationary (higher risk) environment as the IGE outperforms its defensive counterpart, while a falling one reflects shrinking confidence. This relationship has also broken to the upside and offers a similar message to Chart 5.
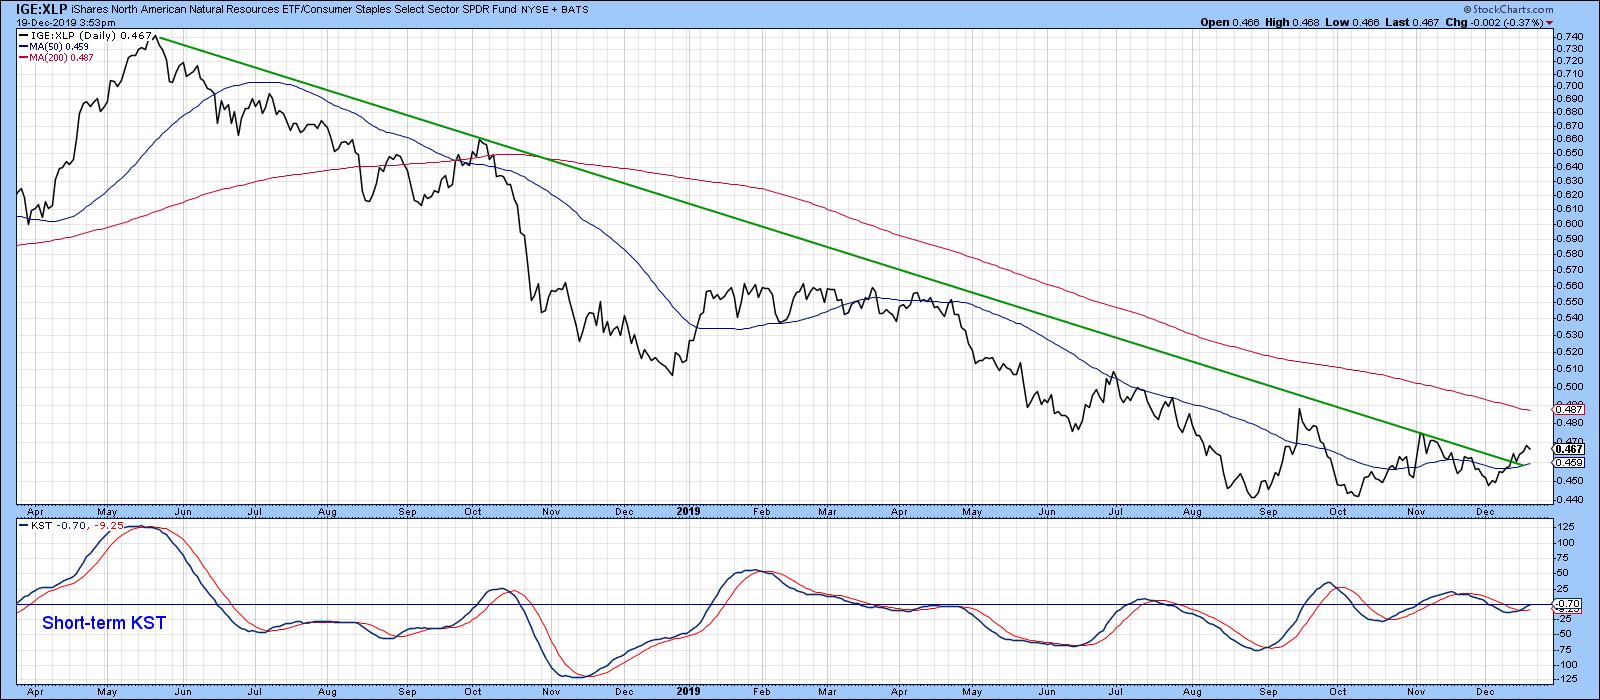
Chart 6
Taken together, these charts suggest that a trend of greater risk-taking has begun. Put another way, this bull market is likely to become more speculative. There is nothing wrong with that as long as you recognize that all good speculative parties eventually come to an end. The trick is to hail a cab to take you home before that party comes to a crashing halt. In the meantime, enjoy it for all its worth.
Good luck, good charting and Happy Christmas,
Martin J. Pring
The views expressed in this article are those of the author and do not necessarily reflect the position or opinion of Pring Turner Capital Groupof Walnut Creek or its affiliates.


