Dollar Hits a Crucial Fork in the Road
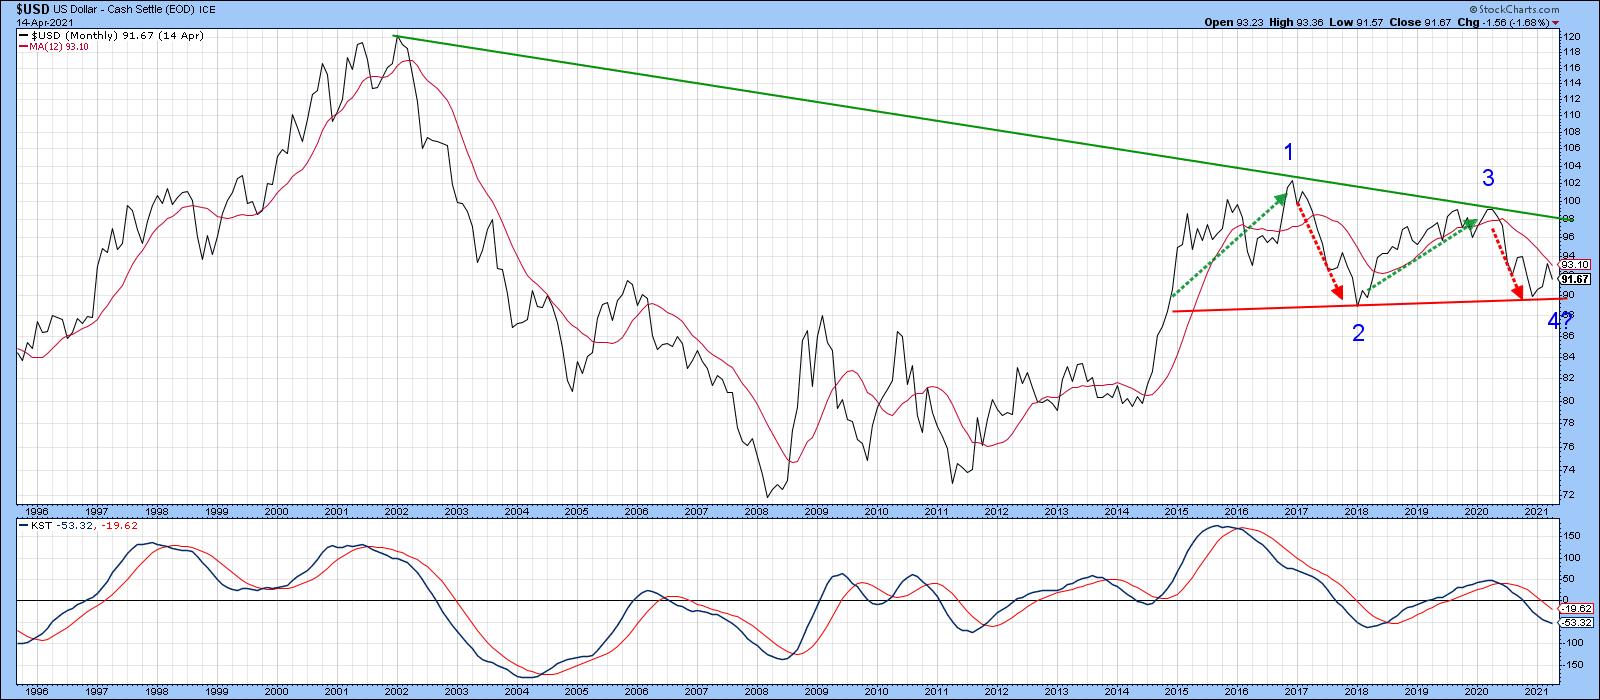
The Dollar Index has been rangebound since 2015. During that period, it has experienced two mini bull and bear markets, as flagged by the dashed arrows in Chart 1. The latest bear has been in force for just over a year, as signaled by the Index trading below its 12-month MA and its long-term KST continuing to decline.
The pink shading in Chart 2 shows us that, while not perfect, this approach has captured most of the declines that have taken place in the last couple of decades. The unshaded periods, which identify when both series are above their respective moving averages, also capture the majority of the advances. Right now, this model is in a bearish mode. That said, the Index is very close to its MA and the KST has begun to flatten. That means it would not take much strength to tip the balance in favor of a primary bull market.
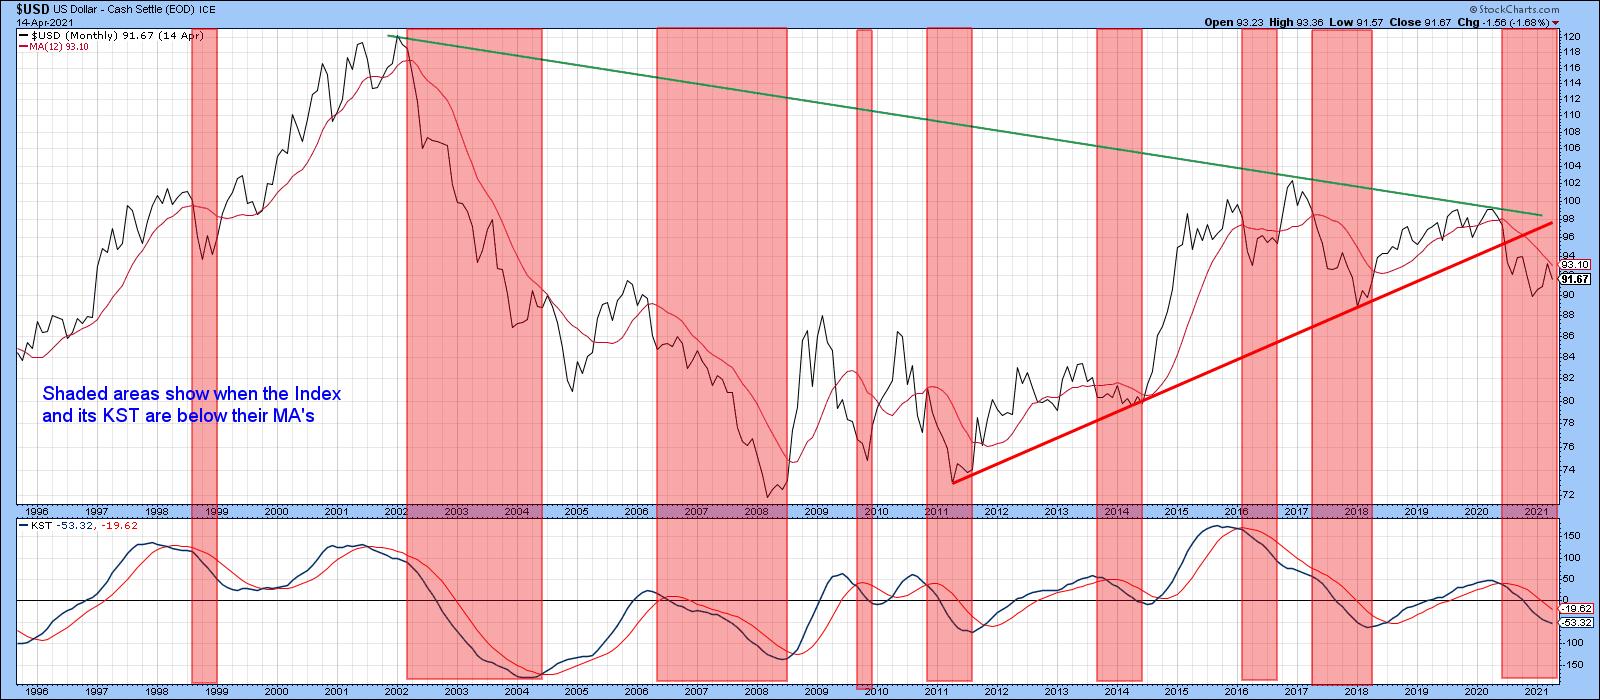
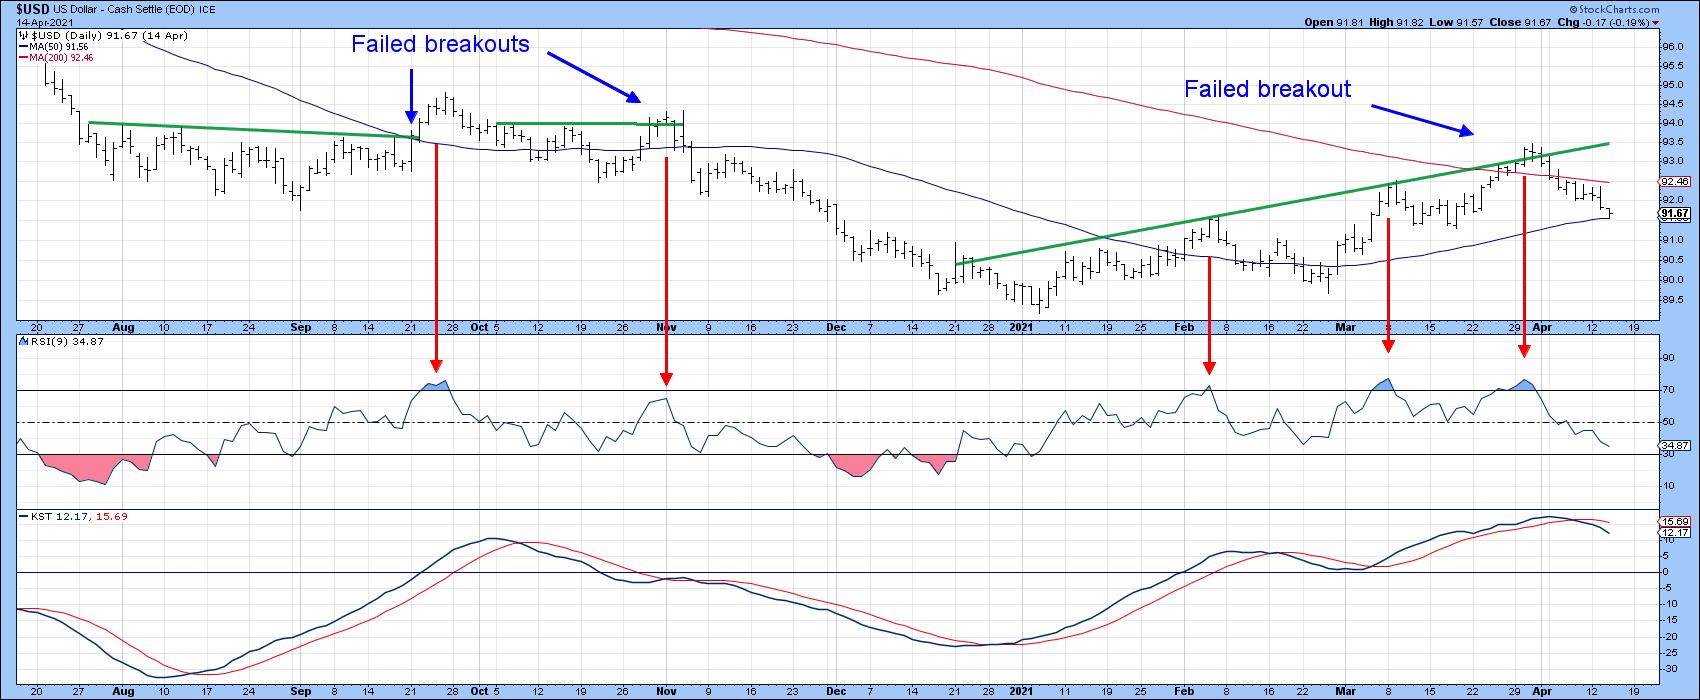
Chart 3 looks at things from a shorter-term perspective and tells us that the price action is also throwing out bearish characteristics. First, the Index recently rallied above its 200-day MA, but the breakout failed to hold. Second, it was also unable to hold above the green resistance trendline in a similar way to the two 2020 whipsaw moves. Third, the arrows point up four instances where the RSI reached an overbought condition and an immediate decline began. Strong sensitivity to overbought conditions is another characteristic of a bear market. Finally, the short-term KST has triggered a sell signal. That happens in both bull and bear markets, of course, but its negative action does suggest that further near-term corrective activity, either sideways or down, may lie ahead.
That throws open the possibility of our first fork in the road. That would involve a decisive violation of the Chart 1 red support trendline, joining the 2017 and 2021 lows at just under 90 (basis month-end close). A genuine break below that point would likely be quite serious, as it would indicate that a series of primary trend declining peaks and troughs had been signaled. Those turning points have been indicated by the blue numbers.
On the other hand, there are a number of indicators that are very close to taking the bullish fork in the road. For example, Chart 4 offers the possibility that an inverse head-and-shoulders is being formed. Hope for the bulls lies in the fact that the intermediate KST is in a positive mode. However, until a decisive close above that 93.50 area is seen, this formation remains a potential one.
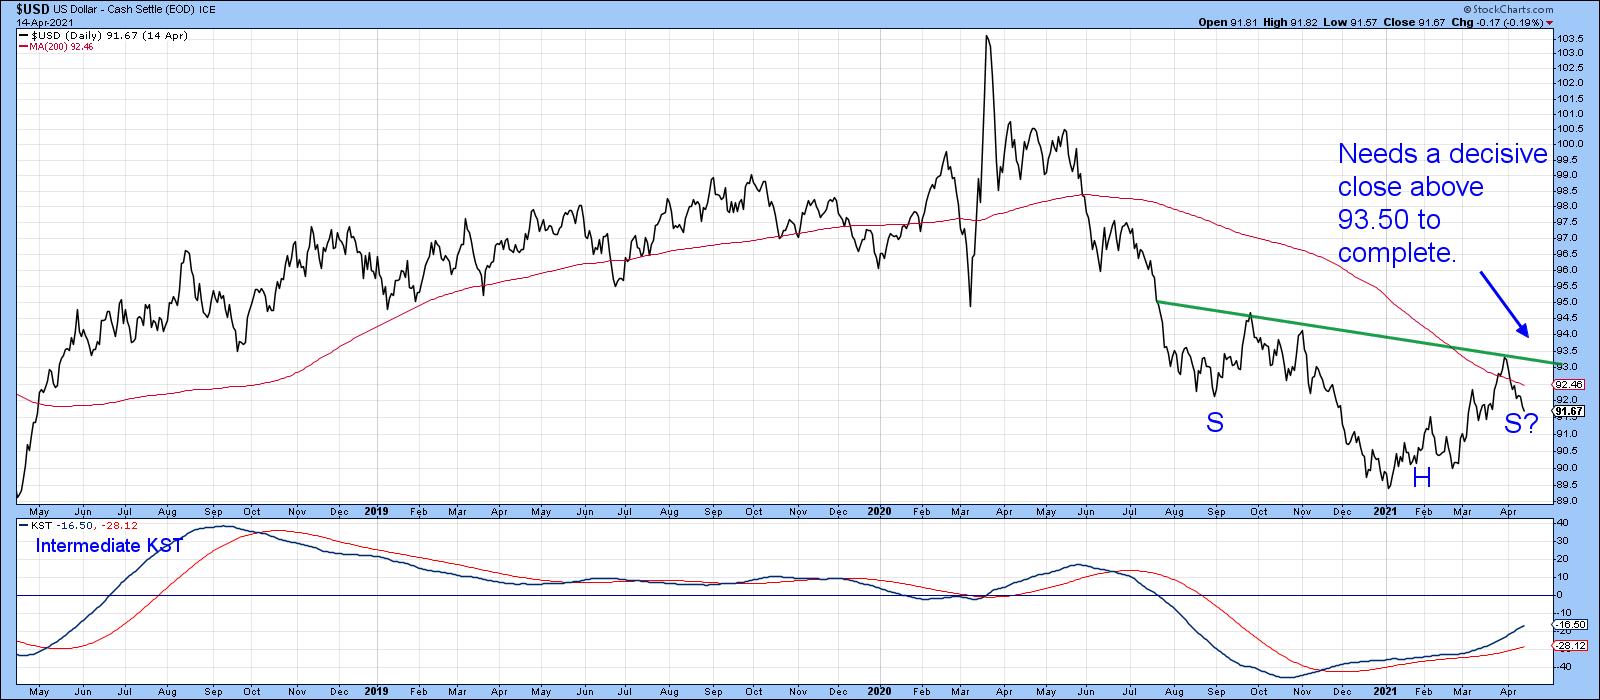
Chart 5 also points up that it would not take much to reverse the current bear phase to a bullish one. The pink shadings indicate when the Index is below its 200-day MA and when the Special K, which you can read about here, is below its signal line. The two blue arrows indicate whipsaw moves. This approach captures most of the declines and advances since 1996. Currently, this technique is bearish, but the Special K is rallying and is close to its signal line. Furthermore, the Index itself is within striking distance of its 200-day MA.
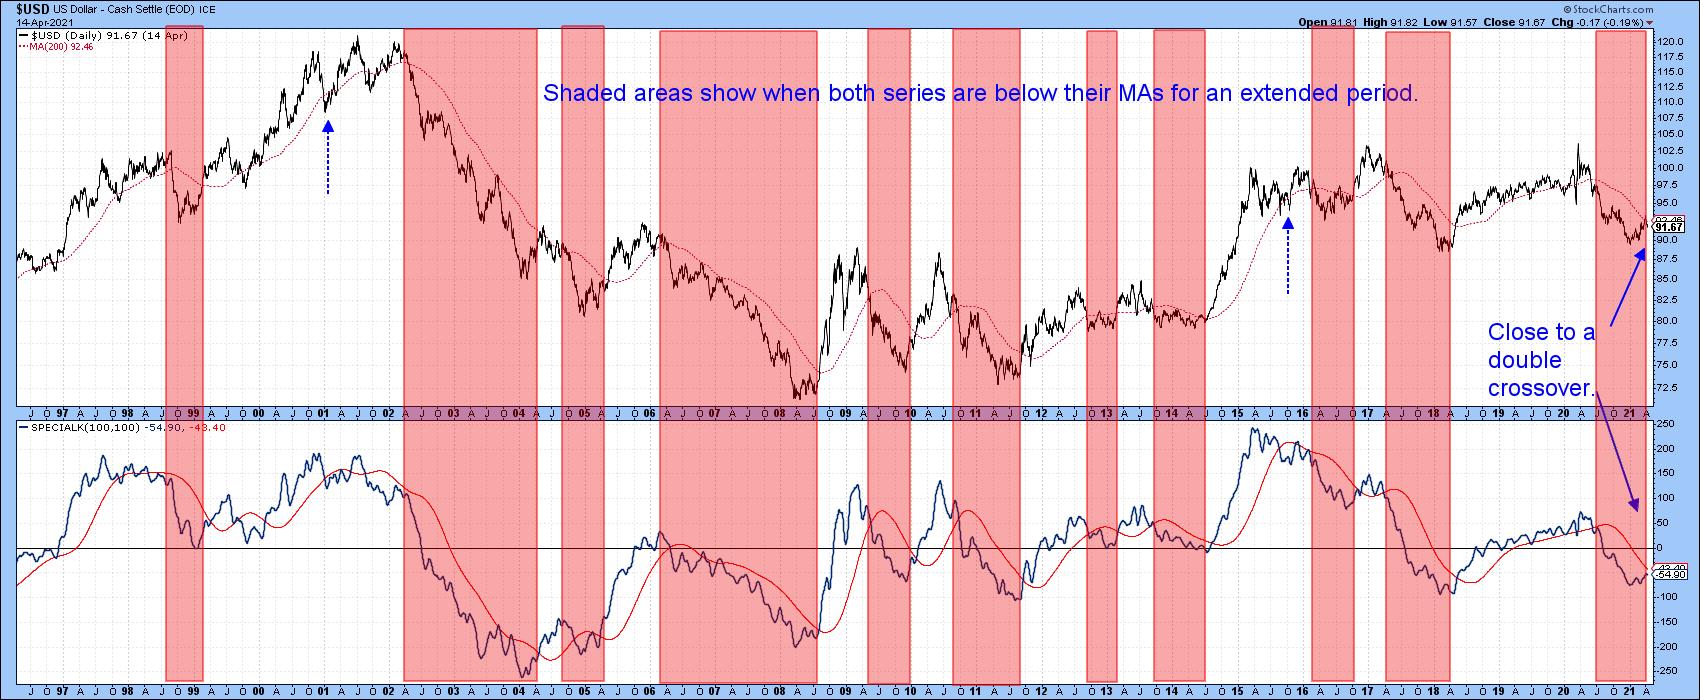
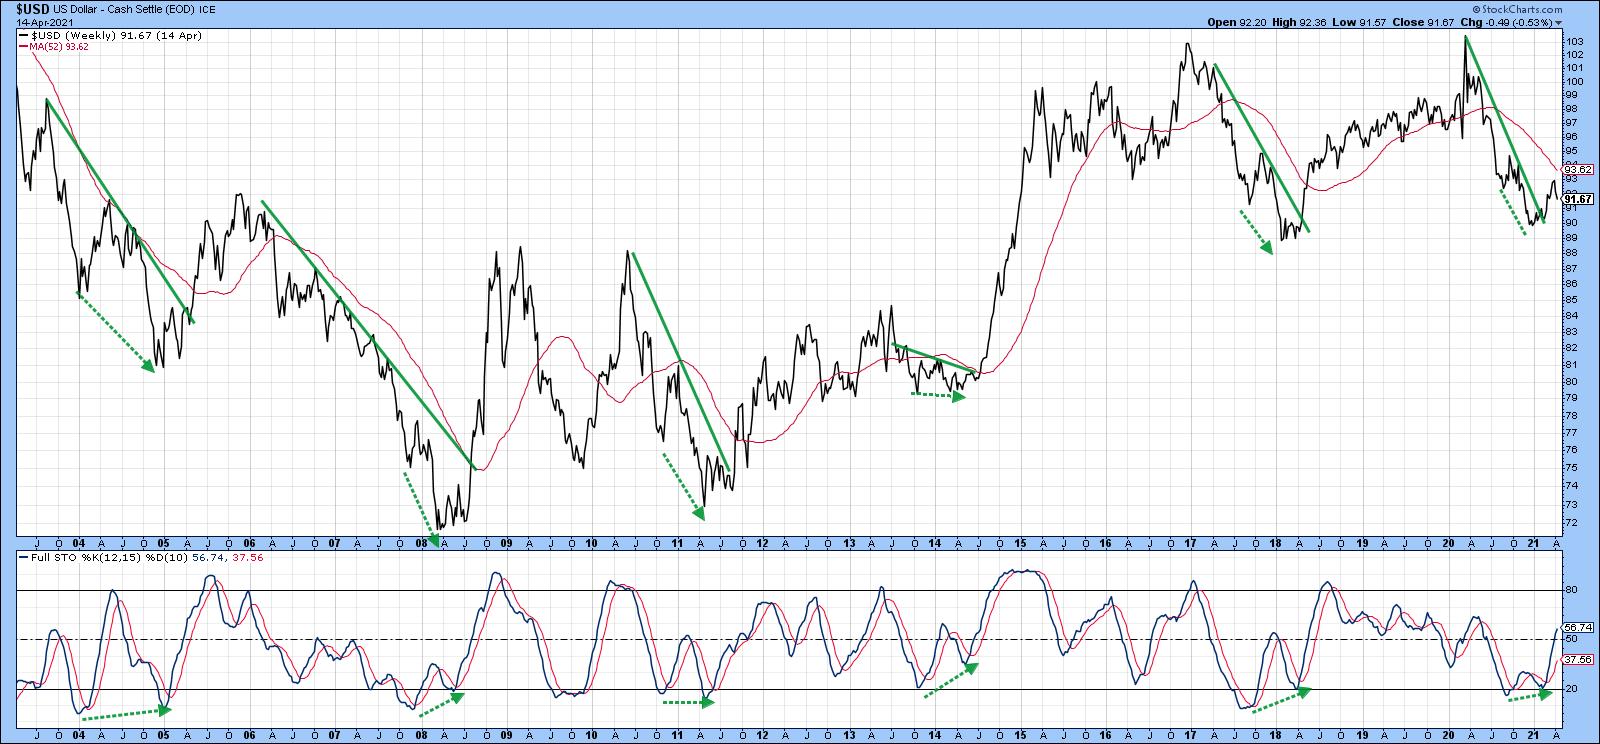
Chart 6 features a weekly stochastic using the parameters 12,15,10. Since 1995, it has been possible to observe five instances when this oscillator diverged positively with the price and was later confirmed by a trendline break in the Index. These instances were followed by a very worthwhile advance, each of which would have been powerful enough to enable the current price to clear the 52-week MA. That's not to say that the sixth recently triggered signal will, but the odds must be rated well above 50/50.
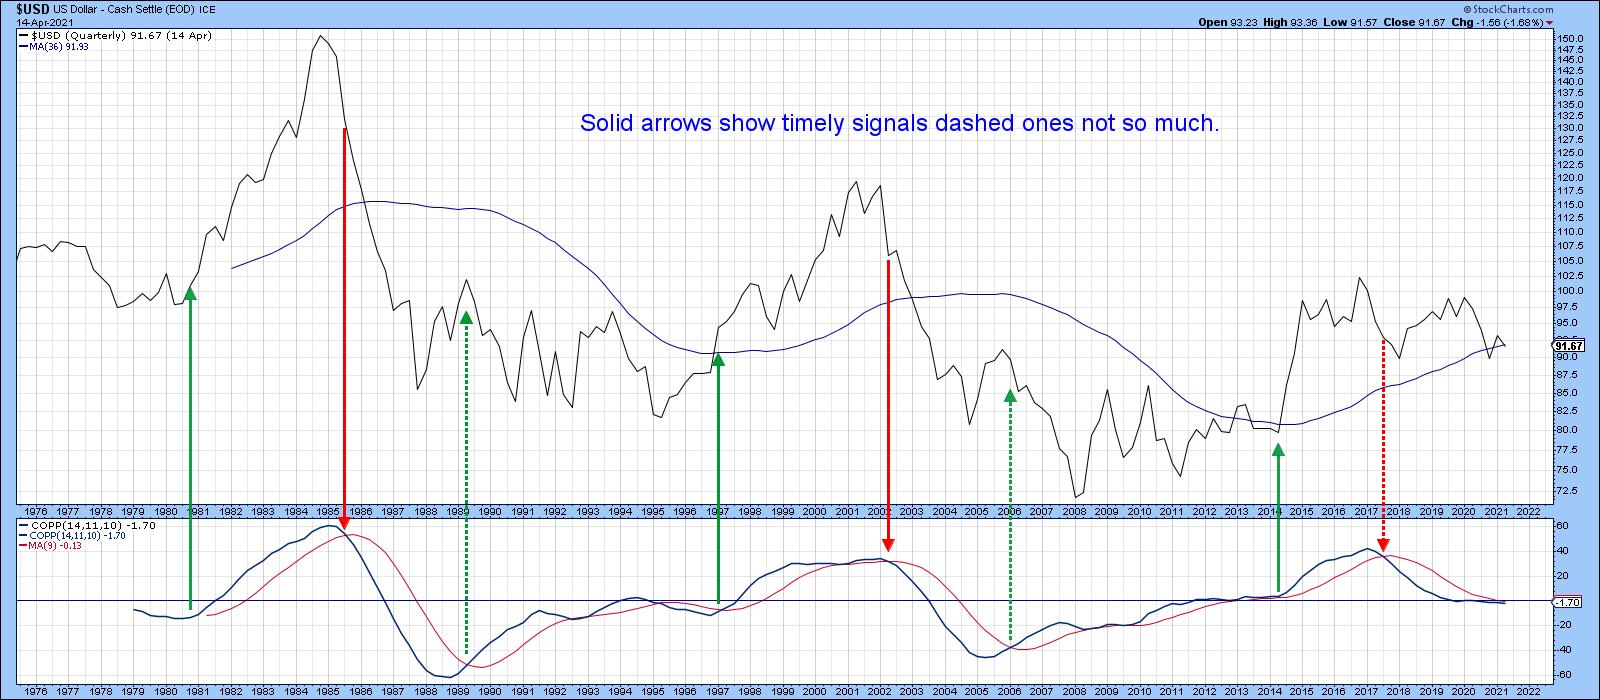
Finally, we revert back to a long-term chart, which offers some perspective to the finely balanced current technical position. The top window contains a quarterly plot of the Index, along with a 36-quarter MA. The lower one displays the quarterly Coppock Curve (or Indicator) and a 9-quarter MA. The accepted method used to trigger buy signals is to observe when the monthly Coppock Indicator falls below zero and wait for its slope to turn up. An alternative applies MA crossovers as a triggering mechanism in either direction. The green and red arrows approximate those points.
Note that most of those signals develop in sympathy with the position of the Index relative to its 36-quarter MA. The three failed dashed arrows did not. Fast forward to the current situation and we see that both the Index and momentum indicator are right at their respective moving averages. Statistically, this approach is close to being back in the bullish camp. However, we need to remember that this chart has been constructed from quarterly closes. That means the latest plot is only an "estimate," as it's going to take time until data is available for the current quarter-end. Even so, it is evident that the technical structure is in a fine state of balance, not unlike its status during the 2013-2014 period -- following which it decided to break sharply to the upside.
Conclusion
The current primary trend for the Dollar Index is bearish. The position of several short-term indicators suggests the likelihood of further near-term corrective action, perhaps involving a test of major support in the 90 area. On the other hand, the bear market has already been in force for over a year, and several indicators have moved into the kind of position where just a small amount of strength could reverse that trend, tipping the balance of evidence to the bullish side. It's going to be interesting to see which fork in the road the Dollar Index will ultimately take.
Good luck and good charting,
Martin J. Pring
The views expressed in this article are those of the author and do not necessarily reflect the position or opinion of Pring Turner Capital Groupof Walnut Creek or its affiliates.


