Watch this Market for a Huge Potential Upside Breakout
At the turn of the century, this ETF achieved a ten-timer, rallying from $4 in 2002 to $40 in 2008. It's been consolidating for the last 12 years and looks set to embark on a move to new all-time highs. It's not a tech stock, nor is it a cryptocurrency. It's a region of the world that has been out of favor for a long time and now looks set to break to the upside, taking many of its component countries with it. That ETF is the iShares Latin America 40 ETF, the ILF.
Latin America in General
Chart 1 shows its meteoric rise at the turn of the century, together with the rangebound action that has since followed. The price has found resistance at the 2008-2022 trendline on numerous occasions. Now it's trying to edge its way through. Until it does, we have to be careful about calling a breakout, as current action could easily turn into disappointment, as it has in the past. That said, there are some grounds for suspecting that it will be successful this time. For starters, the long-term KST, which you can read about here, has just gone bullish. It's not a perfect indicator, as you can see from the dashed arrow flagging the 2014 signal. However, it usually puts the odds on your side. Second, relative action against the world indexes and S&P has started to rupture some very long-term down trends. Finally, as we shall see later, many individual Latin American country ETFs have already begun to break to the upside. Those that have not look poised to do so.
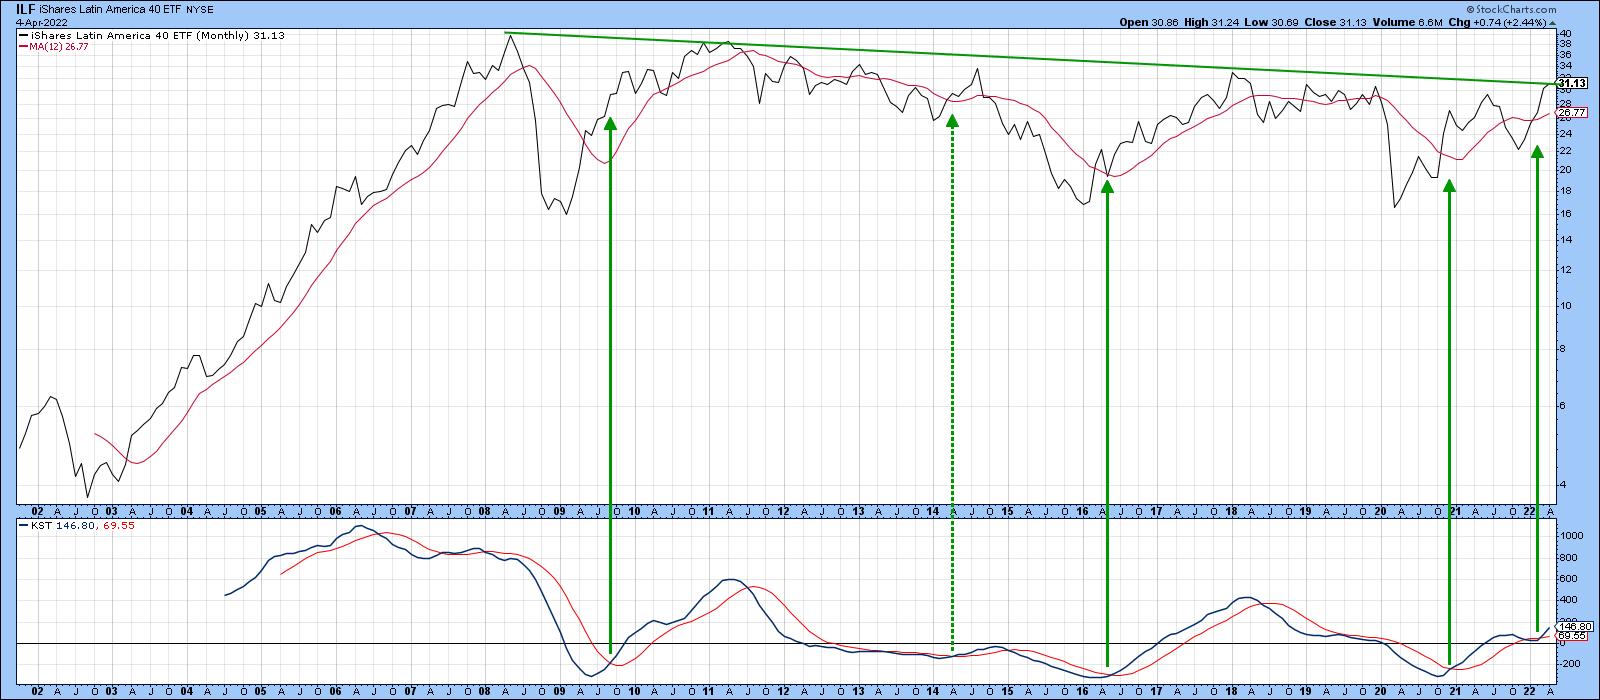
Chart 2 shows that Latin America, taken as a whole, is very much a resource play. The arrows highlight the principal price movements that have taken place this century. The basic difference between the two series is that the ILF has moved sideways, whereas the CRB Composite, up until early 2020, had been zig-zagging on the downside.
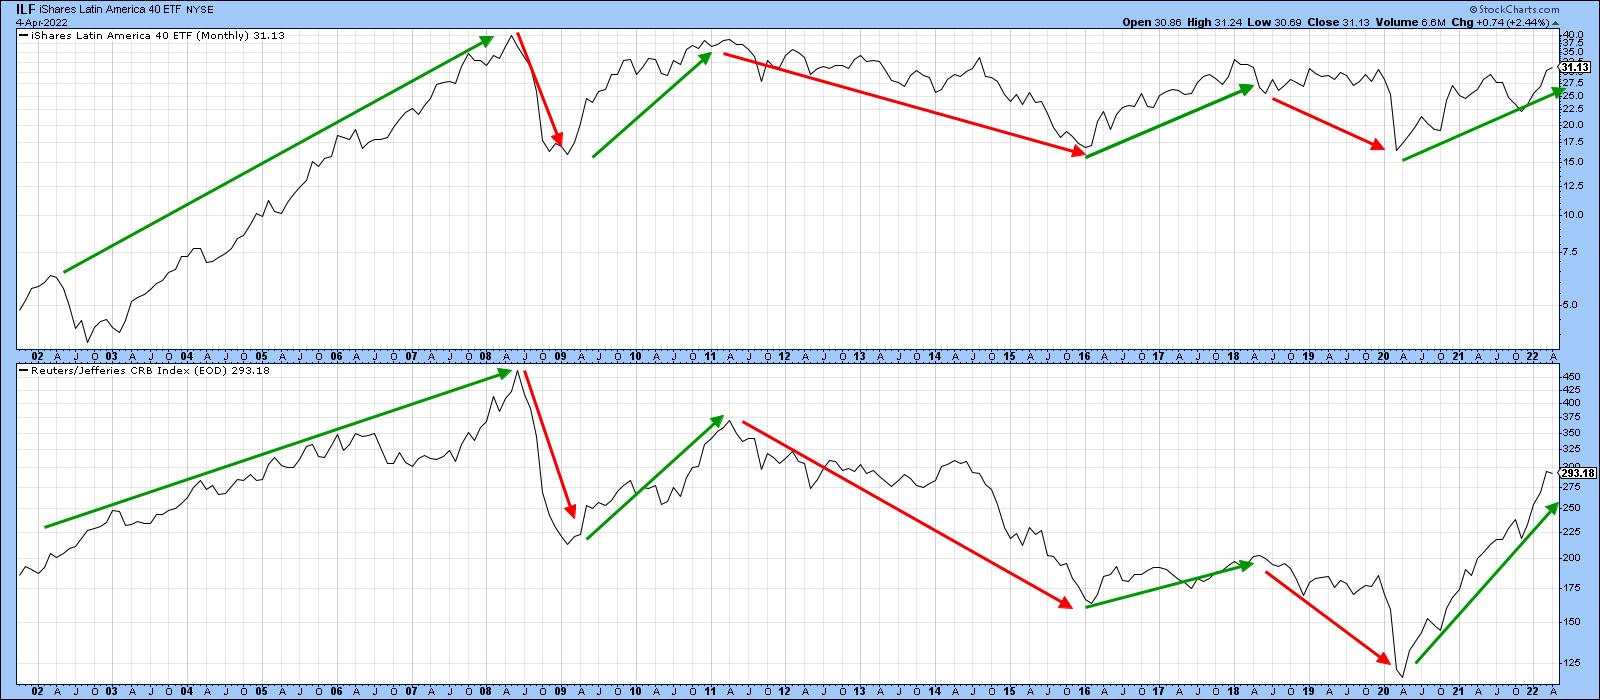
Chart 3 contains one of my favorite templates, comparing the absolute price and its long-term KST to its RS line and a long-term KST calculated for relative action. In this case, the price is compared to the MSCI World Stock ETF (ACWI). I call this the "nirvana" template because it gives me a substantial amount of information on the price, relative action and their long-term momentum in just one chart. It's a great starting point for an analysis, even for short-term traders, as the character of short-term price movements is determined by the direction of the main trend.
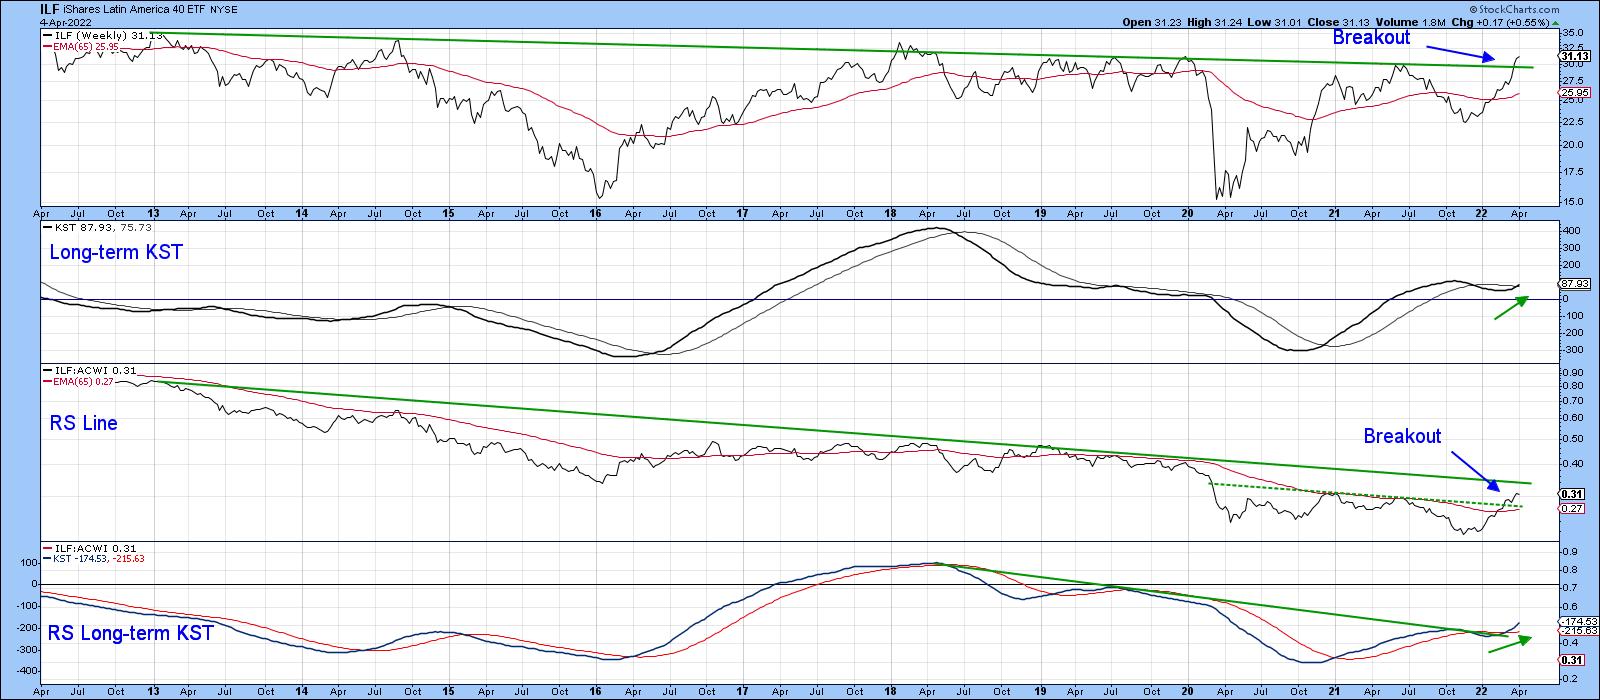
The best long-term signals are triggered when the two KSTs start to reverse to the upside from a relatively low level and this is confirmed by the price and relative action crossing above both their 65-week EMAs and a significant trendline. The chart shows that the ILF has just broken above its 2012-2022 resistance trendline at a time when the absolute KST has started to re-accelerate on the upside. It's true that the RS line has yet to surpass its secular down trendline. However, that is likely to happen because it has already cleared the dashed green 2020-2022 resistance trendline and its EMA. This action is also supported by the long-term KST for relative action, which has not only begun to rise but has recently moved above its 2018-22 down trendline.
If you like this nirvana arrangement and want to replicate it, click on the chart and save it as a template. In the StockCharts workbench, you can also change the base security by substituting the $SPX or another Index for the ACWI, should you want to accomplish some sector analysis.
Latin American Country ETFs
The following country ETFs are arranged in an approximate order of relative technical attractiveness. First on deck is the Mexican ETF (EWW), featured in Chart 4. Here we can see a major upside breakout by the price and a secular down trendline violation by its RS line. Both KSTs are supporting this action as the EWW leads the ILF higher.
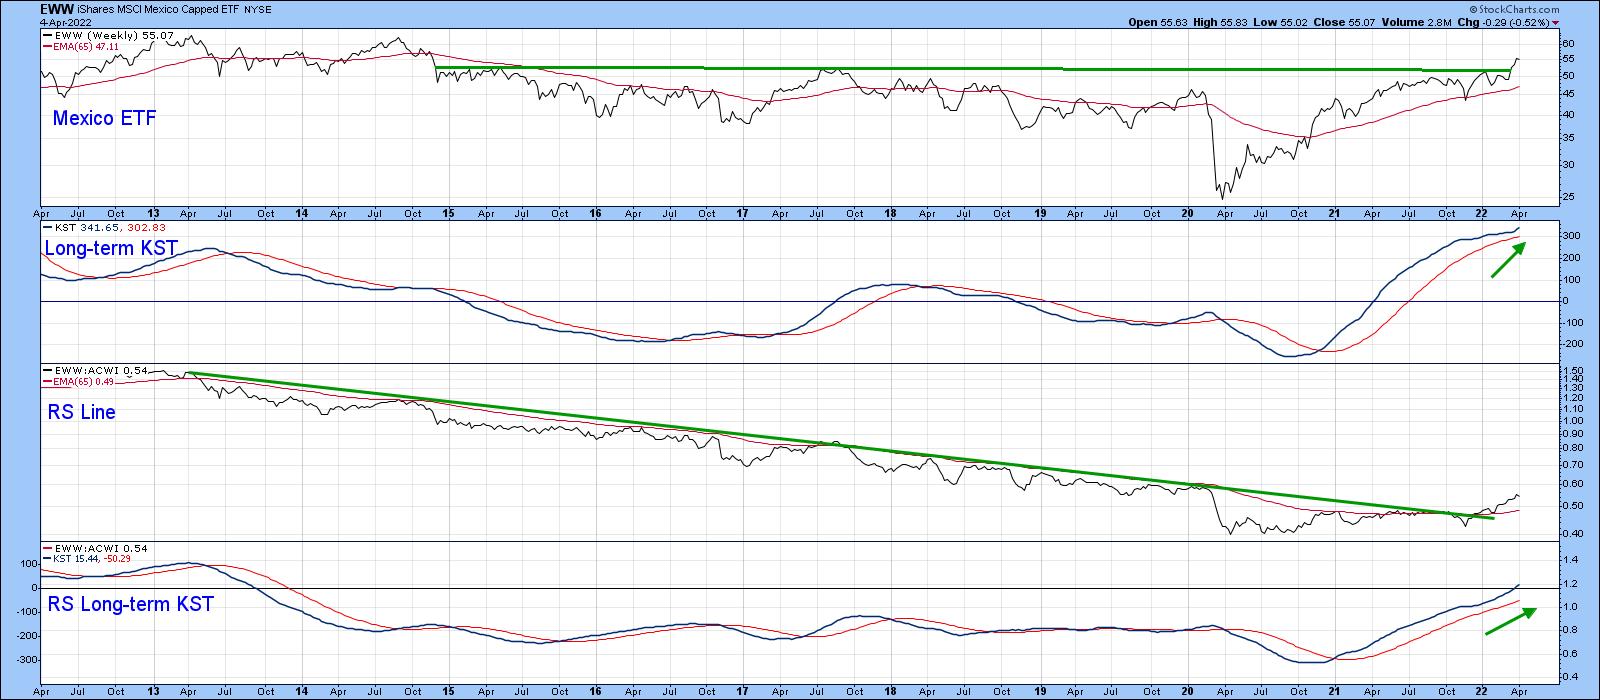
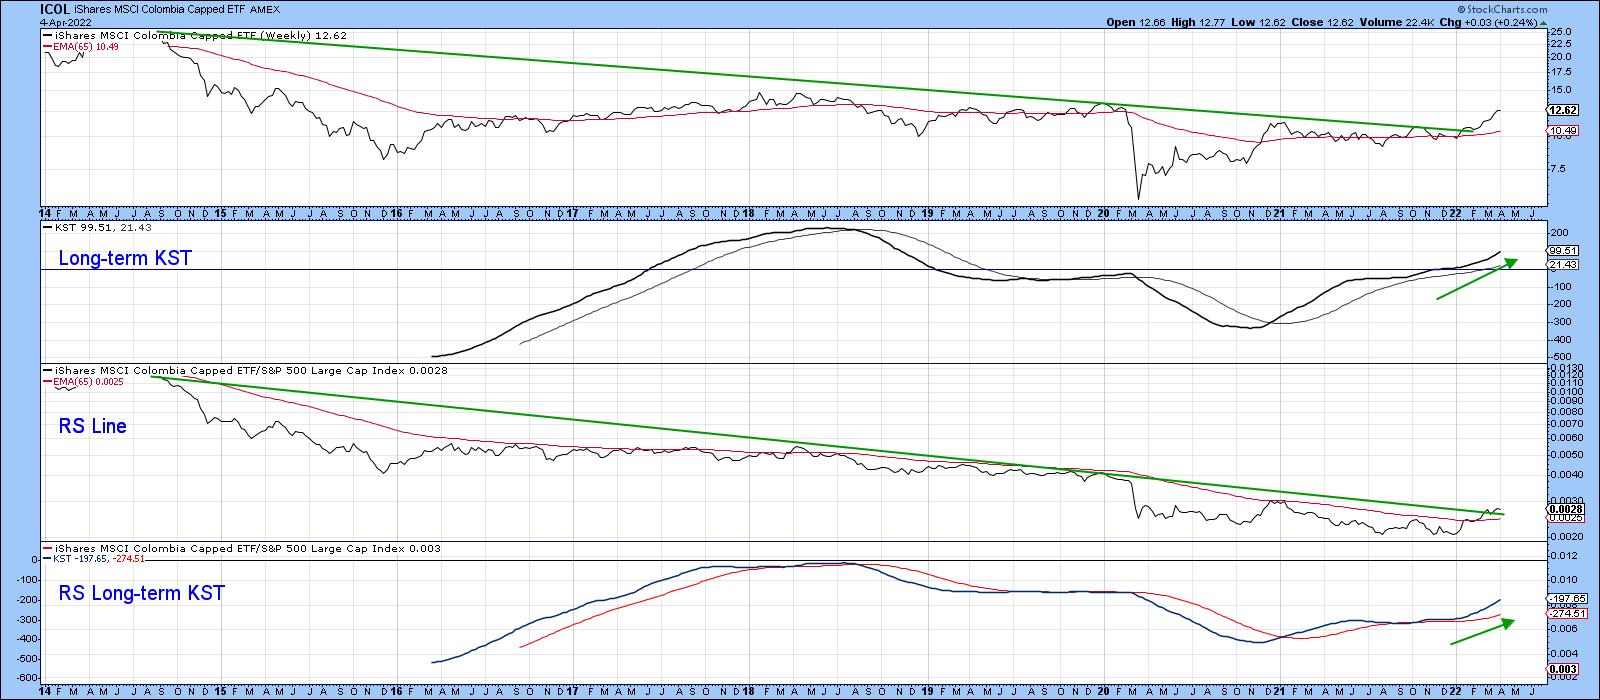
Chart 5 shows another double price and RS breakout, this time for the iShares MSCI Columbia (ICOL). Since this action is being supported by two decisively bullish KSTs, higher prices are expected.
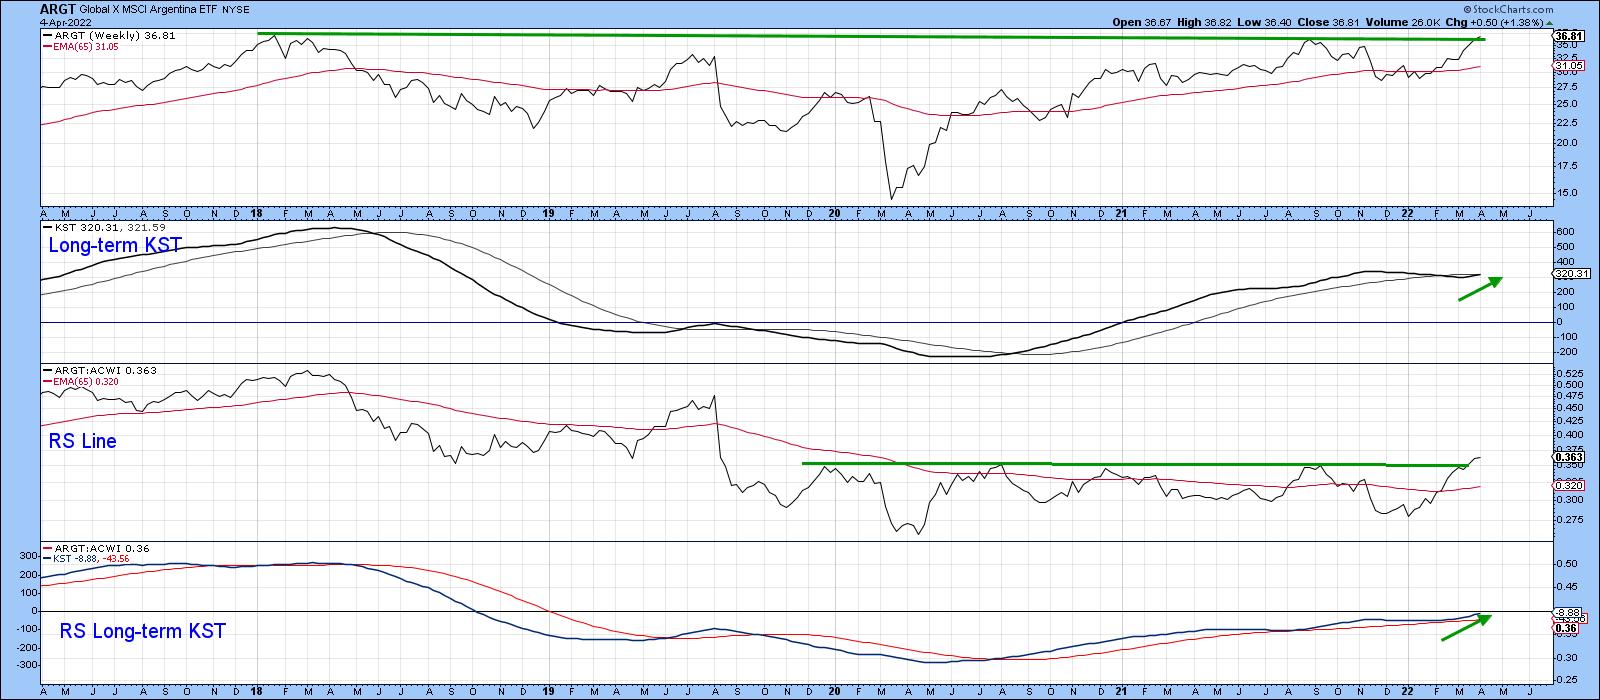
The Global X MSCI Argentina ETF (ARGT) in Chart 6 has broken out from a nice base for relative action, which suggests that the tentative upside break in the price may soon be able to be upgraded to a decisive one.
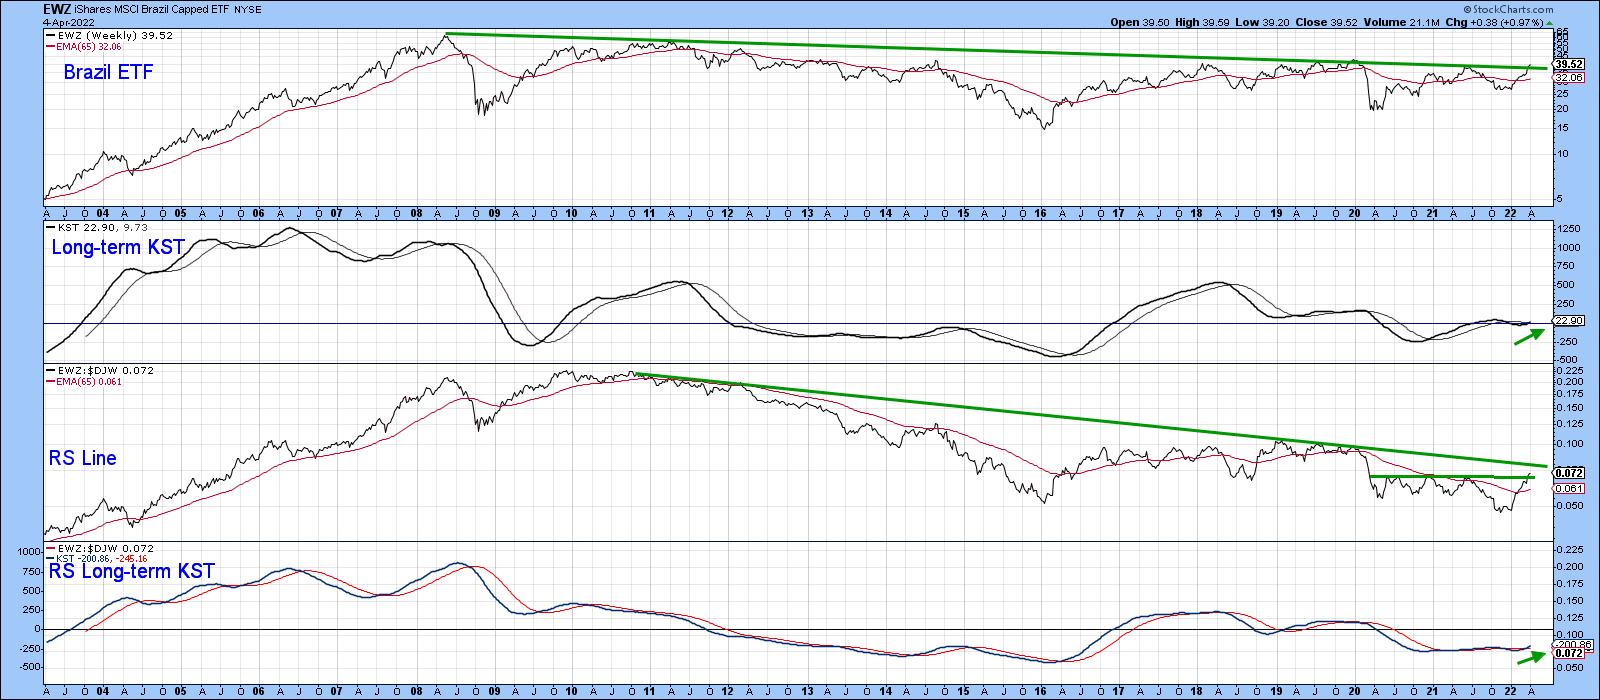
Brazil, in the form of the EWZ in Chart 7, is edging through its 2008-2022 resistance trendline, which is being supported by a recently minted long-term KST buy signal. The relative action has tentatively completed a small base but has not yet cleared its secular down trendline. A rising KST says it soon will.
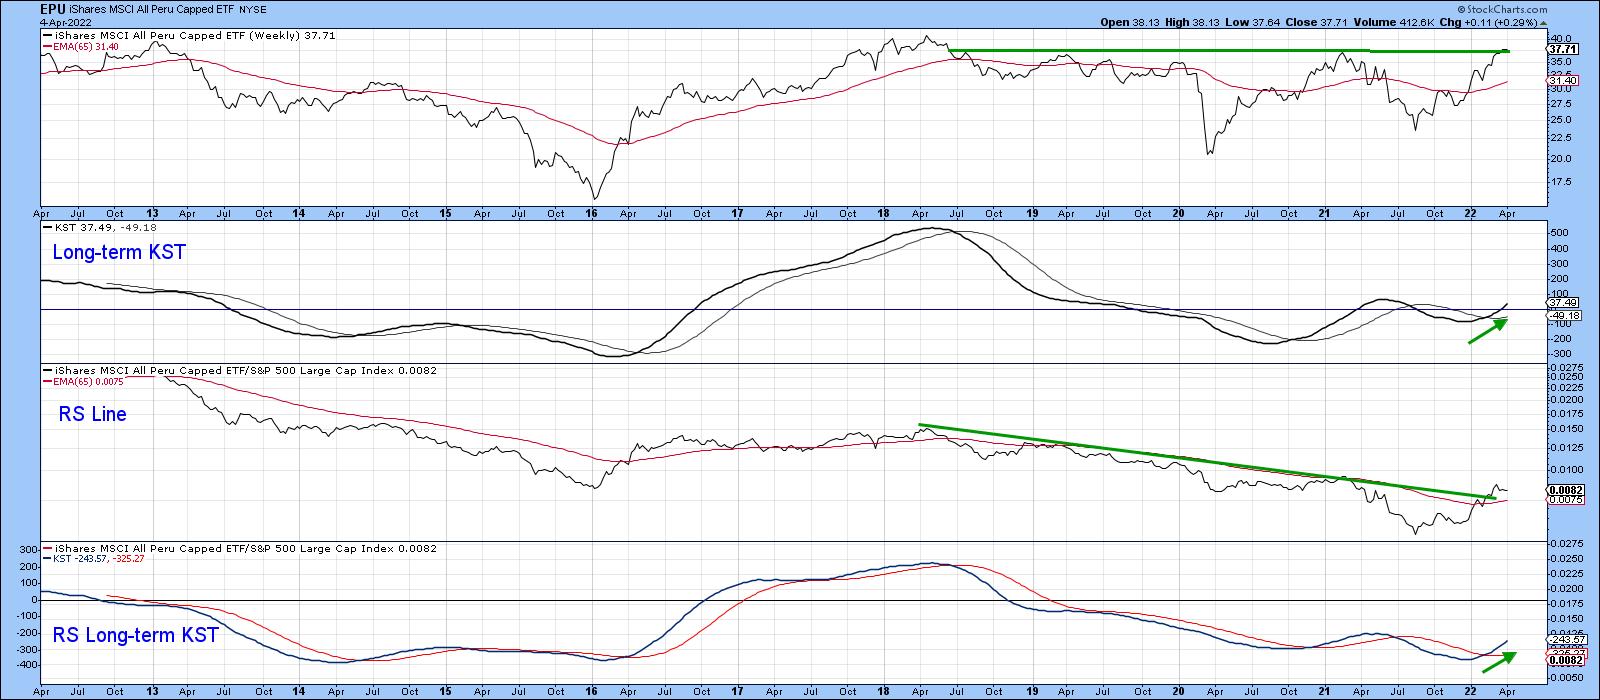
Peru (EPU) in Chart 8, is very close to a price breakout, having already established one in the relative strength department. Both KSTs have begun to edge higher, which is another positive factor.
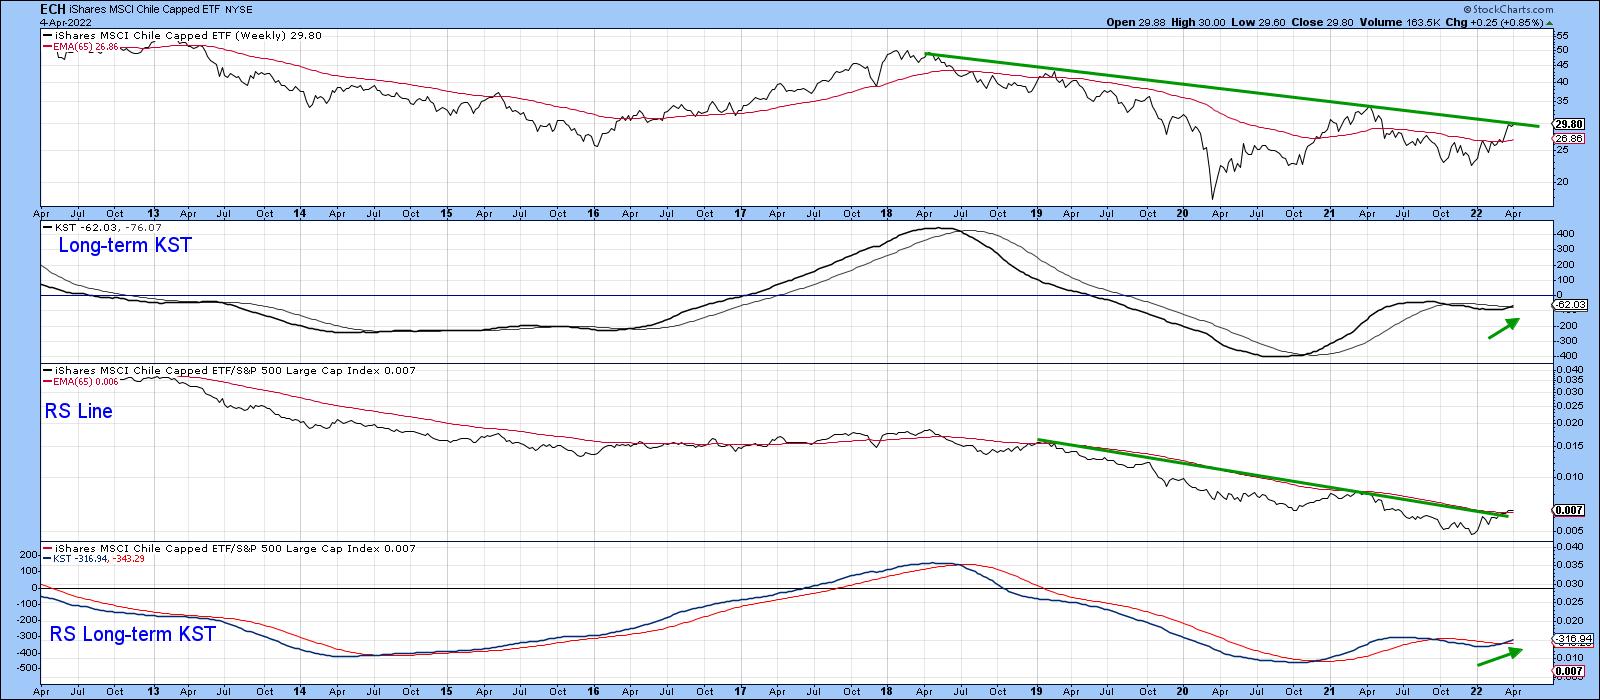
Finally, Chile (ECH) is right at its 2018-2022 down trendline, seen in Chart 9. A break above it would be positive. However, it would not likely be as significant as the one for some of the other ETFs, such as Mexico, for example. Its resistance trendline is much longer and has been touched or approached on more numerous occasions.
Conclusion
The Latin American ETFs are either breaking to the upside or are very close to doing so. Given their long-term sensitivity to swings in the commodity markets, a valid and decisive upside break by the ILF would be a strong signal for substantial commodity gains over the course of the next few years.
Good luck and good charting,
Martin J. Pring
The views expressed in this article are those of the author and do not necessarily reflect the position or opinion of Pring Turner Capital Groupof Walnut Creek or its affiliates.


