The Rally Since Mid-June Leaves a Lot to be Desired
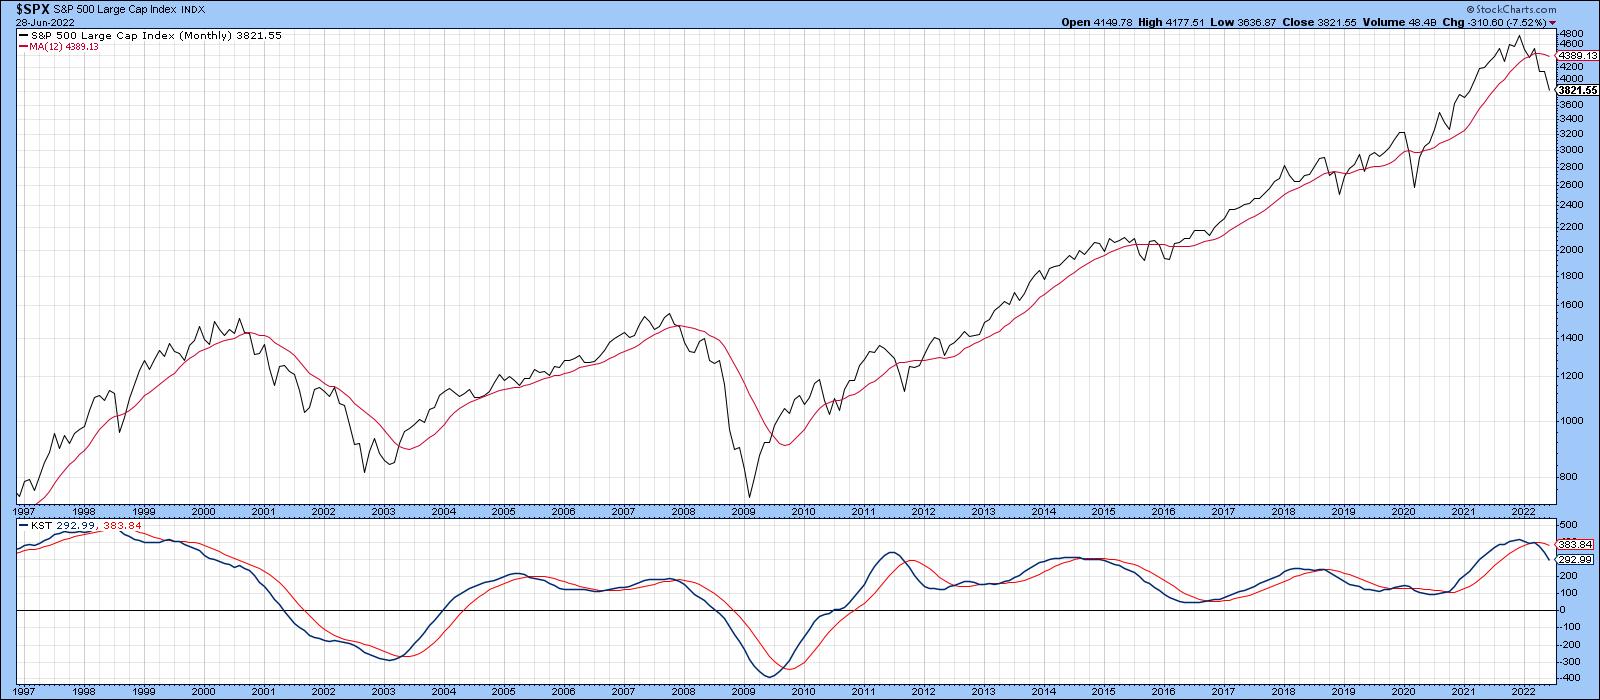
Long-term indicators, such as the KST and the S&P relative to its 12-month MA, remain in a bearish mode, but, that said, it would certainly be unusual to see them turn bullish immediately after the final low. Indeed, Chart 1 shows that the Index is currently well below its MA. Note that the long-term KST is still overbought, despite a 20% drop in the Index.
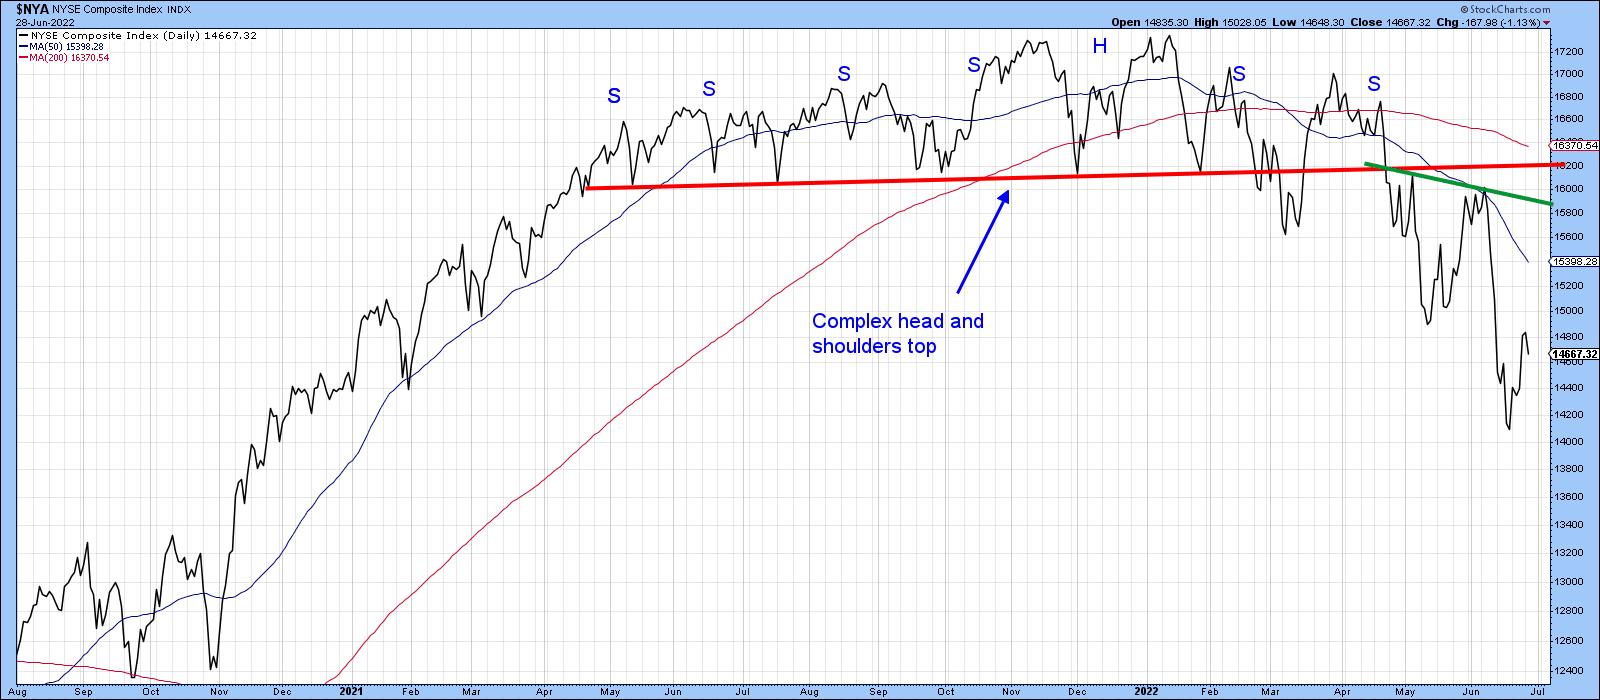
Also, by way of a negative backdrop, Chart 2 demonstrates that the NYSE Composite recently broke down from a large complex top, which is likely to offer an impressive barrier on the way back up. Surely, a lot of investors will want to break even when given the chance.
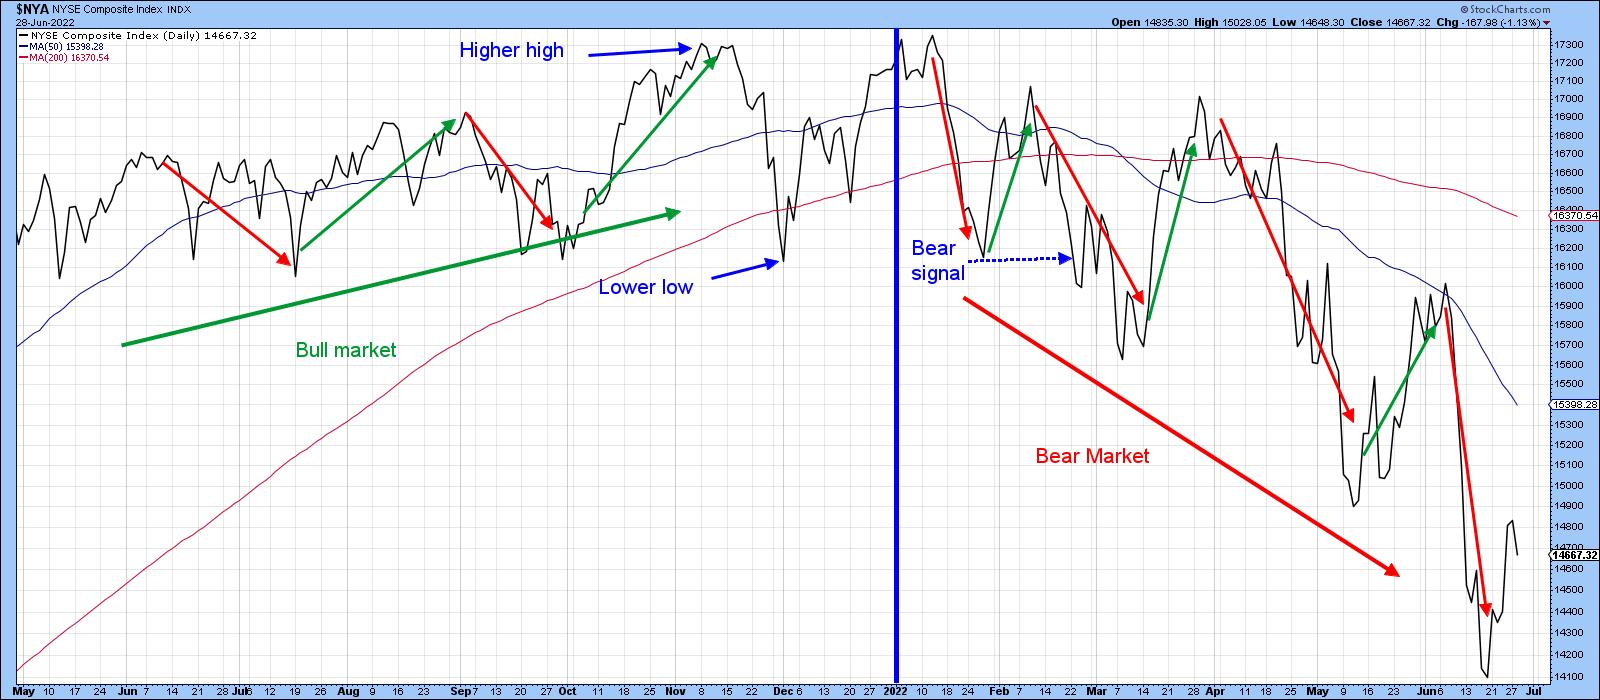
A characteristic of the bear market since January is the existence of a series of lower short-term peaks and troughs. Recent price waves are indicated in Chart 3 by the arrows. A lower low was touched in December of last year. At that time, the price registered a new low under September's bottom, but the series of rising peaks was still intact.
The December low did not signal a bear market. Rather, the signal was triggered in late February, following the failed rally earlier in the month. Until we see a reversal in this progression, peak and trough analysis will remain in the bearish camp, as we have yet to see even a successful test of the low.
These things obviously take time to work through. However, it is occasionally possible to get excited about some really bullish characteristics in the early stages of a rally. Unfortunately, I don't see any of that in the current technical picture. More to the point, there are several bear market characteristics that are still in force and that tell us to be ultra-cautious.
Three Bear Market Characteristics
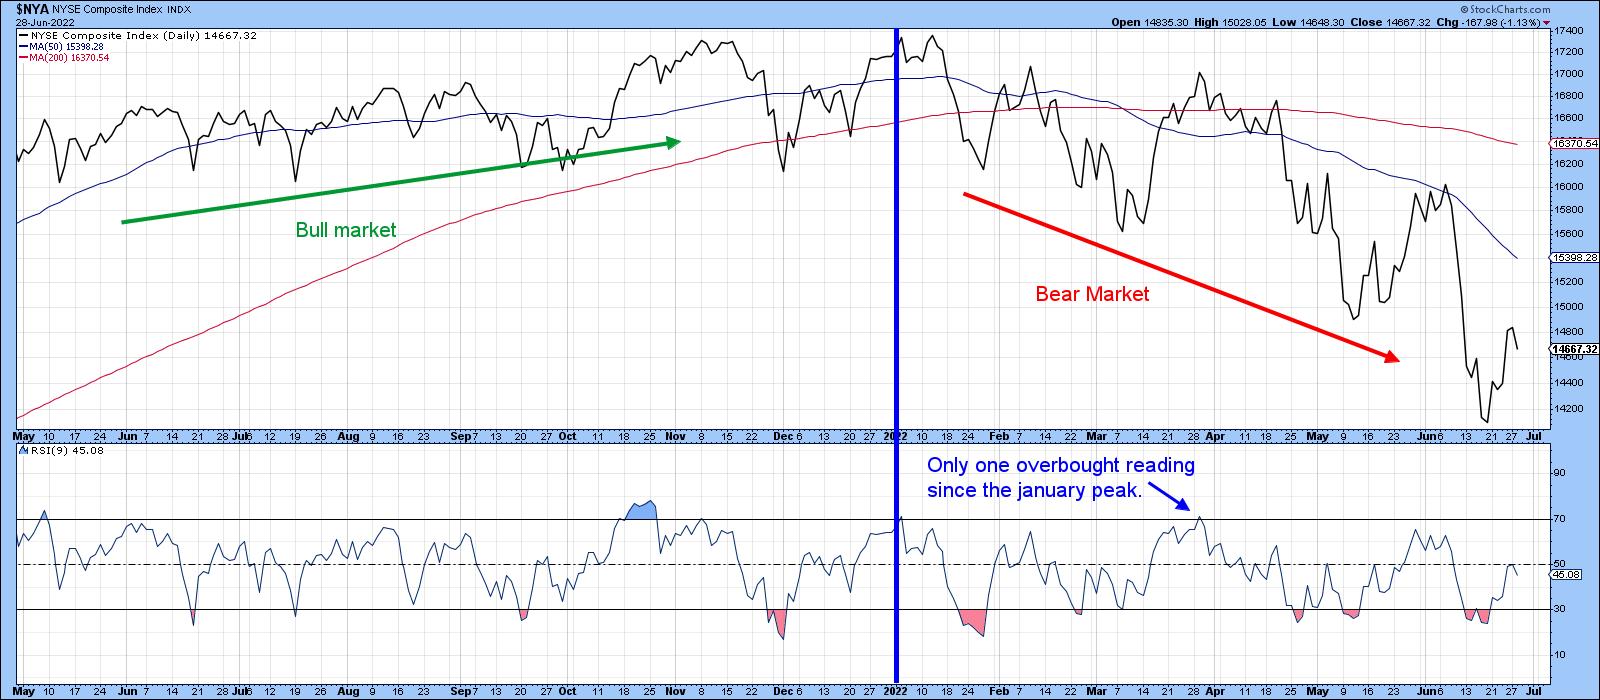
Short-term rallies and reactions usually behave differently in bull and bear markets. When the primary trend is up, RSI and other short-term indicators generally remain in an overbought condition longer and are extremely sensitive to oversold conditions. We can see that in the left-hand part of Chart 4, where the NYA rallied smartly every time it touched an oversold condition. That compares to the right-hand, where the 9-day RSI has only touched its overbought zone once since the bear market began, which was followed by the sharp March/May decline. By the same token, oversold conditions have been plentiful and been followed by weak advances; not much sensitivity here. Consequently, there is nothing in the RSI's behavior in the last few weeks to suggest that anything has changed.
Volume is also behaving in a way that is consistent with a primary bear market. Normally, we expect activity to rise on a rally, indicating buyer enthusiasm, and to contract during a decline. When volume behaves differently, by contracting in the face of an advance, it indicates a lack of enthusiasm on behalf of buyers and is bearish. In a similar vein, rising volume during a sell-off tells us that sellers are motivated. That's also a bad sign. Such characteristics are not always present in every bear market, but when they are, we need to be careful.
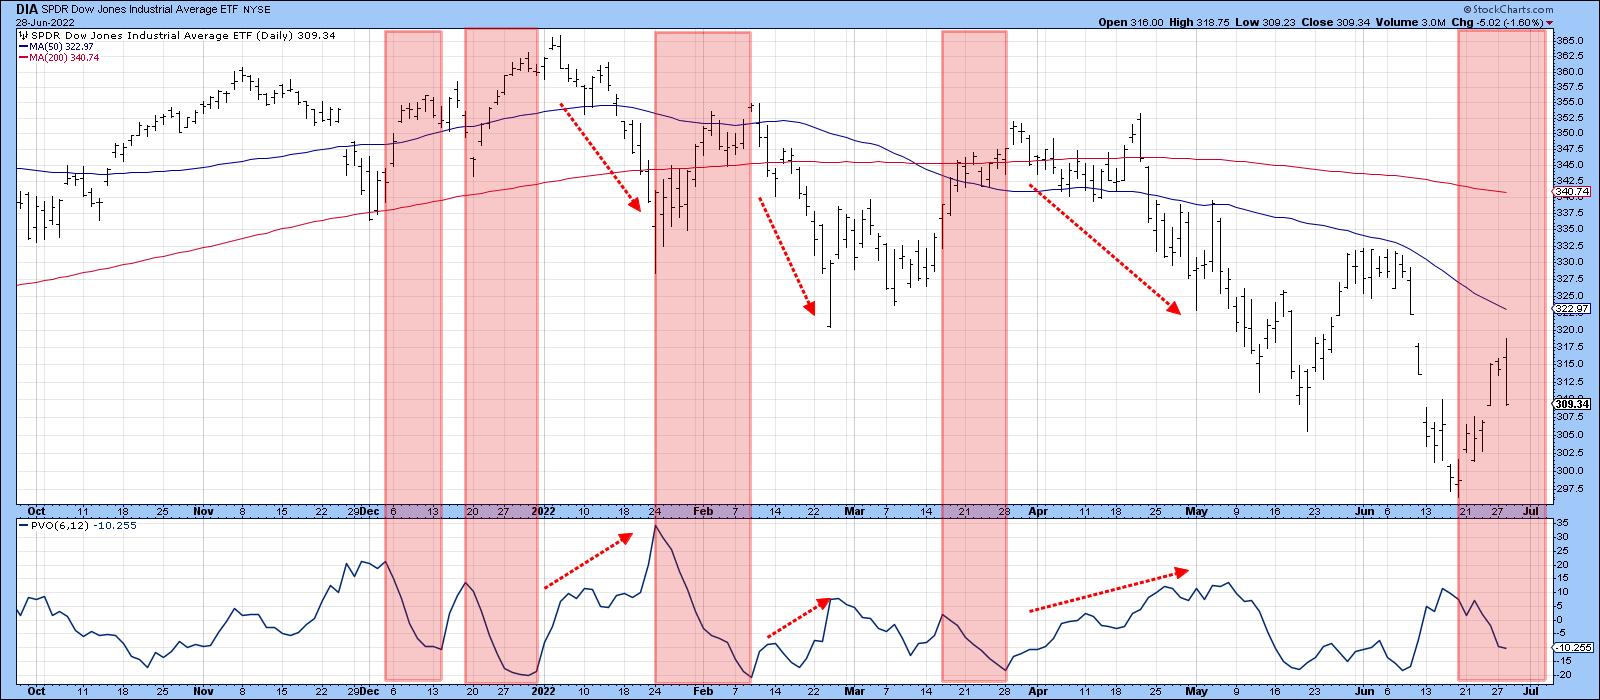
In that respect, Chart 5 compares the SPDR Dow Jones ETF (DIA) to a price volume oscillator (PVO) using the 6- and 12-day parameters. The pink-shaded areas flag periods when the PVO is in a declining mode. Note that is also the time when the Index is rallying, so it's a bearish characteristic. The red-dashed arrows point out when the Index is declining and volume, as measured by the PVO, is expanding. Note that the late June advance is (so far) being accompanied by a trend of declining volume.
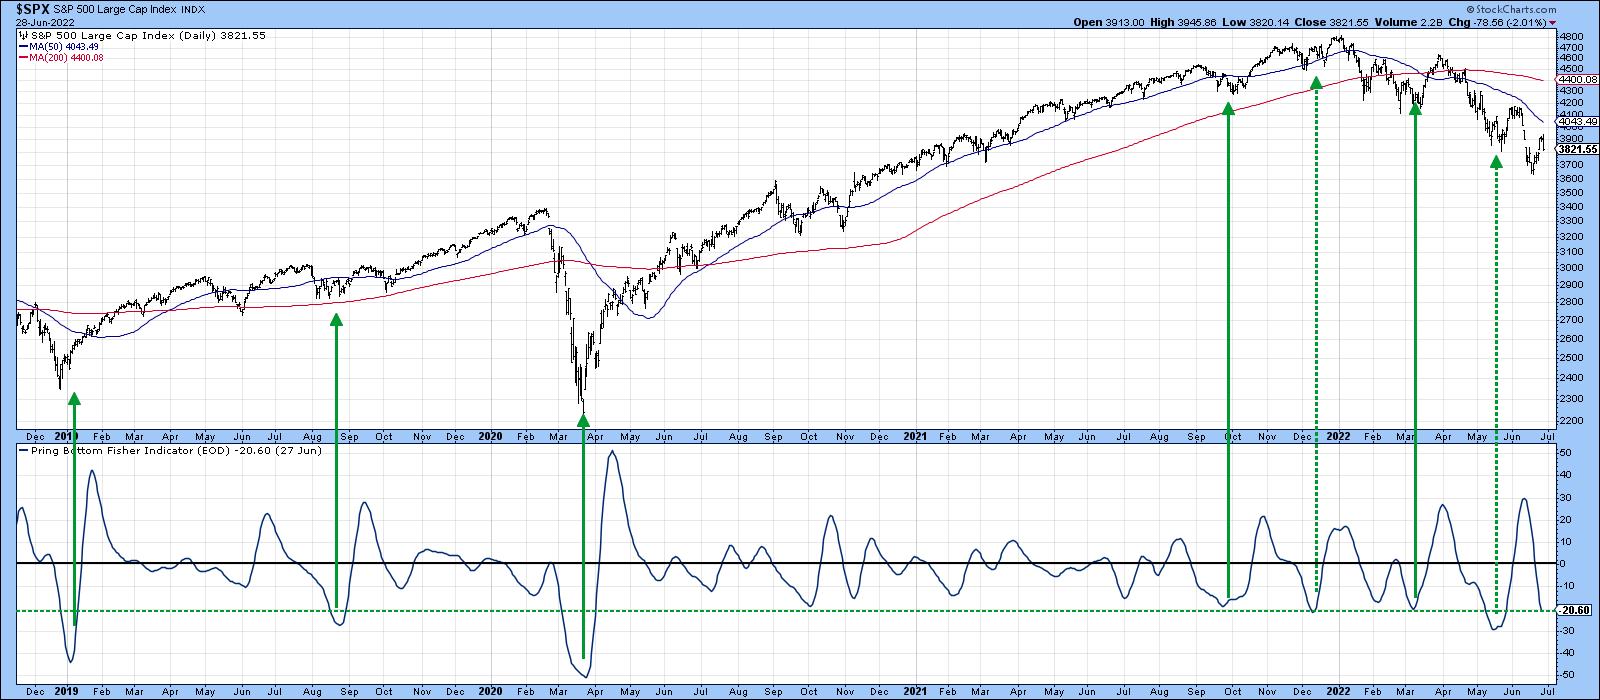
A third bearish characteristic arises when an indicator that is normally reliable in signaling a strong rally is instead followed by a weak or non-existent one. That's been the case with several indicators in 2022. By way of an example, my Bottom Fisher, which is described here, is featured in Chart 7. The solid green arrows demonstrate that, when the Fisher drops below the dashed green line and reverses to the upside, it is normal for the market to experience a worthwhile rally. The dashed arrows were followed by sub-par advances. The December and March signals were borderline in terms of their power to signal a strong advance. However, the latest in May signal was only able to generate a two-week advance. That's pretty pathetic by normal standards and is definitely consistent with a bear market.
Good luck and good charting,
Martin J. Pring
The views expressed in this article are those of the author and do not necessarily reflect the position or opinion of Pring Turner Capital Groupof Walnut Creek or its affiliates.


