Housing Data Disappoints, But Housing ETFs Rally
Due to its sensitivity to interest rates, housing has the greatest average lead time going into recessions than any other economic (as opposed to financial) indicator. For that reason alone, it is worth examining amid the constant talk of recession.
The HMI vs. Housing Starts
Earlier this week, two important housing indicators were reported: the NAHB/Wells Fargo Housing Market Index (HMI) and housing starts. The HMI is based on a monthly survey of National Association of Home Builders members and is designed to take the pulse of the single-family housing market. The survey asks respondents to rate market conditions for the sale of new homes at the present time and in the next six months, as well as the traffic of prospective buyers of new homes. Unfortunately, data is only available since the mid 1980s, which is not that long in economic terms.
However, since its inception, the HMI has tracked the housing starts numbers pretty closely. It also has four advantages. First, the data is reported in the current month and not lagged by a month, as is the case with housing starts. Second, it is far less jagged and, therefore, offers a better reflection of the underlying trend, Third, the HMI has a tendency to lead housing starts by a month or two. Finally, since it is based on opinions, the reported number is never revised, unlike housing starts themselves.
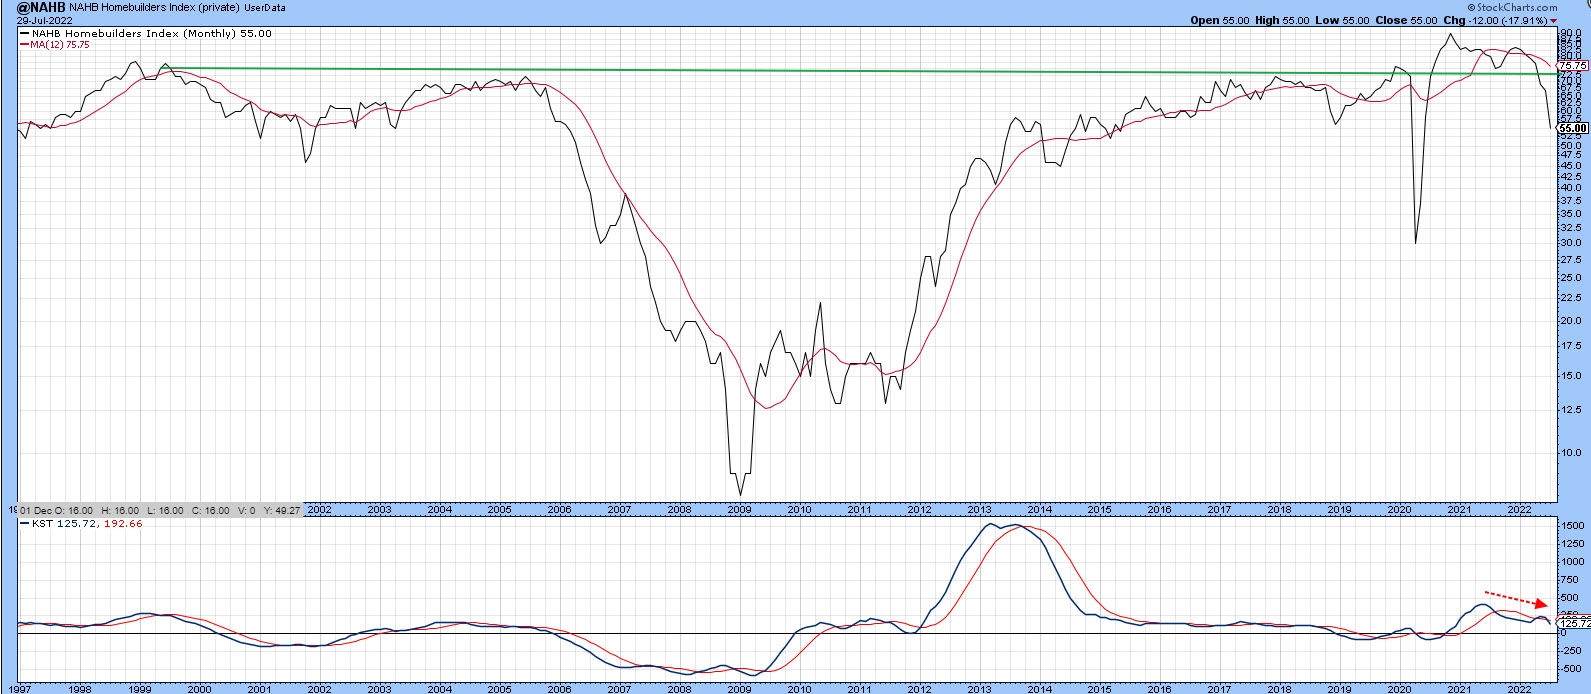
Chart 1 compares the two series since the mid-1980s. It is apparent that both violated support trendlines in 1989, as well as in early 2006 just prior to the housing bust. The dashed arrows also show that the HMI experienced a small negative divergence, with the start data just prior to the housing crash.
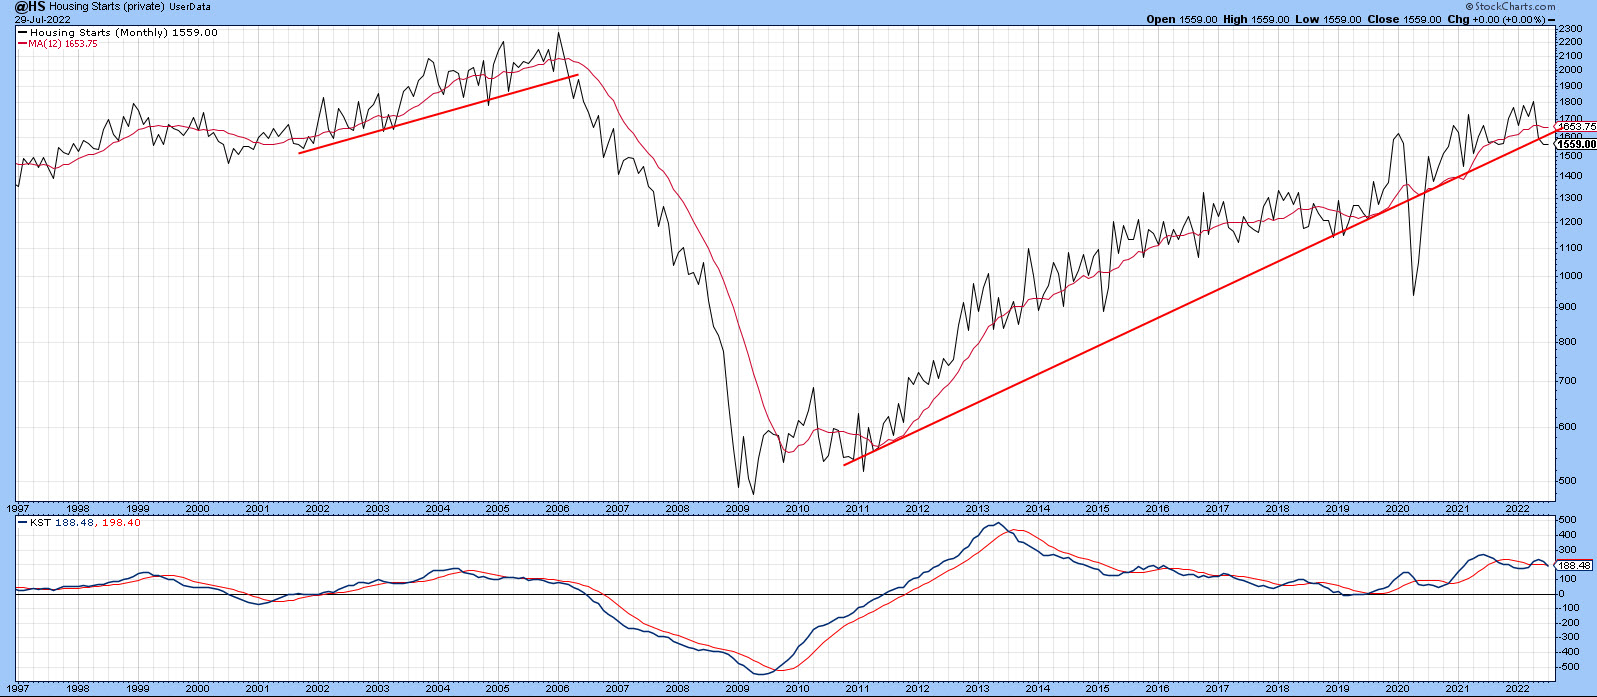
The latest June data for housing starts showed a slight decrease, but not enough to decisively break that solid trendline that began in 2009. Note that the line is also close to the moving average, which has the effect of reinforcing its ability to reflect the trend. The chart also reveals that the HMI peaked in November 2020, whereas the highest level achieved by housing starts was set in April of this year. That's important because the HMI data for July dropped sharply and violated its 2012-2022 support trendline. This action indicates that a downward cycle is now underway.

Charts 2 and 3 show that the long-term KST for both series is in a negative mode. Once again, we can see the leading characteristics of the HMI, since its momentum has been zig-zagging down for some time and is much closer to its equilibrium point than the KST for housing starts. Given the sharp break and leading tendencies of the HMI, it seems very likely that the housing start data will soon violate its secular up trendline. From an overall economic and housing point of view, that is not encouraging, as we look to this sector to turn up ahead of a growth slowdown or recession ending.
What are the Housing ETFs Telling Us?
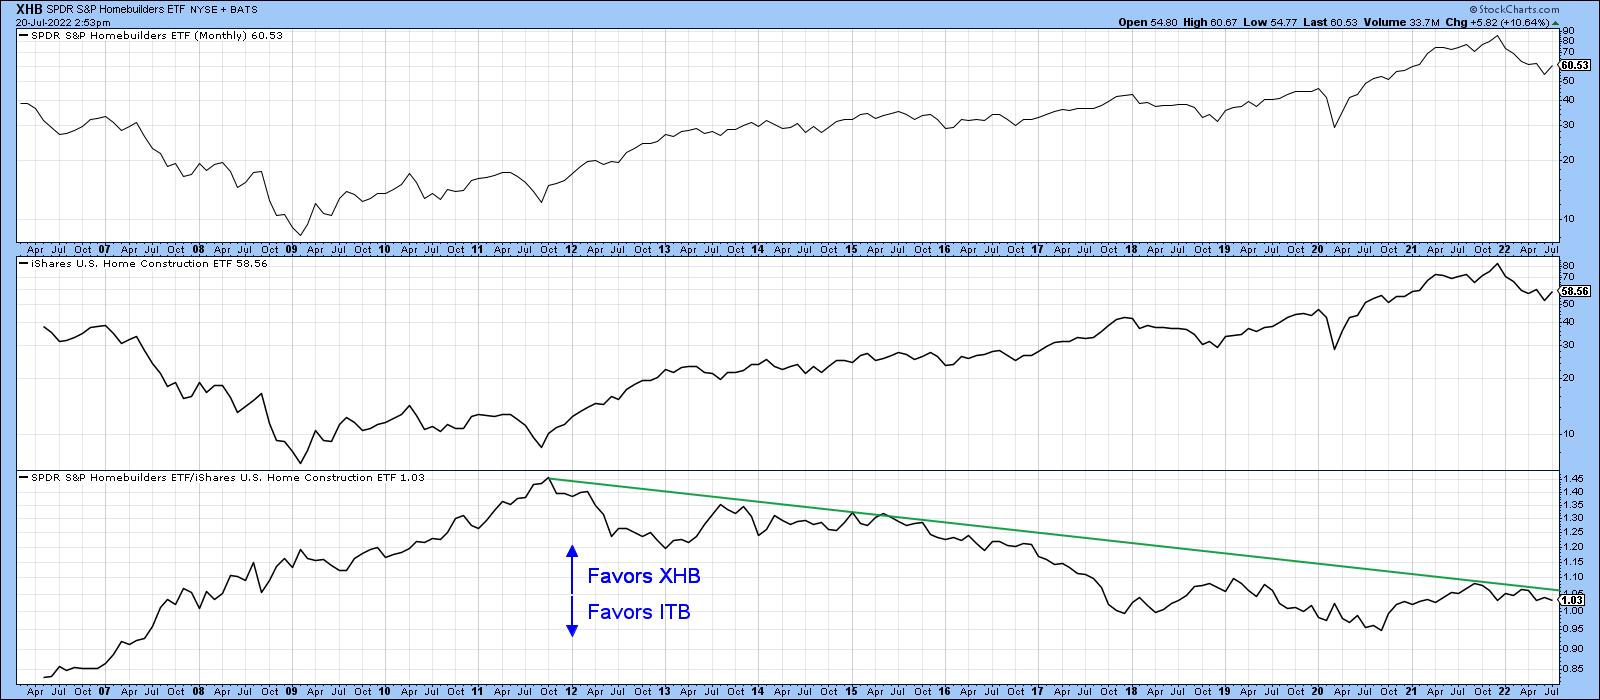
There are two principal ETFs exposed to the housing industry: the SPDR Homebuilders (XHB) and the iShares Home Construction (ITB). The XHB is a purer play because it has a 45% exposure to building products, as well as 40% to household durables. The ITB, on the other hand, has a much more limited 13% allocation to homebuilders themselves, as most of its exposure (67%) is devoted to household durables.
Both act in a similar manner, as demonstrated in the to two panels of Chart 4. However, the XHB has been under-performing since late 2011. That may be about to change, as the ratio between them is very close to its secular down trendline.
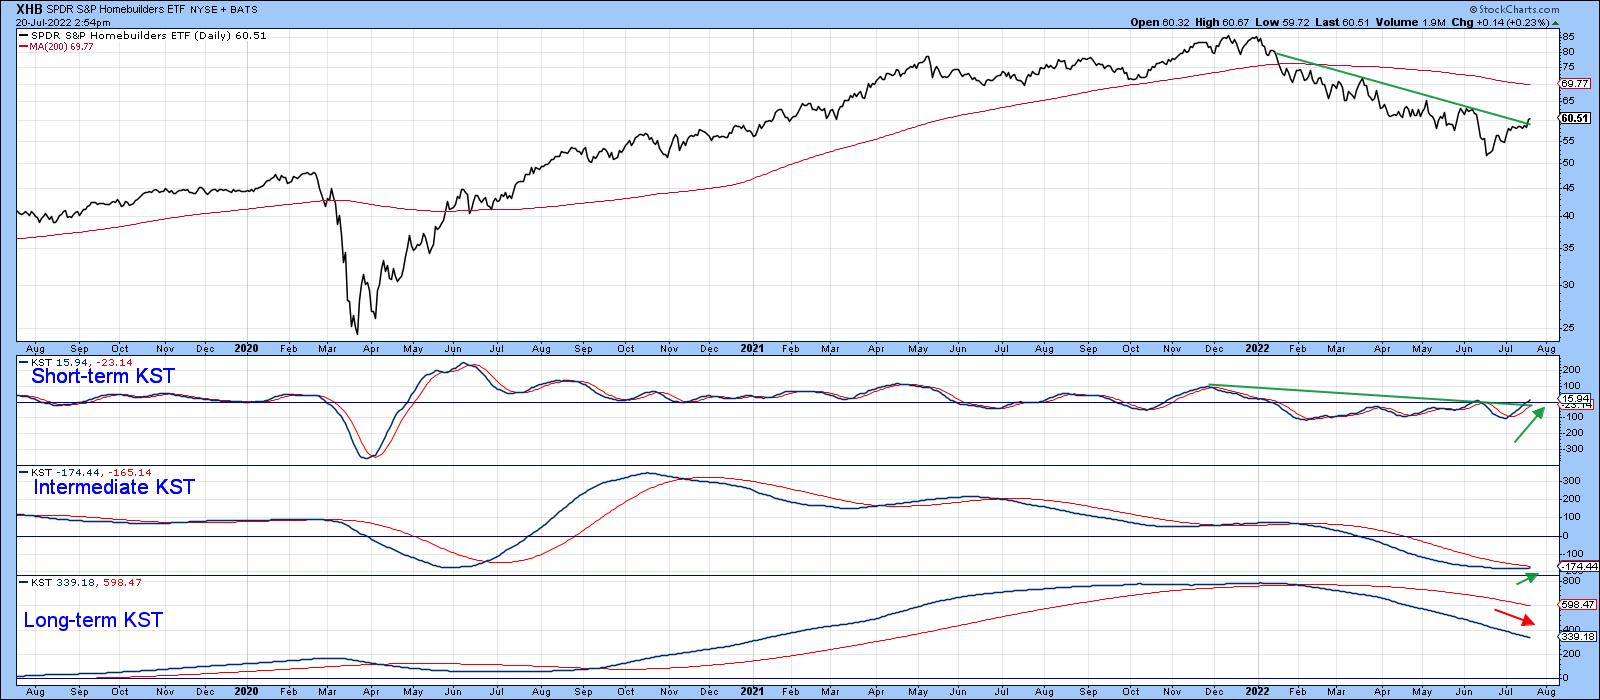
The XHB is again featured in Chart 5, where it is apparent that it peaked around the same time as the HMI. The price has since dropped close to 40%, so it has already factored in a lot of the bad news. The long-term KST, which monitors the primary trend, is still negative and sets an overall bearish mode. However, the fact that the price has rallied in the face of the very bad HMI news is a definite positive, which justifies the tentative reversal in the intermediate KST. A positive down trendline penetration by the price itself and the ability of the short-term KST to tentatively rise above its equilibrium level suggests that the mid-June bottom is going to hold . The ability of prices to rally in the face of bad news is definitely a good sign and encouraging first step. However, it is premature to call a primary trend reversal, as there is no strong technical evidence for that at present.
Good luck and good charting,
Martin J. Pring
The views expressed in this article are those of the author and do not necessarily reflect the position or opinion of Pring Turner Capital Groupof Walnut Creek or its affiliates.