Energy Gets a New Lease on Life
Back in June, I wrote an article entitled Are Commodities Losing their Mojo?It drew attention to the fact that some long-term indicators were pointing to at least a temporarypull-back in prices. That process is already underway, but the article also pointed out that energy usually lags other industrial commodity prices at market peaks. We can see that from Chart 1, which compares the long-term smoothed momentum (KST) of the CRB Spot Raw Industrials to that for crude oil.
The solid arrows demonstrate that oil usually lags the Index. The dashed one indicates the sole exception. The KST for the CRB peaked a few months ago and the Index dropped below its 12-month MA. These are two indicators amongst many that tell us that commodity prices in general are in a primary bear market. That said, it is evident the KST for the oil price, based on July data, has started to tick over, but not sufficiently to conclude beyond a reasonable doubt that the game is over.

In that respect, Chart 2, which shows preliminary August data (remember, it's not month-end yet), reveals that the KST has up-ticked slightly, with the price itself is right at its 12-month MA. A real test of the bull market is likely to take place soon. That's because the price recently experienced a whipsaw move above that green resistance trendline at around $105. False breakouts are often followed by above-average moves in the opposite direction to the breakout. Consequently, it's usually a good idea to see that they are confirmed by other trend-reversing technical evidence. In this case, a negative 12-month MA crossover would do the trick, and that seems unlikely at the moment.
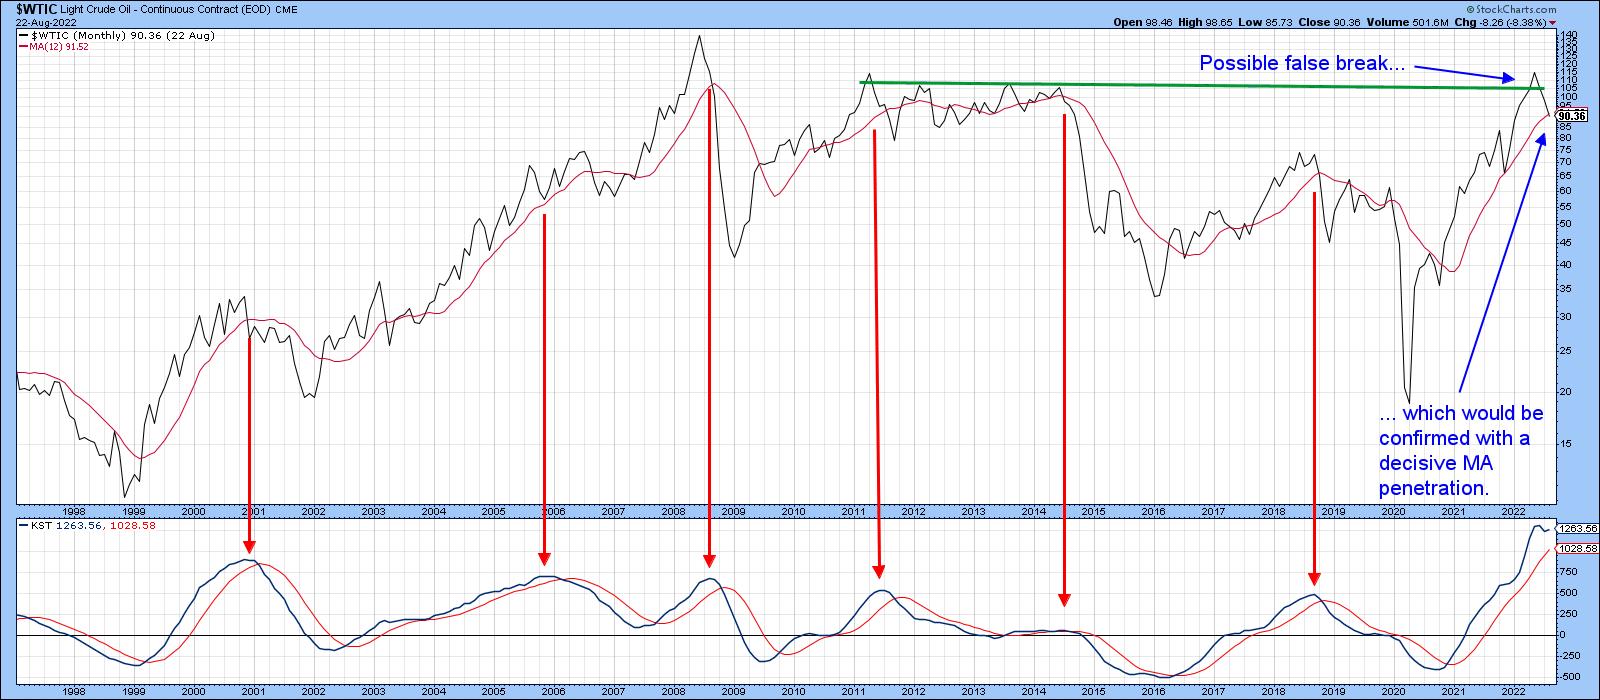
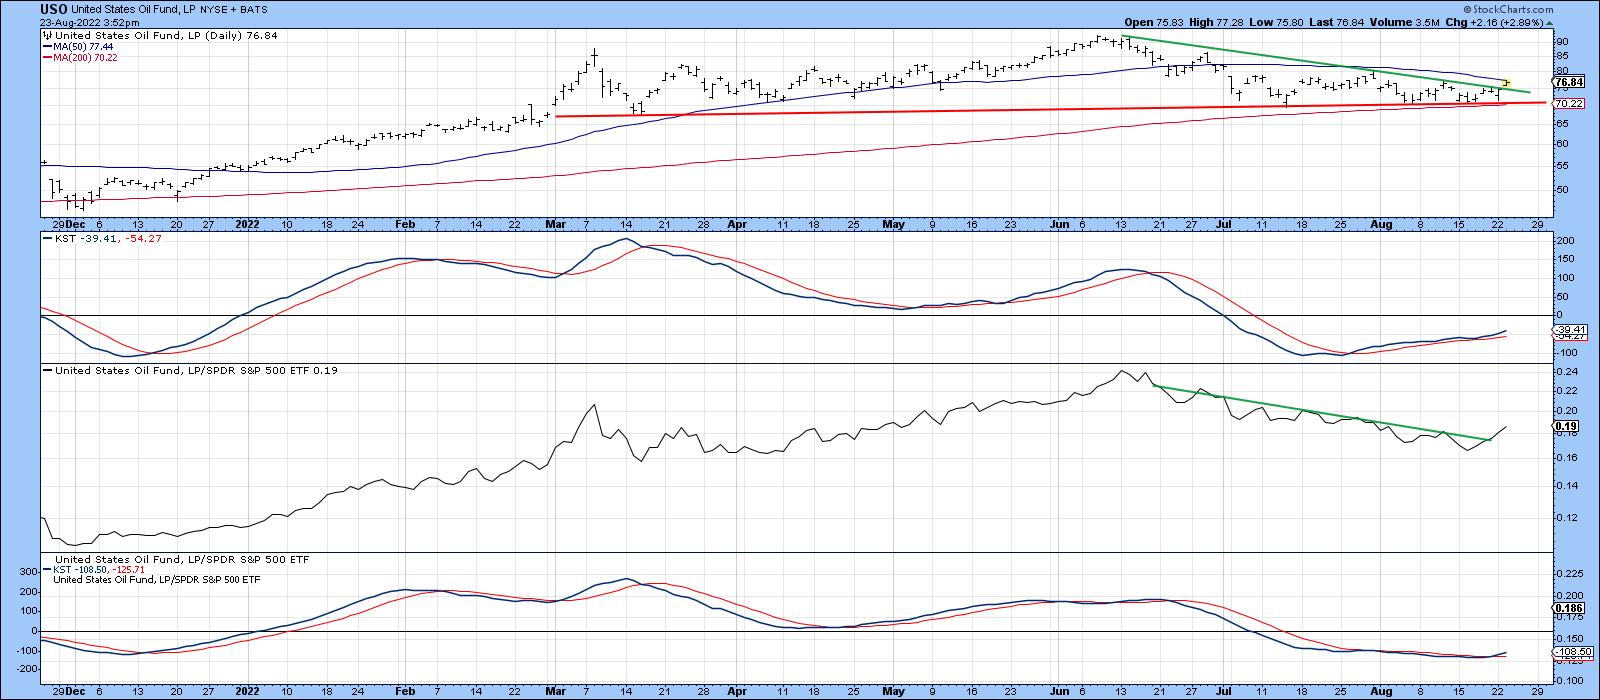
Chart 3 shows that the United States Oil Fund (USO) has broken above its June/August down trendline, having successfully tested its 200-day MA no less than four times in the last 6 weeks. Note also that the RS line, comparing its performance to the S&P Composite in the third window, has also experienced an upside breakout. Both daily KSTs are in a rising trend, which adds a further positive underpinning. Let's not forget the extreme positioning of the long-term KST for the oil price in the previous chart. That tells us this week's breakout is a high-risk one and we should be prepared in case it turns out to be false. The signal, in this case, would be a drop below the 200-day MA at $70. The MA is also in the area of the 2022 red support line. If oil has joined commodities CRB Spot Raw Industrials in a bear market, a false upside breakout would be a perfectly normal phenomenon.
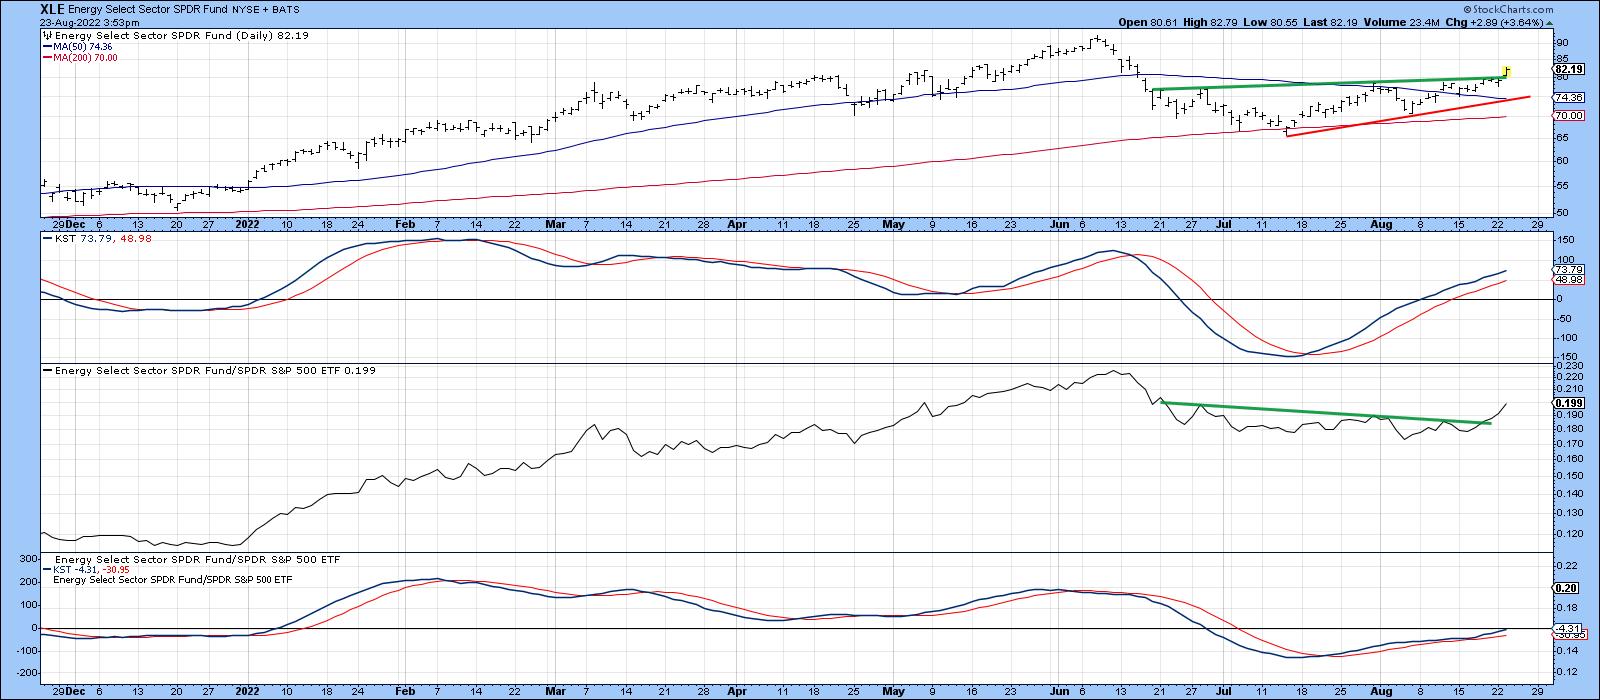
I like to see commodity price moves supported by the shares that deal in that commodity. Chart 4 certainly supports this week's upside break. It features the SPDR Energy ETF (XLE), and ot paints a similar picture to that of the USO, in that both the absolute and relative prices have broken above resistance trendlines. In this case, though, the break is stronger because the breakout trendlines represent the top of a small 2-month base. Also, the XLE is trading above its 50-day MA, whereas the USO is right at its average.
Even so, as with the USO, we have to be mindful of the possibility of a false breakout, by making sure that the XLE remains above its 50-day MA and the red up trendline at around $74.
Further support for the oil breakout comes from Chart 5, which shows that commodities in general are also experiencing an upside breakout. We have to be a bit careful on this one, since the DBC Commodity ETF has a substantial weighting in energy; that means there is a bit of double counting going on. The lower panel of the chart features a ratio between the Goldman Sachs Natural Resource and the SPDR Consumer Staples ETFs IGE/XLP). A rising relationship tells us that investors prefer commodity-driven equities over defensive stocks, represented by the slow moving consumer staples. The two series often move in tandem, thereby offering a check on each other. Occasionally, it is possible to construct trendlines for both series, which, when violated, result in a trend change for the DBC. Tuesday saw the fourth joint upside break since late 2020.
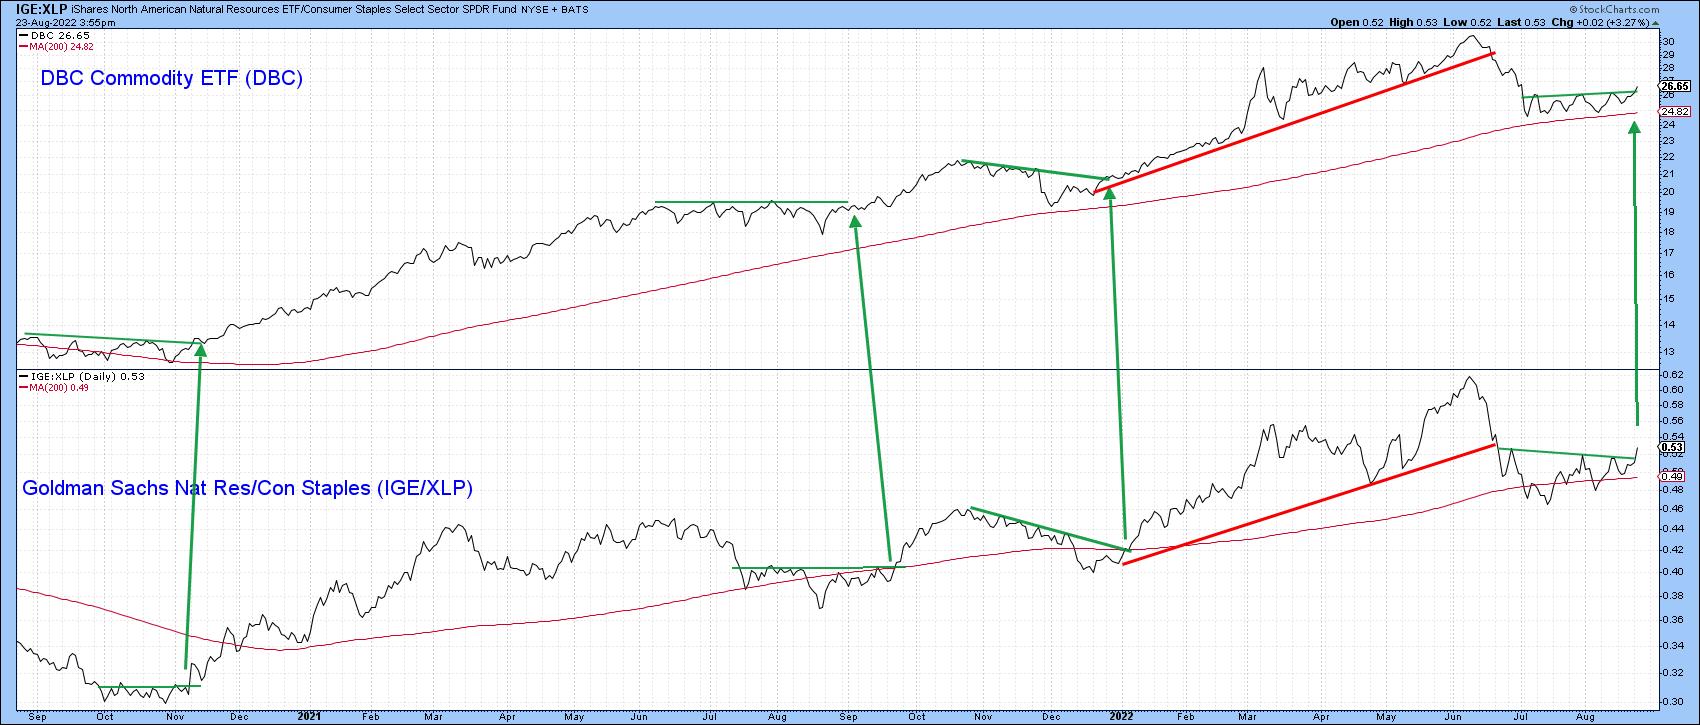
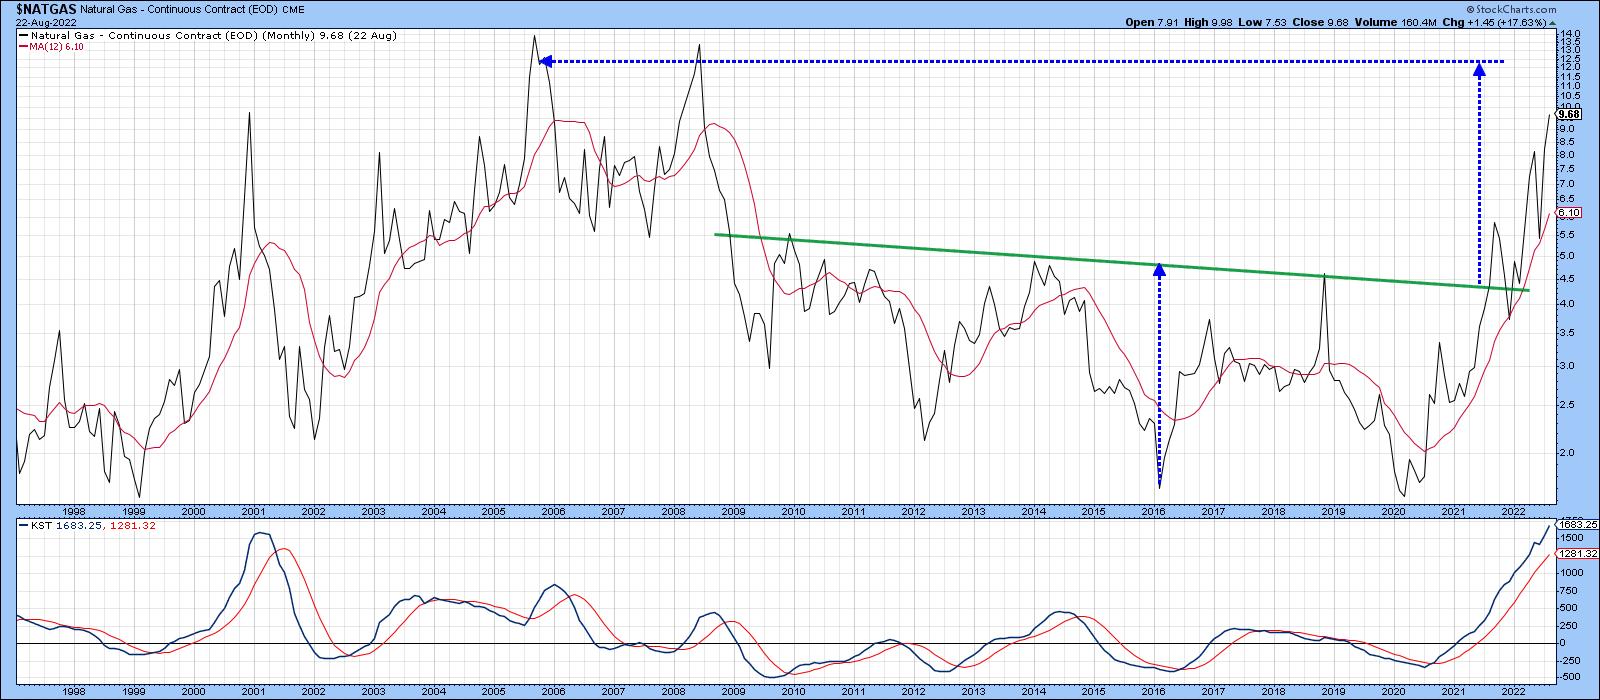
Chart 6 rounds out our analysis by featuring the continuous natural gas contract, the price of which has recently reached a new high. Late last year, it broke out from a 20-year base, offering a minimum ultimate upside objective of $12.50. It certainly supports the recent positive action by the oil price and oil share areas, but we should also bear in mind that this is an unusually volatile commodity and, therefore, easily prone to a false sense of strength or weakness.
Conclusion
Commodities as an asset class are in a primary bear market. However, the oil price traditionally lags, and a short-term buy signal has been triggered for both the commodity and shares. Since those signals are coming at a time when long-term momentum is overextended, we should be particularly aware of the higher-than-normal possibility of a false breakout.
Good luck and good charting,
Martin J. Pring
The views expressed in this article are those of the author and do not necessarily reflect the position or opinion of Pring Turner Capital Groupof Walnut Creek or its affiliates.


