Good Inflation News is Helping Stocks Move Through Resistance -- But is It Enough?
The summer rally has enabled several indexes to push through important resistance, but, since there was a lot of backing and filling at higher levels earlier this year, there are several places where even more resistance is apparent.
If you want to be bullish, for instance, take a look at the lower window in Chart 1. Here, we see that the S&P completed a downward-sloping head-and-shoulders top, but the Index has crossed back above the neckline, suggesting that the top has been cancelled. On the other hand, the upper window reveals that a different, but perfectly legitimate, upward-sloping head-and-shoulders top is still intact. One of the keys to spotting a head-and-shoulders failure is to watch for the price to cross back above the line joining the head with the right shoulder. In this instance, that line is currently resting at around 4,330. As luck would have it, that's also where the 200-day MA is residing. Since both represent dynamic levels of support or resistance, their appearance at the same level reinforces that zone just above 4,300 as a very significant one.

The NASDAQ Composite has also broken back above its breakdown trendline. This morning, The Wall Street Journal announced that the NASDAQ is now in a bull market, as it has risen 20% from its low. If only things were that easy! Chart 2 shows that the Index has yet to clear the trendline joining the head with the right shoulder, not to mention the 200-day MA at 13,500.
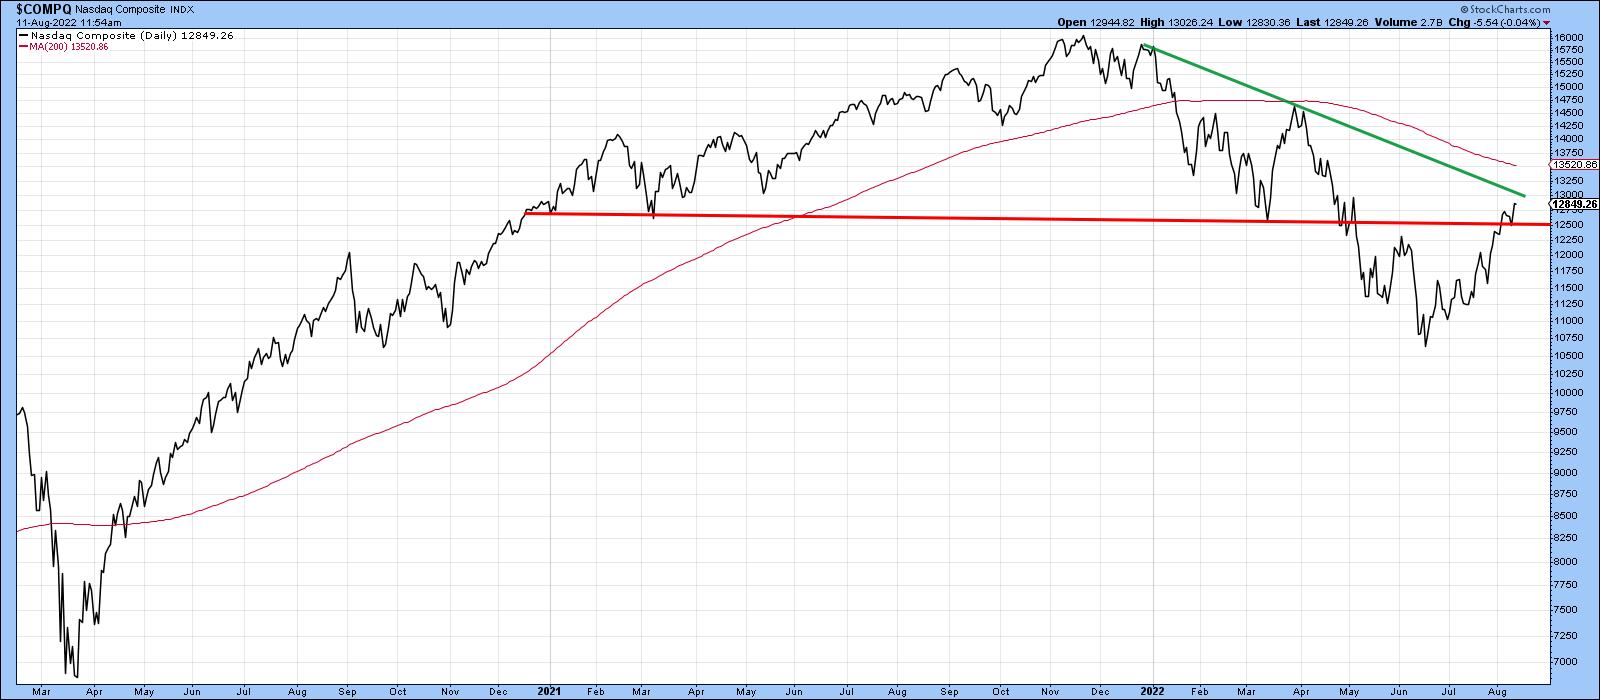
Chart 3 lays out the battle lines for the NYSE Composite, as the Index has just broken above the extended neckline of a downward-sloping head-and-shoulders top for the second time. Others may disagree with my assessment, as the various rallies and reactions open up many possibilities of identifying the top. Based on the criteria determining the significance of a trendline, this one seems to me to fit the bill. It's lengthy, has a narrow angle of descent and been touched on numerous occasions, thereby indicating its importance as a dynamic level of support. Due to its large 2022 drop, the Index is still some way from the head/right shoulder trendline and 200-day MA at around 16,100.
KST momentum is overbought, but still rising. If this is a bear market rally, it's likely to roll over and trigger a sell signal pretty soon. All the other downside reversals since the bear market began were followed by declines. Note that, on the left hand part of the chart, when the primary trend was bullish, sell signals did not have much power at all. If we really did hit bottom in June, this indicator would be expected to move substantially higher above its bear market range.
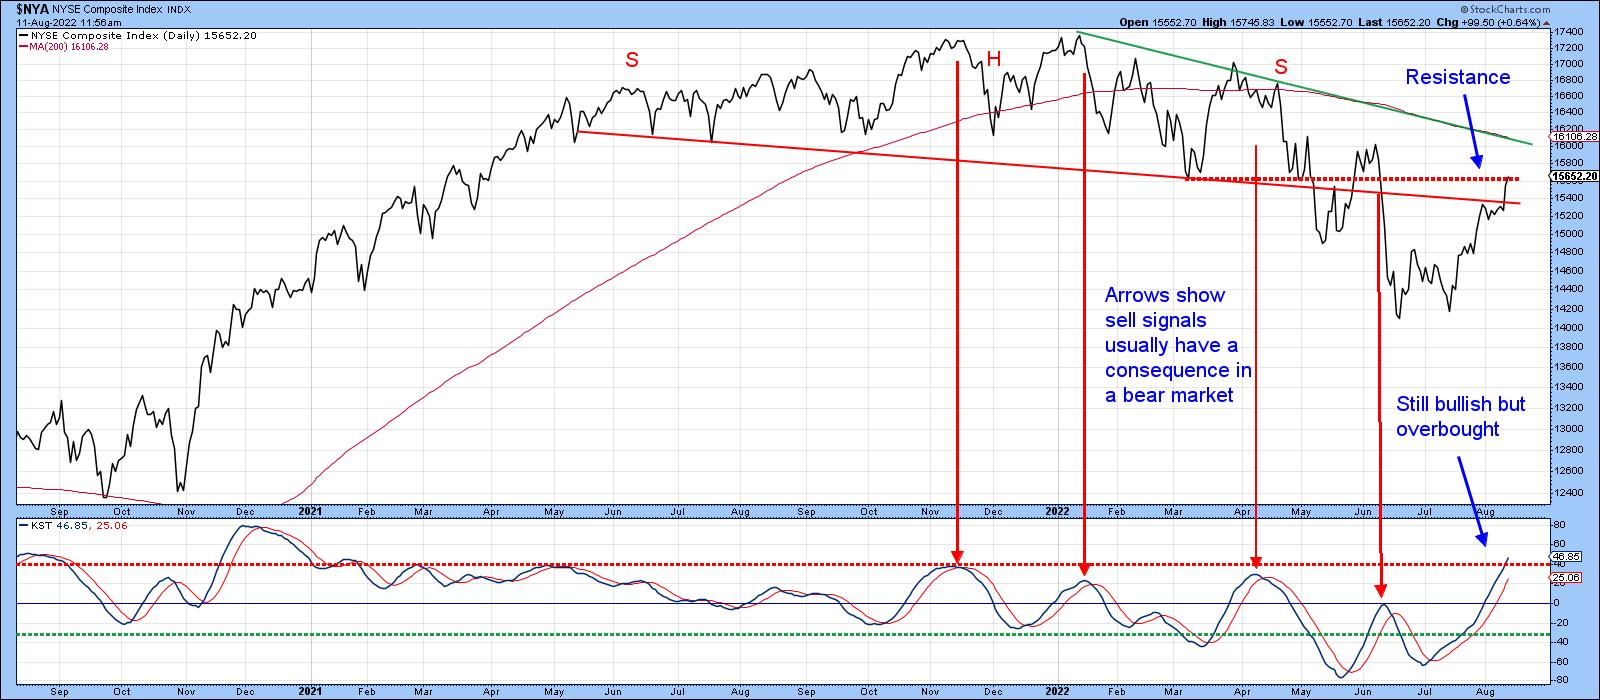
Chart 4 underscores additional resistance, this time in the form of retracements. Here, you can see that the post-June advance has retraced 50% of its bear market decline. Interestingly, the Fibonacci 61.8% retracement would take the Index back to its early June high and 200-day MA.
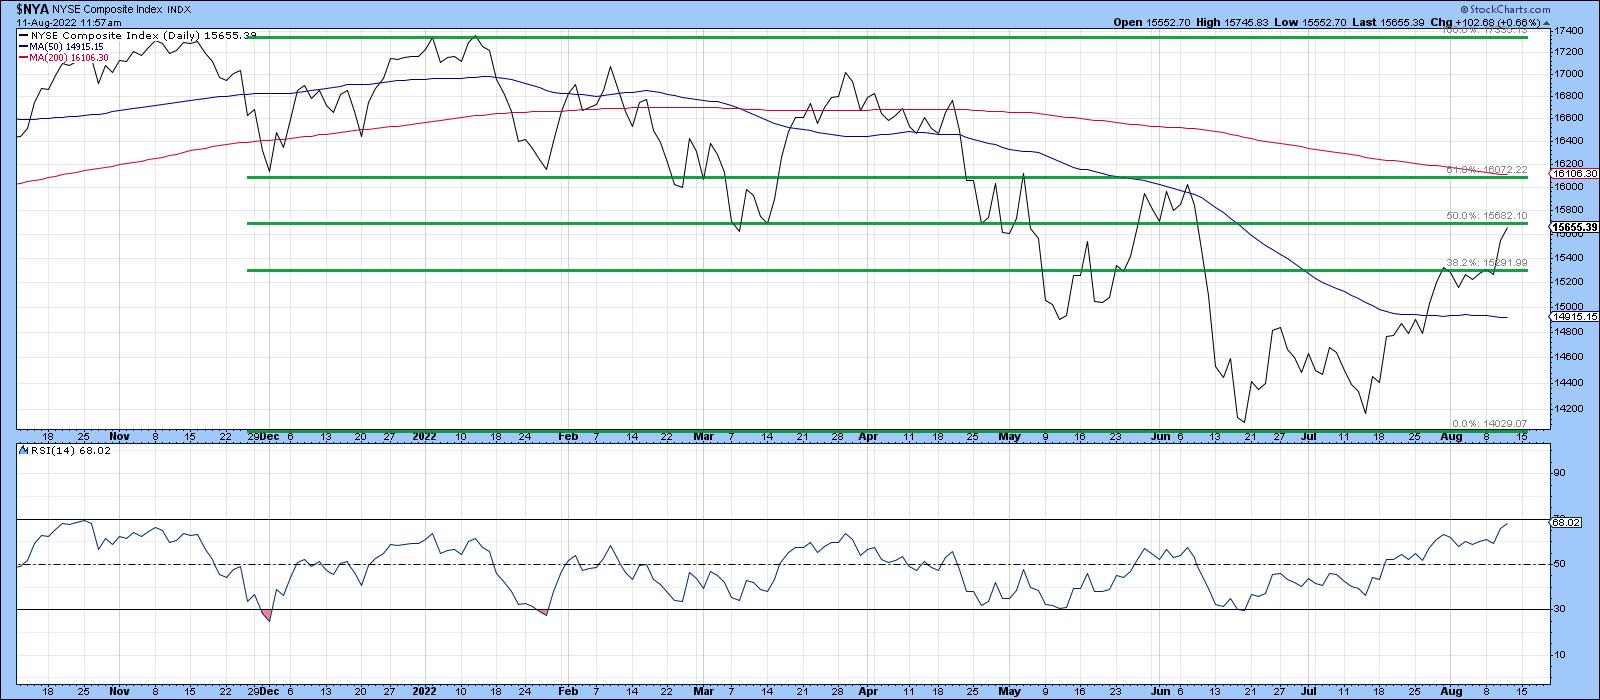
The 14-day RSI last saw an overbought condition at the 70 level back in November. Its failure to get close to such a reading, since the Index peaked earlier this year, is a bear market characteristic. If the Index pushes through and holds above the 50% retracement line, the RSI could always push firmly into overbought territory. However, as it stands right now, that has not happened.
Watch Tesla
I don't usually get into individual stocks, but I do find Tesla's recent price action to be quite interesting. As one important icon of the 2020-2022 bull market, it may provide clues as to whether a new primary uptrend did begin in the early summer or if the bear is in hibernation.
Chart 5 shows that, between late 2020 and 2022. the price traced out a large head-and-shoulders top. Instead of selling off sharply, it then experienced a trading range and broke back above the extended neckline. The price recently turned back from its 200-day MA and is now challenging that breakout point again. The RS line is replicating this action.
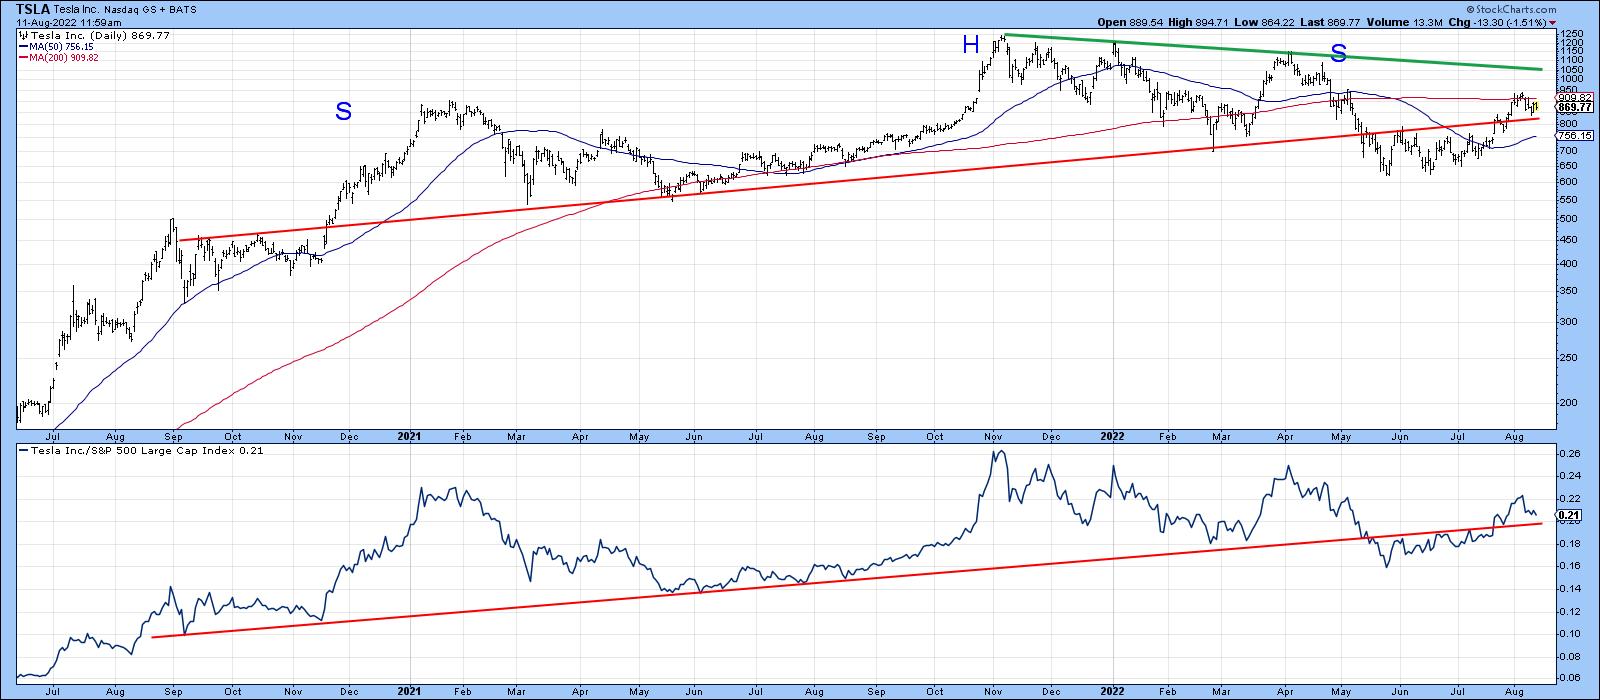
It's vitally important that the price hold above that extended neckline; otherwise, it will experience a double false breakout, the kind of action shown in Chart 6 for the 1946 top in the Dow. Remember, false breakouts when confirmed are usually followed by an above-average move in the opposite direction to the breakout.
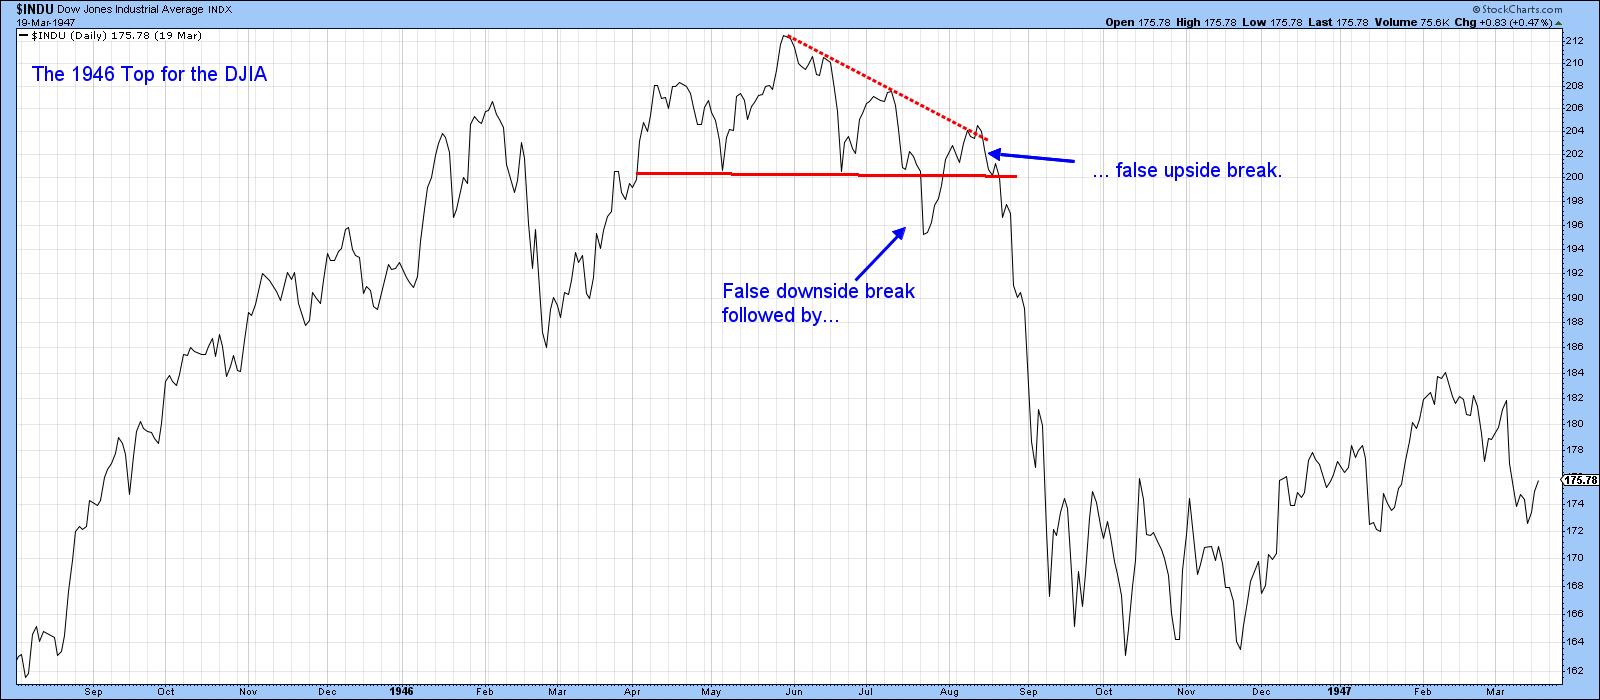
In this case, we would have a double false breakout, which would have an even stronger negative connotation -- if it happens.
Good luck and good charting,
Martin J. Pring
The views expressed in this article are those of the author and do not necessarily reflect the position or opinion of Pring Turner Capital Groupof Walnut Creek or its affiliates.


