Indexes Back to Their Breakdown Points; Should We Pop the Champagne If They Go Through?
The rally since mid-June has taken several indexes back to their extended breakdown trendlines, which mark one demarcation point between bull and bear. Chart 1, for instance shows that the NASDAQ completed a top in May and then followed through with further weakness. By mid-June, the Index found a bottom and has been zig-zagging its way higher ever since; it now stands at resistance, as indicated by the extended breakdown trendline.

A very encouraging sign comes from the 10-day EMA of NASDAQ stocks above their 200-day MA, as it has successfully violated its 2-year down trendline. That suggests the bear market in this market measure is most likely over. The breakout would normally be expected to be positive for the index, but not necessarily so. That's because the two series diverge from time to time. For example, the 200-day 10-day EMA peaked in March of 2021, whereas the Index topped out eight months later in November of that year. What the trend break does suggest is that, going forward, the environment for the average NASDAQ stock will be improving, just as it was deteriorating between March 2021 and mid-June of this year. This action also increases the odds the NASDAQ Index can rally above its extended neckline.
That said, take a look at the 2007-09 bear market for the NYSE Composite. The Index completed a head-and-shoulders top in early 2008, sold off and subsequently rallied back to the extended neckline. However, it was unable to surpass it. You can also see that the 10-day EMA of the percentage of NYSE stocks above their 200-day MA had also violated an important down trendline. That suggested the NYA would likely break above the extended neckline, which would have gone a long way towards cancelling the top. However, hindsight tells us that it was a bear market environment, where deception reigns and normally positive signals give way to disappointing ones.
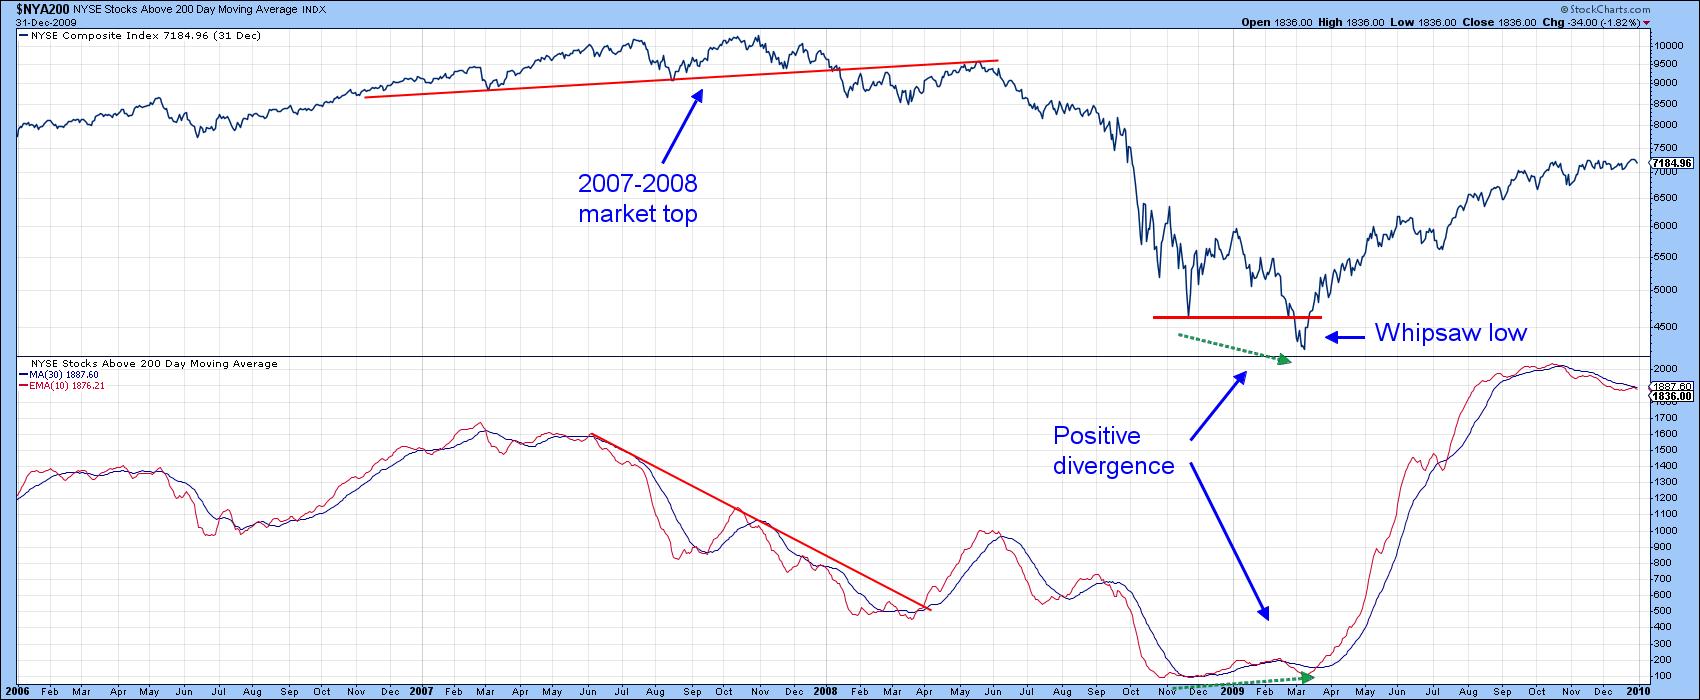
Action at the actual 2009 bottom was far more convincing, because the Index temporarily took out its late 2008 low, but the EMA of the number of stocks above their 200-day MAs failed to confirm, thereby setting up a large positive divergence. The Index may have registered a new low, but it was not being accompanied by more stocks dropping below their 200-day MAs.
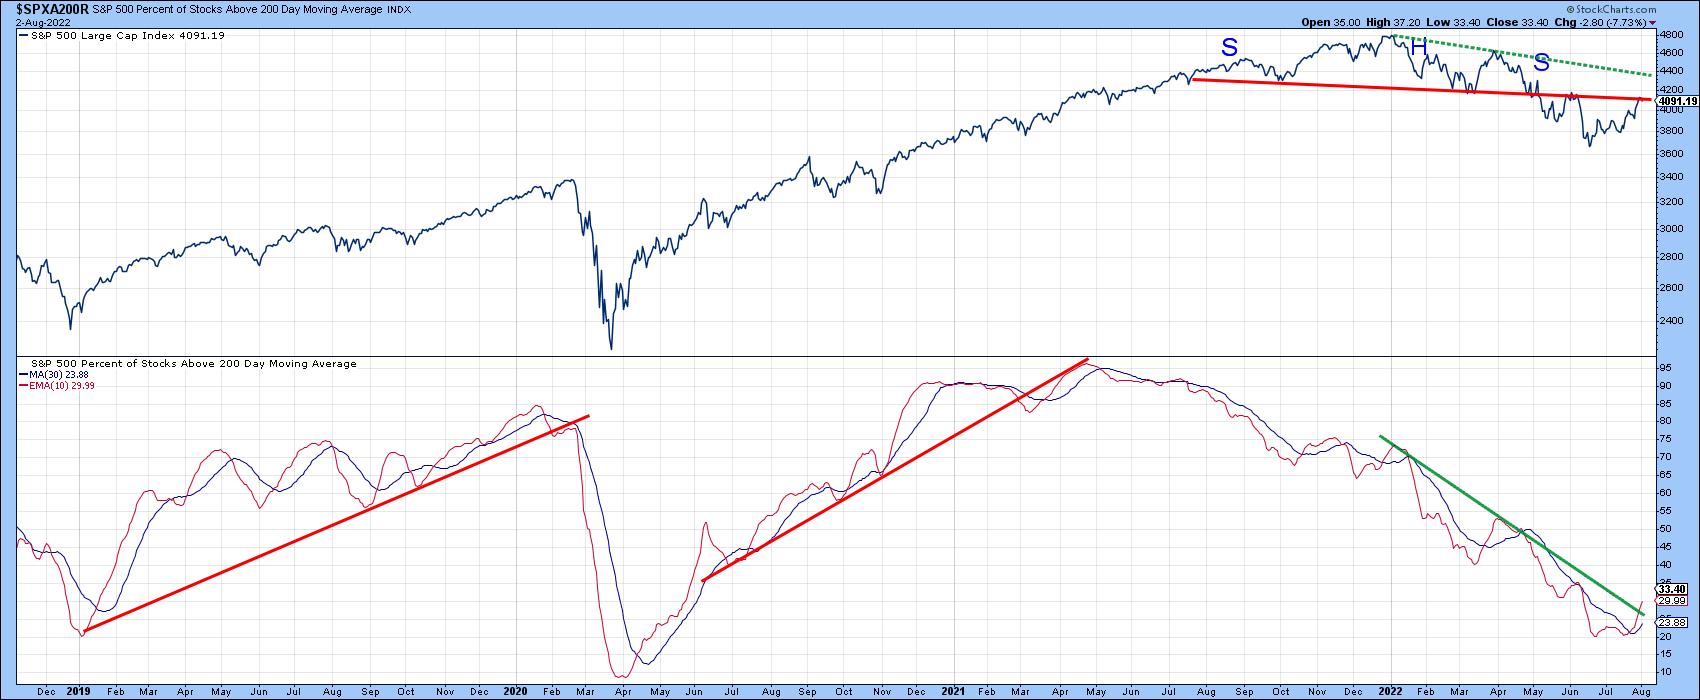
Chart 3 shows that the S&P also sports a head-and-shoulders top with a rally back to the neckline. In any situation, a price that is able to recapture the neckline increases the odds that a pattern will fail. An even more important juncture point, though, comes from the line joining the head with the right shoulder. The significance depends on the angle of descent; the shallower the angle, the stronger the resistance and the greater the importance of the line. In this instance, the dashed trendline has a fairly shallow angle of descent, so it holds quite a bit of significance if penetrated. Such a breakout would involve a rally that can hold above the 4,400 area.
One encouraging sign this week has been the tentative violation of the down trendline for the 10-day EMA of the S&P percentage of stocks above their 200-day MAs.
Bear markets are notably deceptive, though, which is why I always want have the weight of the evidence on my side before concluding that the bull has returned. In that respect, take a look at the 1946 top for the Dow in Chart 4. It starts off with a perfect head-and-shoulders distribution pattern, followed by a false move to the downside. Then, just after it looked as if the Index was going to violate the trendline joining the head with the right shoulder, it drops below the neckline once again.
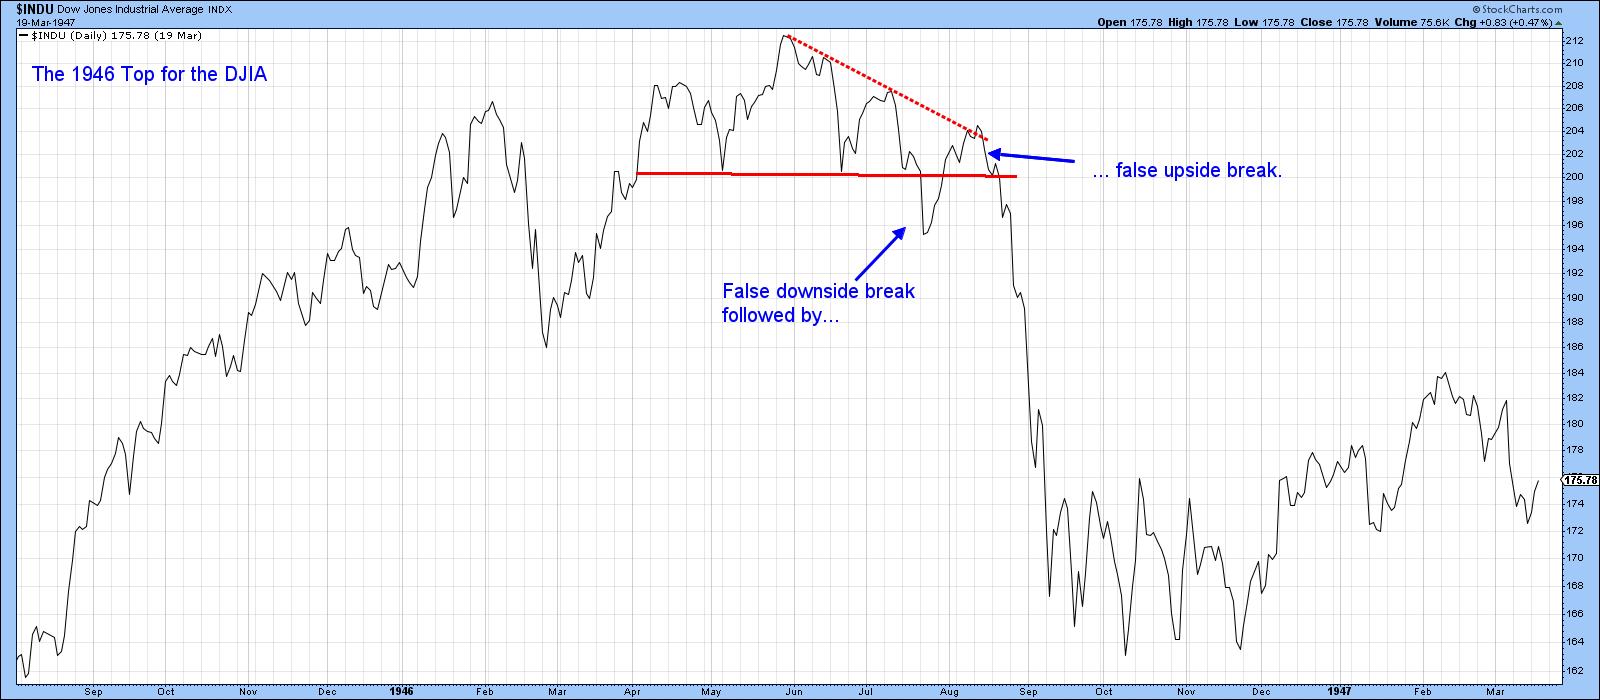
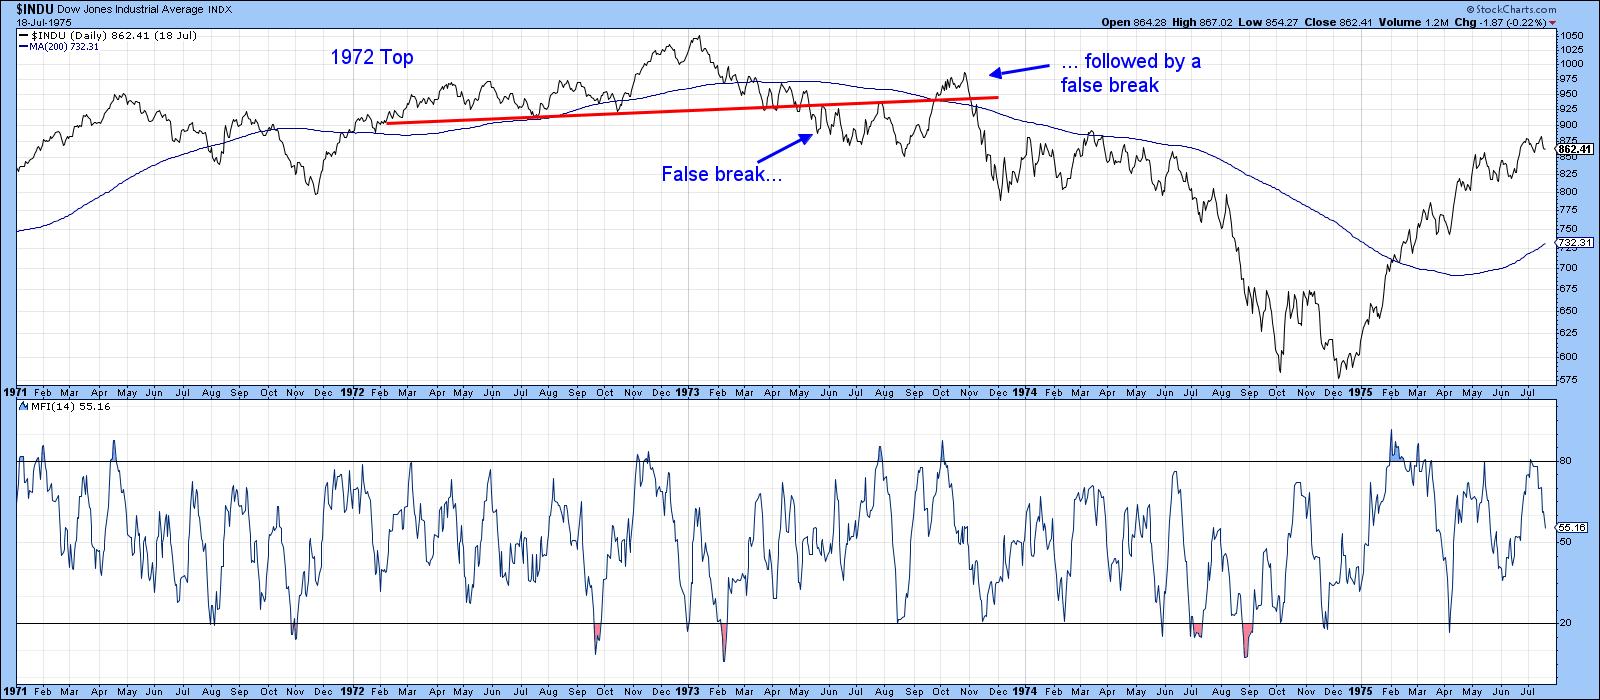
Chart 5 shows a similar fake breakout for the Dow during the formation of the 1972-3 top. In this case, the Index pushes its way back above the extended neckline, but is unable to hold there. Note that both the 1946 and 1972 whipsaws were directly followed by the worst part of the bear market.
I am not forecasting that's going to happen in the current situation, because I honestly do not know. What I do know is a basic technical principle that says, "A trend is a trend is a trend." That means we should assume that the current trend is in force until the weight if the evidence shows or proves that the trend has reversed. We have lots of evidence that the intermediate trend is positive, but lack the proof that the primary trend is also bullish. Enjoy the rally, but be careful.
Good luck and good charting,
Martin J. Pring
The views expressed in this article are those of the author and do not necessarily reflect the position or opinion of Pring Turner Capital Groupof Walnut Creek or its affiliates.


