Bearish Weekly Dollar Candles May Help Change the Energy Inflation Dynamic
It is a well-established fact that the dollar and oil prices move in opposite directions, most of the time. Perhaps a more accurate way of saying the same thing is to observe that a rising dollar acts as a headwind for energy prices, while a falling one acts a tailwind for the same.
I mention this because, most weekends, I flip through a chartlist comprising weekly bars and candlesticks. Last week provided an almost textbook-perfect example of a bearish dark cloud cover for the Invesco US Dollar Index Bullish Fund (UUP). This is shown in Chart 1, where we see last week's black candle gap up at the opening, but with a close that pushed the price more than halfway below the previous week's white real body.
Dark Cloud Cover patterns are not that common, but, in my experience, tend to be quite powerful since they reflect an abrupt change in sentiment -- a form of whipsaw, if you will. These patterns usually have a negative effect of between 5 and 10 candles. Since we are talking weekly price action, that should translate into a 5-10-week time horizon, or the potential for an intermediate price move. It's always a good idea to make sure that these formations are confirmed with additional technical evidence; in this case, that would happen with a violation of the 2022 up trendline and 10-week MA, currently just under $29. Note that, since the spring, peaks in the 9-week RSI have been trending down as the price has been moving higher. A trendline violation and negative MA crossover would therefore confirm those divergences.

Pound and Yen Sporting Bullish Weekly Hammers
I'll return to the dollar/energy price theme later, but, first, let's consider the pound and yen. The pound is featured in Chart 2. It is sporting a bullish weekly hammer, which may have the power to push the currency back above its down trendline and the 10-week MA. Note that both are in the same vicinity and, therefore, have the effect of reinforcing themselves.

The yen is in a similar technical position, having also experienced a hammer candle. A 5-10-week respite from the recent strong downdraft is therefore likely, which suggests a reflex rally is in the cards.
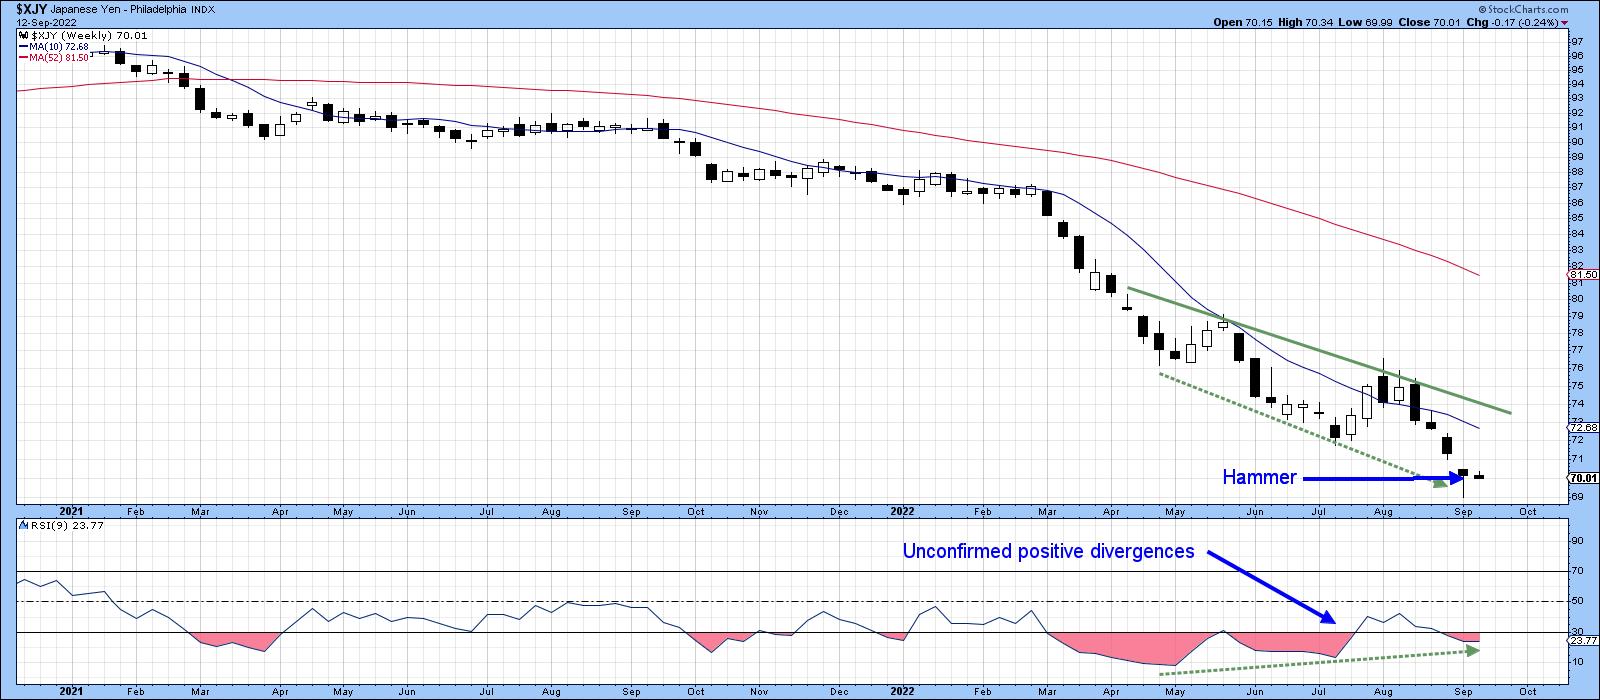
While these formations suggest that further near-term downside activity for the pound and yen is improbable and upside dollar action unlikely, there is little in the dollar's long-term technical picture to suggest the current primary uptrend is in danger of being reversed.
Oil Returns from the Brink -- or Does It?
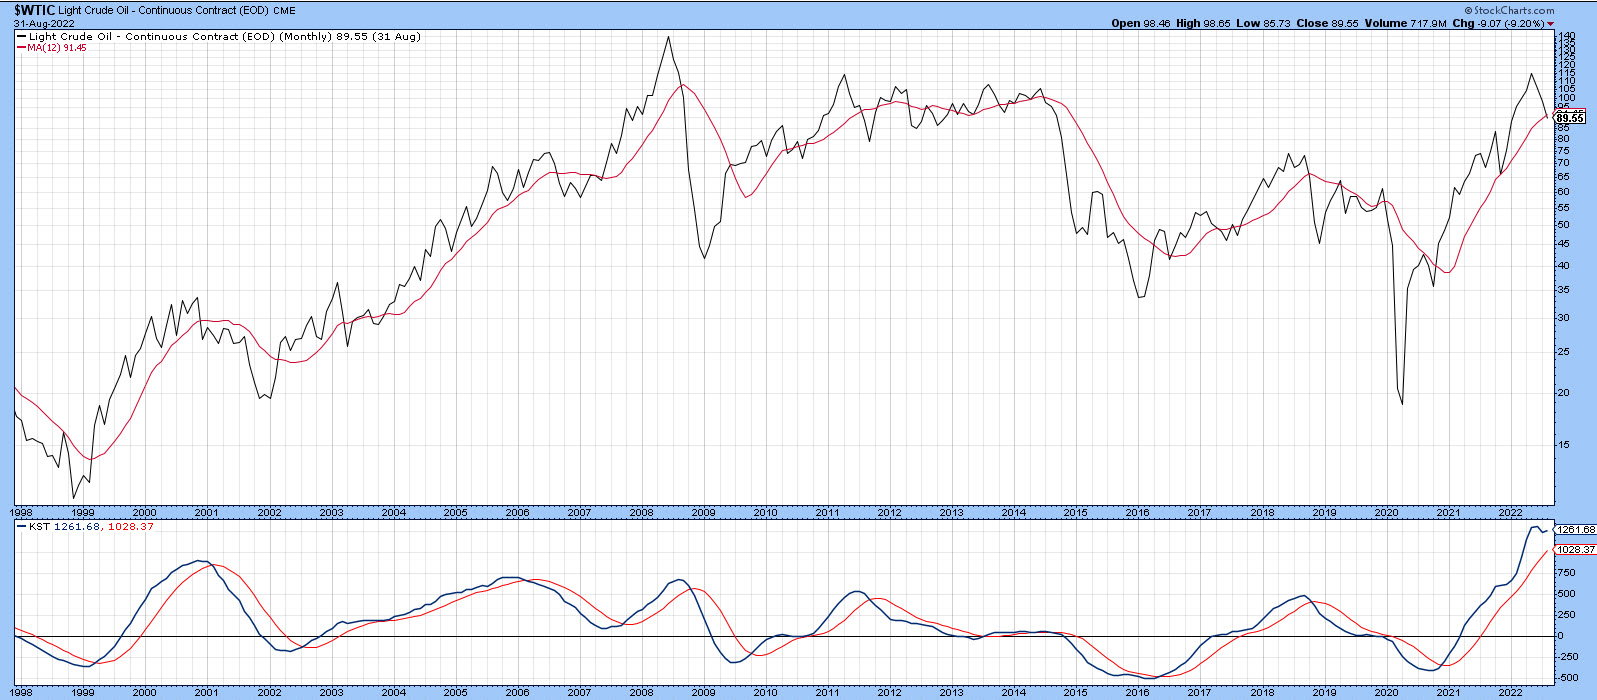
Most commodities look as though they have peaked on a primary trend basis, but, as I pointed out a few weeks ago, energy usually lags. If the dollar has topped out for a while, this potential weakness could provide a tailwind for oil prices. If not, then the bull market is probably over. Chart 4 shows that, at the end of August, the price of West Texas Crude was right at its 12-month MA and the long-term KST overstretched, but still above its MA. The trend is bullish, but at a crucial point.
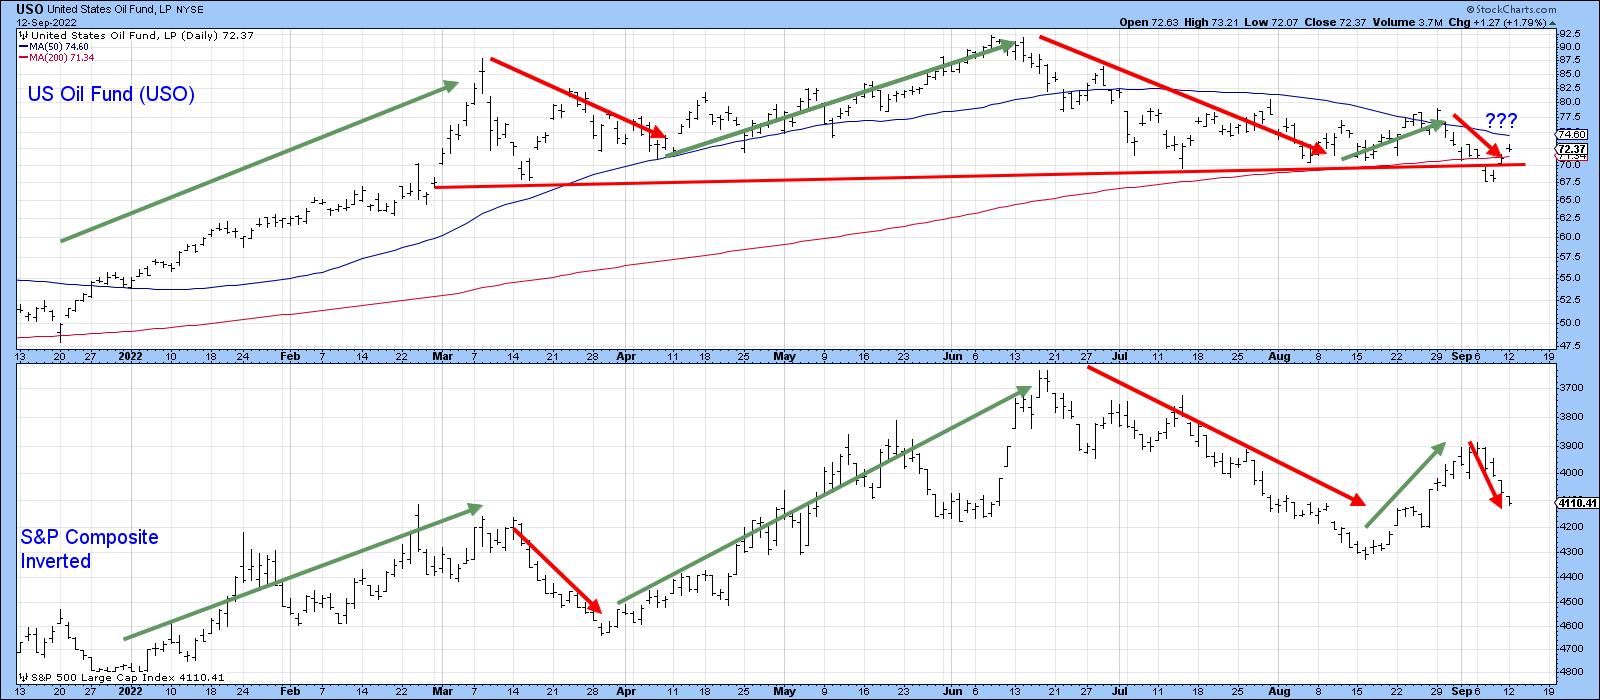
This extremely fine balance can also be appreciated from Chart 5, where you can see that the US Oil Fund (USO) recently dropped below its 200-day MA and the neckline of a head-and-shoulders top. Monday saw it cross back above these benchmarks, thereby hinting that the downside break may well turn out to be a whipsaw. Patterns that fail are usually followed by an above-average move in the opposite direction to the breakout. Consequently, the stakes are quite high, especially when the overstretched nature of the KST in Chart 4 is taken into consideration. There is little doubt, though, that a move above the right shoulder at the dashed green line in Chart 5 would represent a very bullish development, since it would confirm beyond a reasonable doubt that the downside break was a whipsaw.
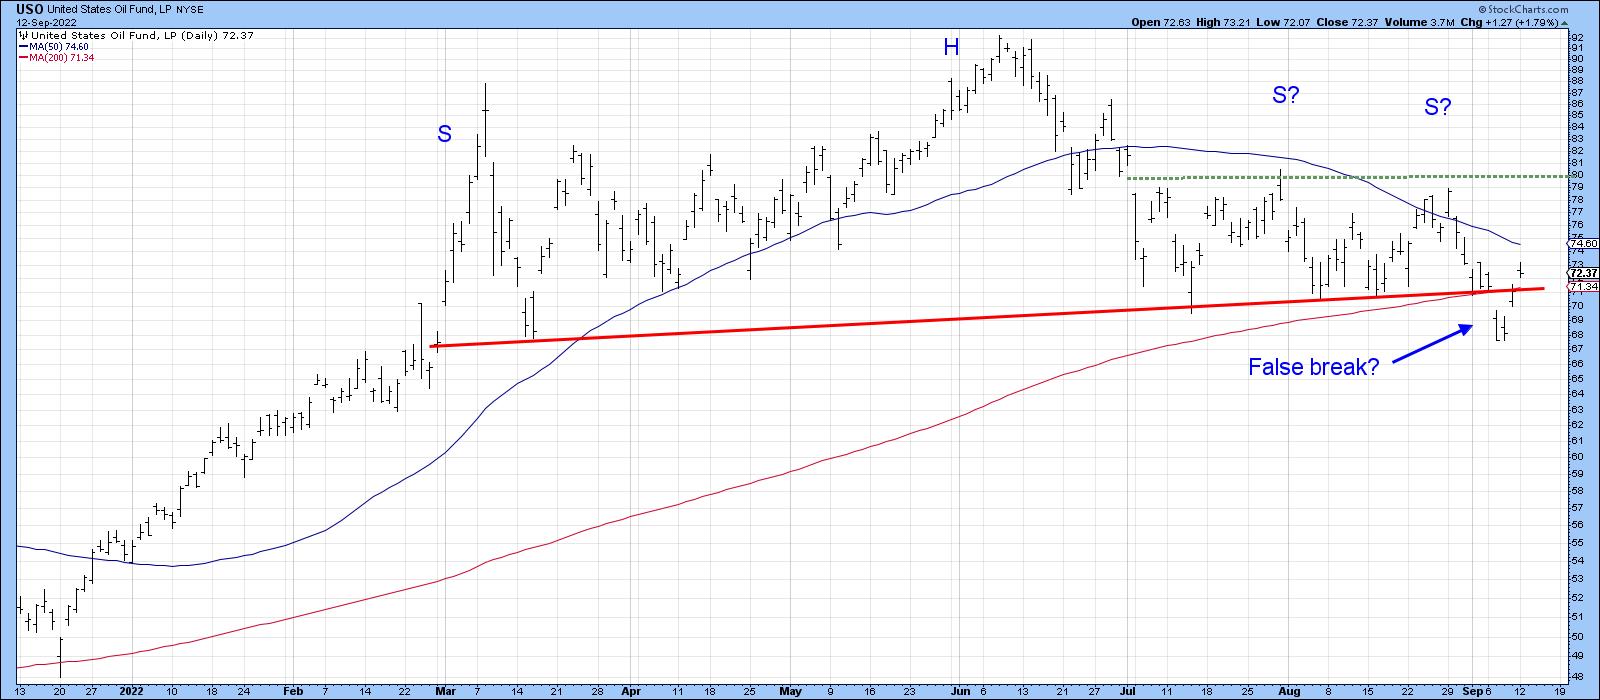
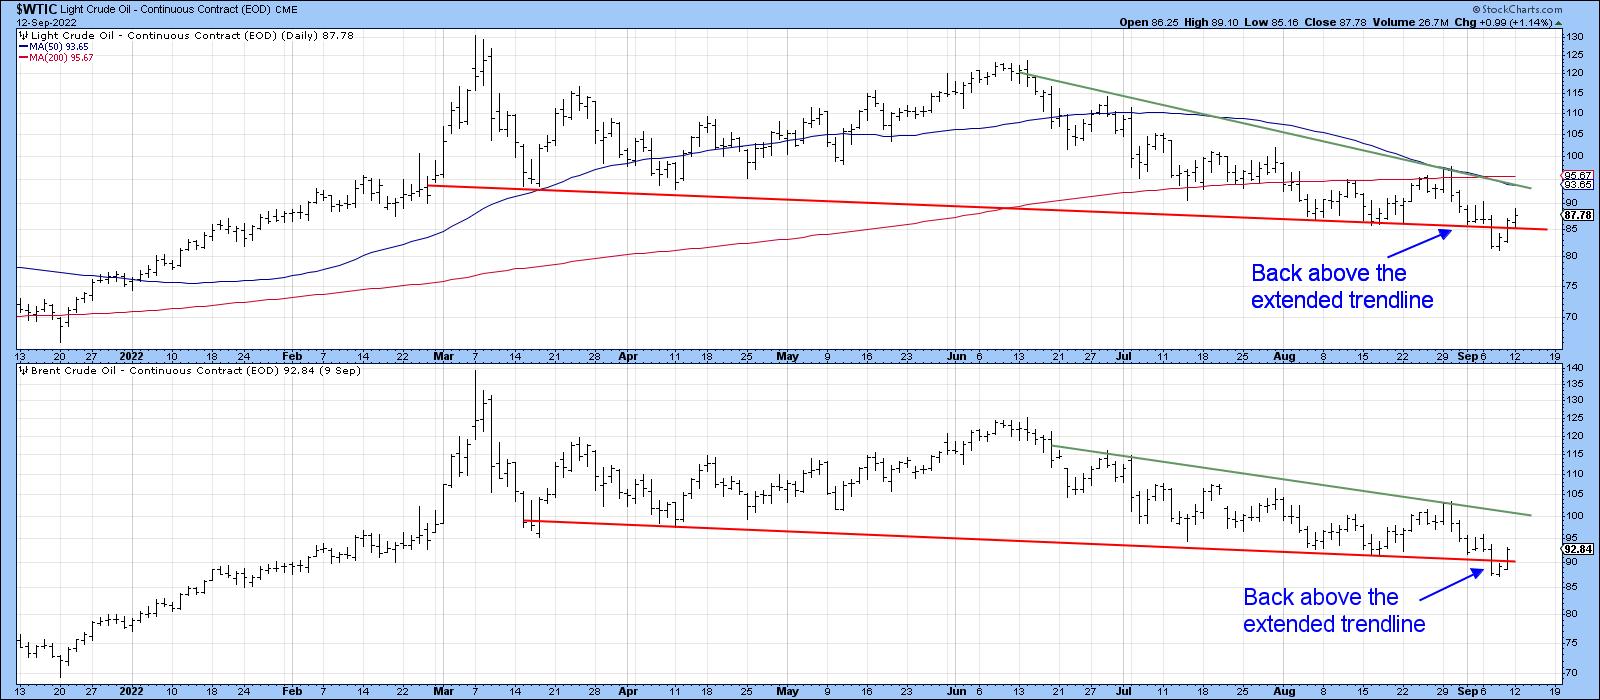
Chart 6 has a similar message, in that both West Texas and Brent crude prices also experienced what looks to be a false move to the downside.
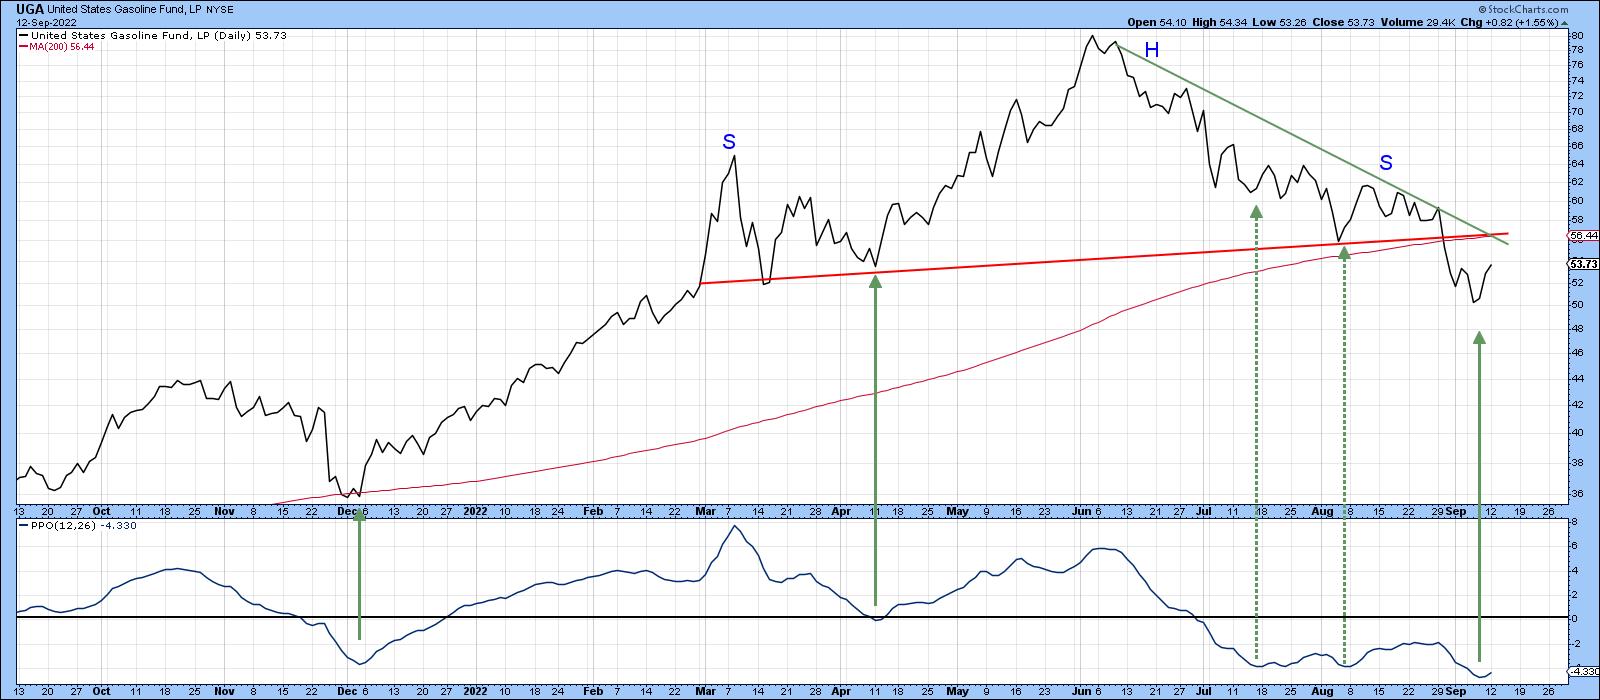
Not everything is in recovery mode, as the US Gasoline Fund has experienced a much more solid downside breakout. The two false upside reversals in the PPO are a reminder this fund may be in a bear market and a possible leading indicator (on the downside) for the energy market. It would need to clear the 200-day MA and both trendlines, say, to $58, in order to dispel such fears.
Recently, the oil price and the stock market have been moving in opposite directions, as shown by the arrows in Chart 8. It's by no means a perfect or permanent relationship, and I certainly wouldn't bet the mortgage on it. That said, it does suggest that, if oil prices move significantly higher and the relationship continues to hold, it would represent another worry that stocks have to deal with. The rationale being that energy prices suck discretionary purchasing power, thereby exacerbating any slowdown or business contraction that takes place.
Good luck and good charting,
Martin J. Pring
The views expressed in this article are those of the author and do not necessarily reflect the position or opinion ofPring Turner Capital Groupof Walnut Creek or its affiliates.


