Inflation is All the Rage, but Many Market Signals are Pointing in a Different Direction
Polls show that the number one issue with voters is inflation, but some intermarket relationships are signaling otherwise. I am not saying that inflation is about to be wrestled to the ground, but it goes in waves, as you can see from Chart 1. Also, once prices go up, they rarely come down. There are only three instances of that happening since 1949, and each was short-lived. So, what I am saying is that it's very likely, based on market signals, that the 2020-202? wave is probably in the process of cresting.

Here is my reasoning.
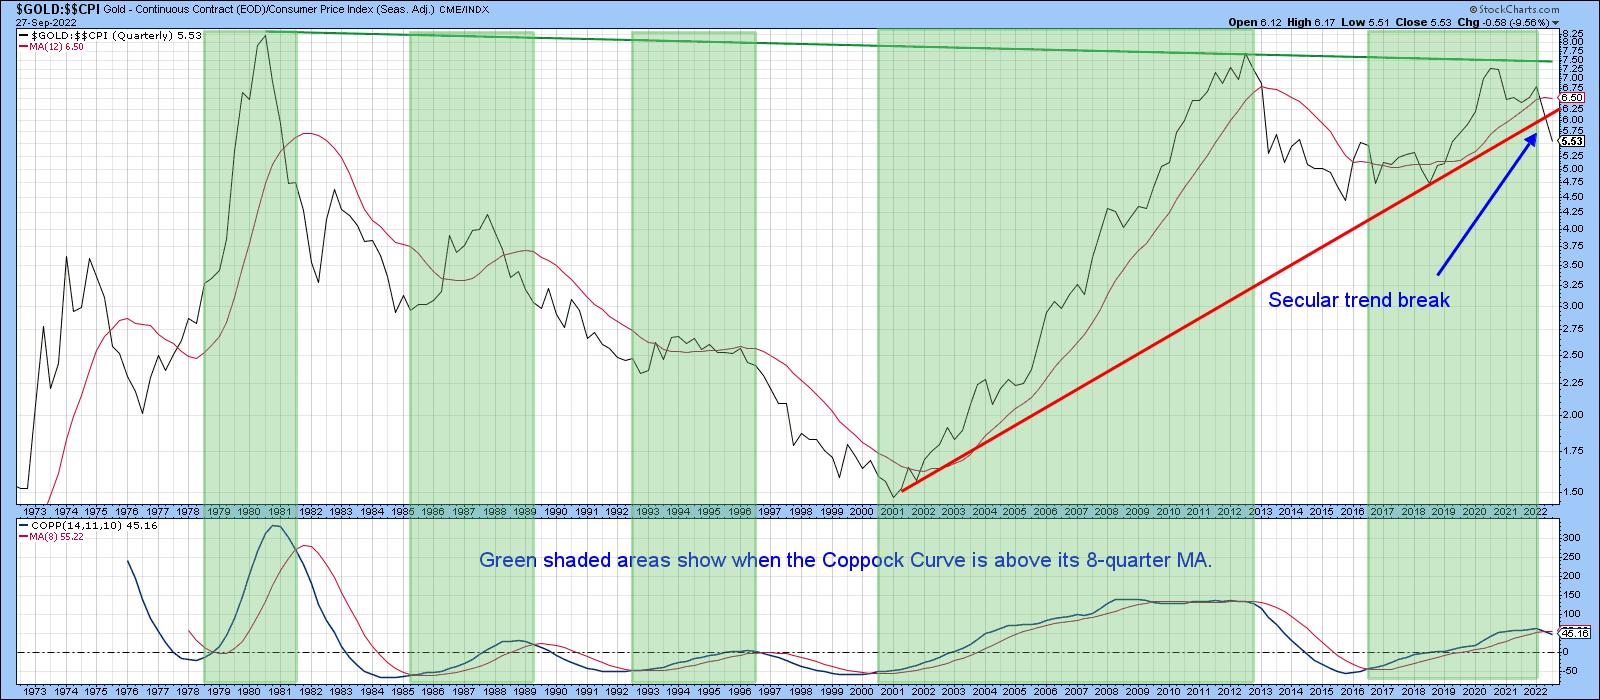
Let's start with gold, which has traditionally been regarded as an inflation hedge. In reality, though, like everything else, it depends where you buy it. Chart 2 shows that January 1980, for instance, would not have been a good time acquire the yellow metal, because it is still below that level today. Compare that to the the turn of the century, when gold was being offered at bargain basement prices.
Chart 2 also features the quarterly Coppock Curve. The green shading indicates when this oscillator has been above its 8-quarter MA. The unshaded areas therefore tell us when this technique is in a negative mode. Since it has just dropped below its moving average, inflation-adjusted gold is now officially in a bear market. Further evidence of a bear trend comes from the price, which has just violated its secular up trendline.
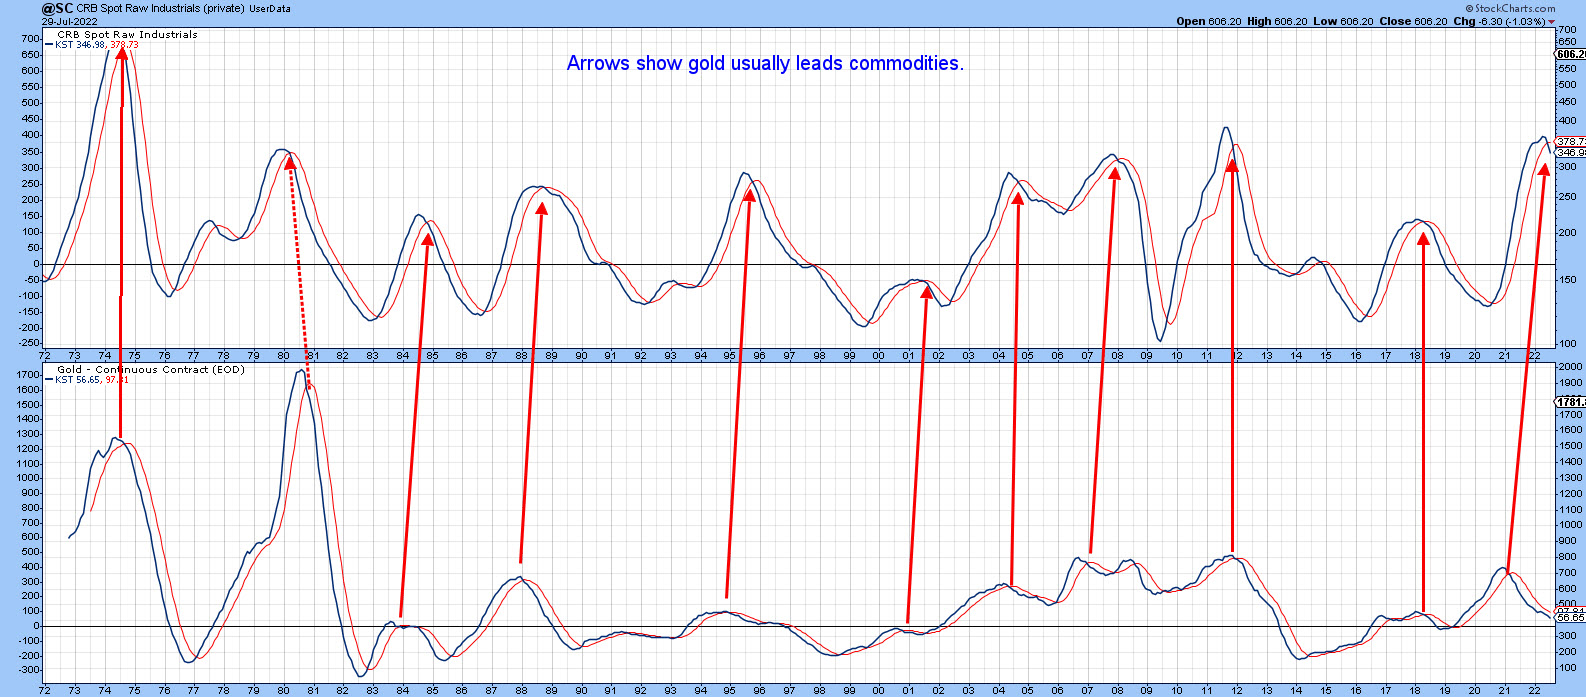
This breakdown is important because gold weakness is usually followed by industrial commodity prices, a leading indicator of consumer price inflation. In that respect, Chart 3 shows that the KST for the gold price has a consistent habit of leading commodity momentum. It's not a perfect relationship, because the leads differ from cycle to cycle. There is even one example (1980) when gold lagged. The gold KST peaked at the beginning of 2021, well ahead of the CRB Industrials, which has only recently reversed to the downside. Based on previous action, lower commodity prices appear likely.
Another useful intermarket relationship comes from that that between commodity-sensitive currencies and commodities themselves. Chart 4, for instance tells us that the Canadian Dollar fluctuates in tandem with the CRB Composite -- not tick for tick, of course, but certainly in a broad sense. The solid arrows point up the fact that the currency usually plays a leading role. The two sets of dashed arrows indicate important divergences, when the dollar fails to confirm a new high in the commodity index. The latest divergence, which began in 2021, is particularly egregious. Finally, it is worth noting that the currency is approaching an 18-year support trendline at just over 70c. Needless to say, a breach would likely be followed by significantly lower currency and commodity prices.
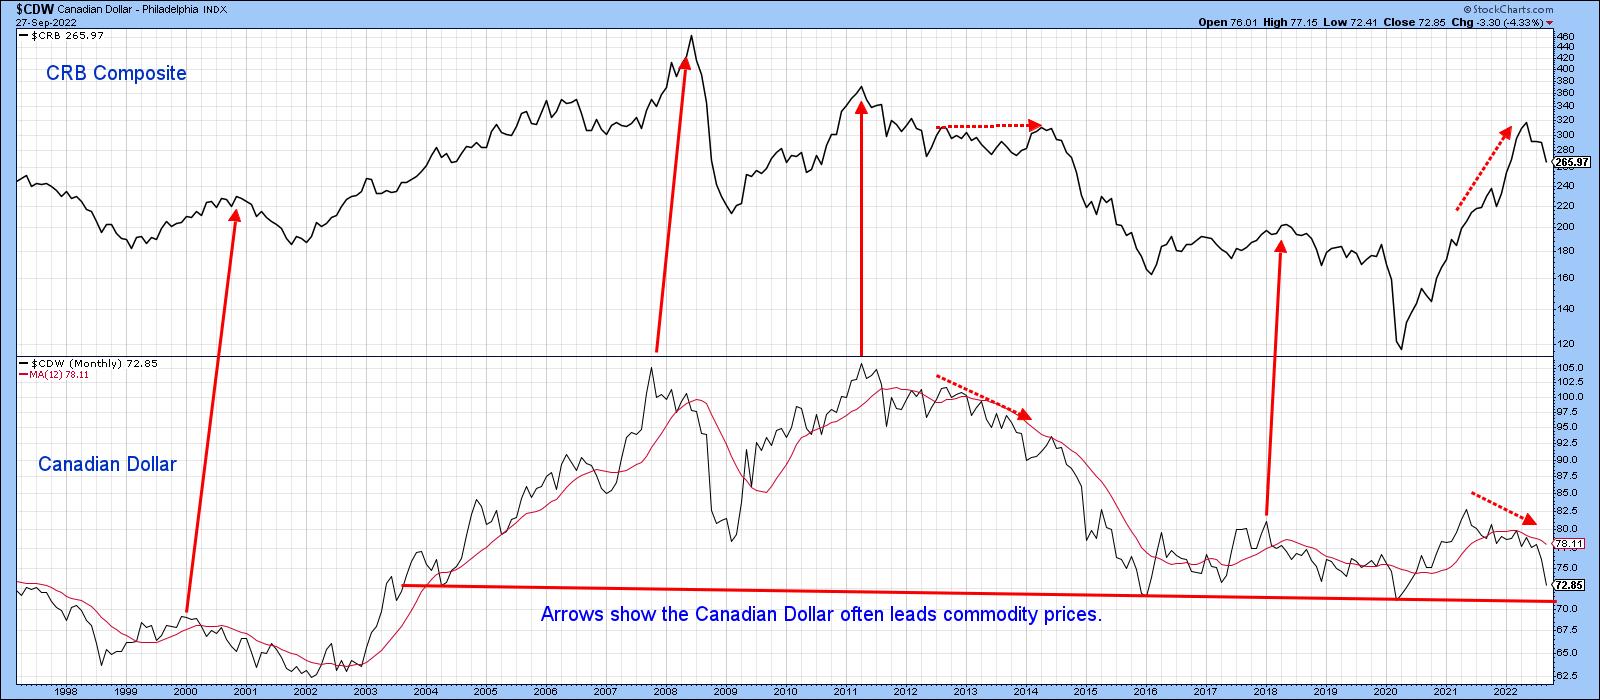
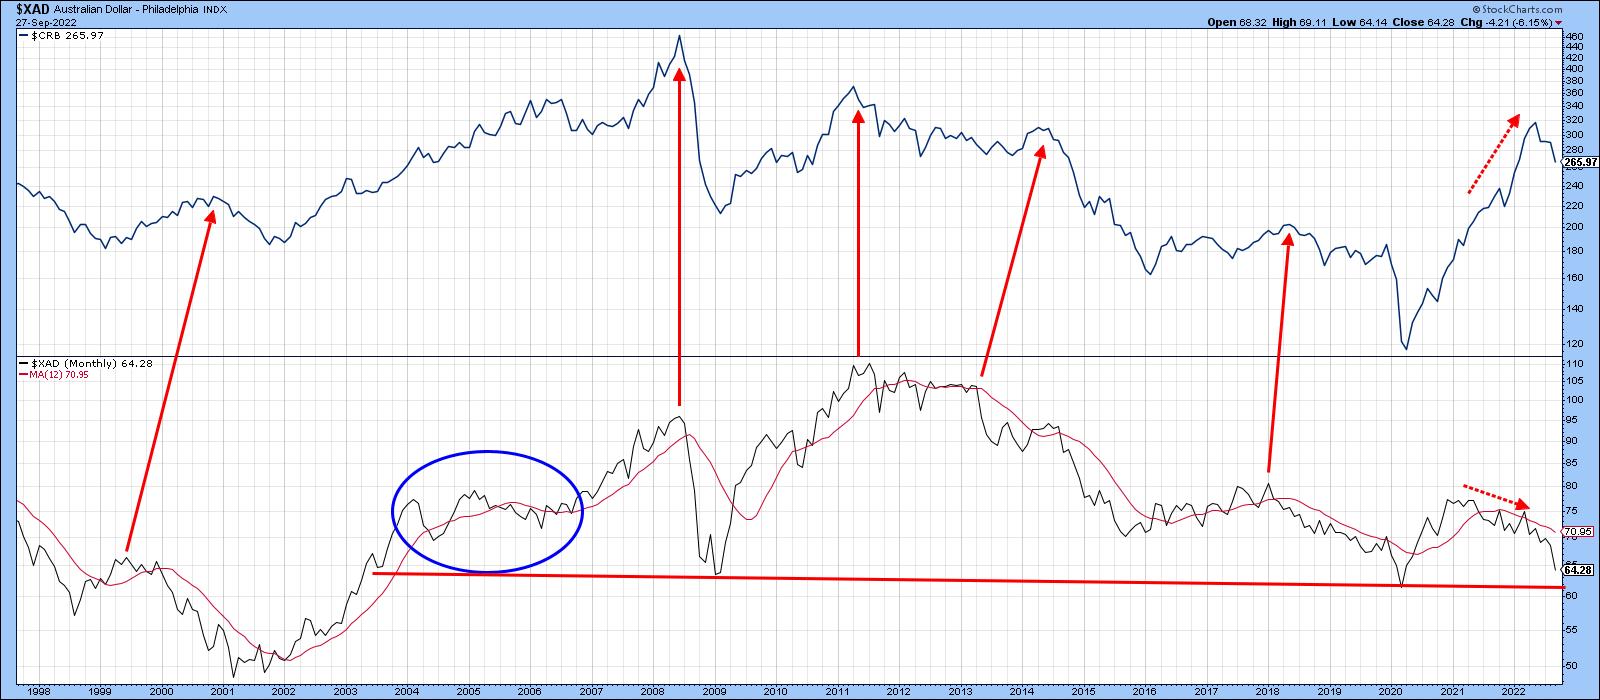
Chart 5 repeats the same exercise, but this time with the Australian currency. Once again, the two have been diverging in a negative fashion for commodities since 2021. This action continues to support the view, that commodities are headed lower on a primary trend basis. The Aussie dollar is also resting above a multi-year support trendline.
None of these relationships guarantee that the rate of inflation will moderate, but they do reveal that early bird inflationary signals are offering some hope at the end of the tunnel.
Time to for us Floridians to prepare for Ian!
Good luck and good charting,
Martin J. Pring
The views expressed in this article are those of the author and do not necessarily reflect the position or opinion of Pring Turner Capital Groupof Walnut Creek or its affiliates.


