Sectors to Avoid if the Market Declines and Worth Consideration if it Rallies
Last week, I suggested that some unusually bullish outside bars, in conjunction with positive short-term momentum and a favorable seasonal going into year-end, could trigger a worthwhile rally. That does not make me wildly bullish, because I still think we are in a bear market. When my long-term indicators turn, so will I. In the meantime, I am assuming that any advance will be difficult to play and extremely deceptive, as that's the nature of bear markets. There is no doubt things are oversold, and certainly overdue for an advance. However, that was also the case in November of 2007 and March and July of 2008. All three periods experienced strong intermediate buy signals, yet none bore fruit, because they all developed under the context of a bear market.
By way of an example, Chart 1 features a 30-day MA of the CBOE Options Put/Call Ratio. Downside reversals from at or above the green dashed line have consistently been followed by a nice advance. However, that was not the case during the only true bear market since 2007, where failed signals have been flagged with the red-dashed arrows. Last summer's rally also had the same deceptive characteristics and also earned a red dashed arrow.

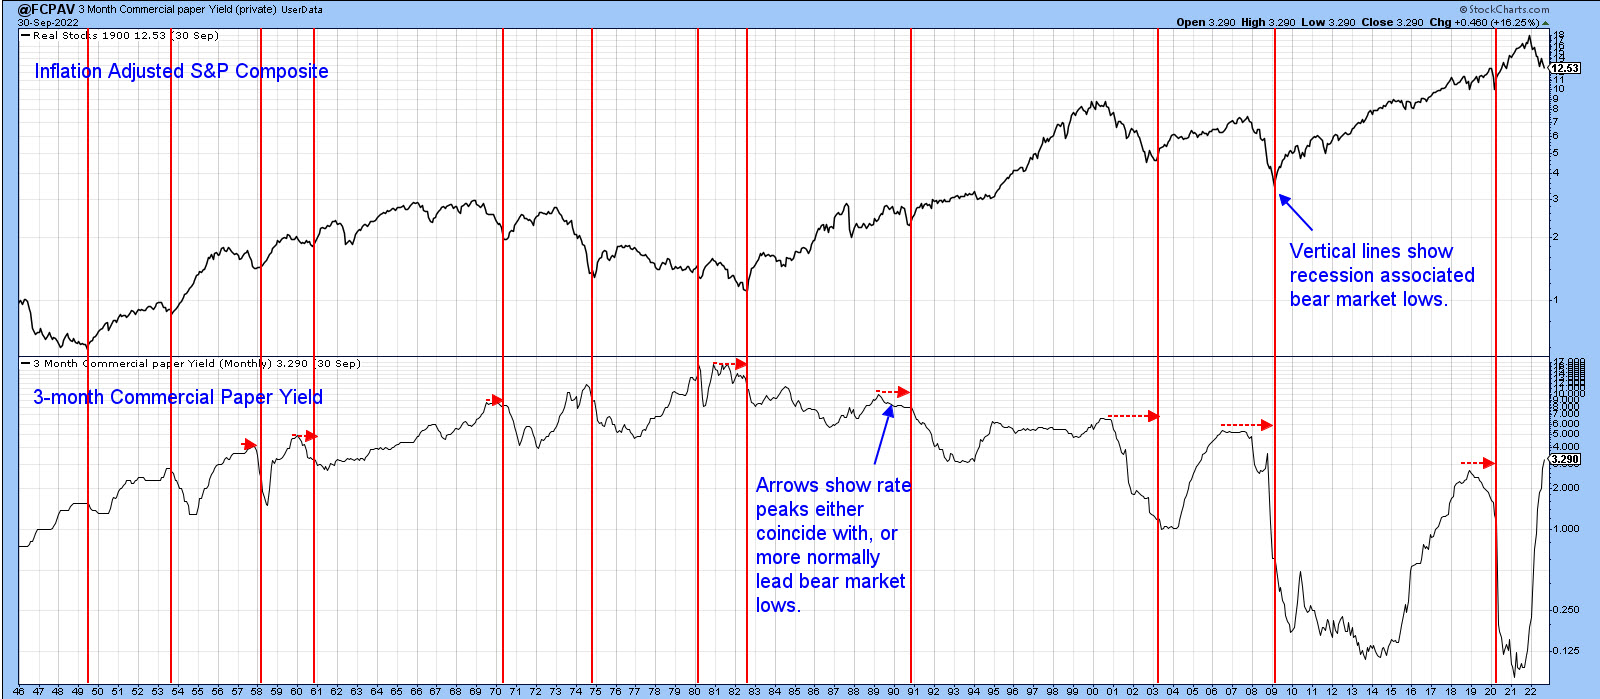
Chart 2 shows that bear market lows since the 1940s have all lagged or, to a far lesser degree, coincided with the peak in the yield on 3-month commercial paper. With inflation still running high and the Fed, at this point, sworn to defeat it, money market yields are almost certain to rise. Based on historical precedent, if rates rise, stocks have yet to see their lows. This time could be different, but I doubt it. Bearing that in mind, there are a couple of sectors sporting improving relative action and one in particular that looks vulnerable.
Sectors with Emerging Relative Strength
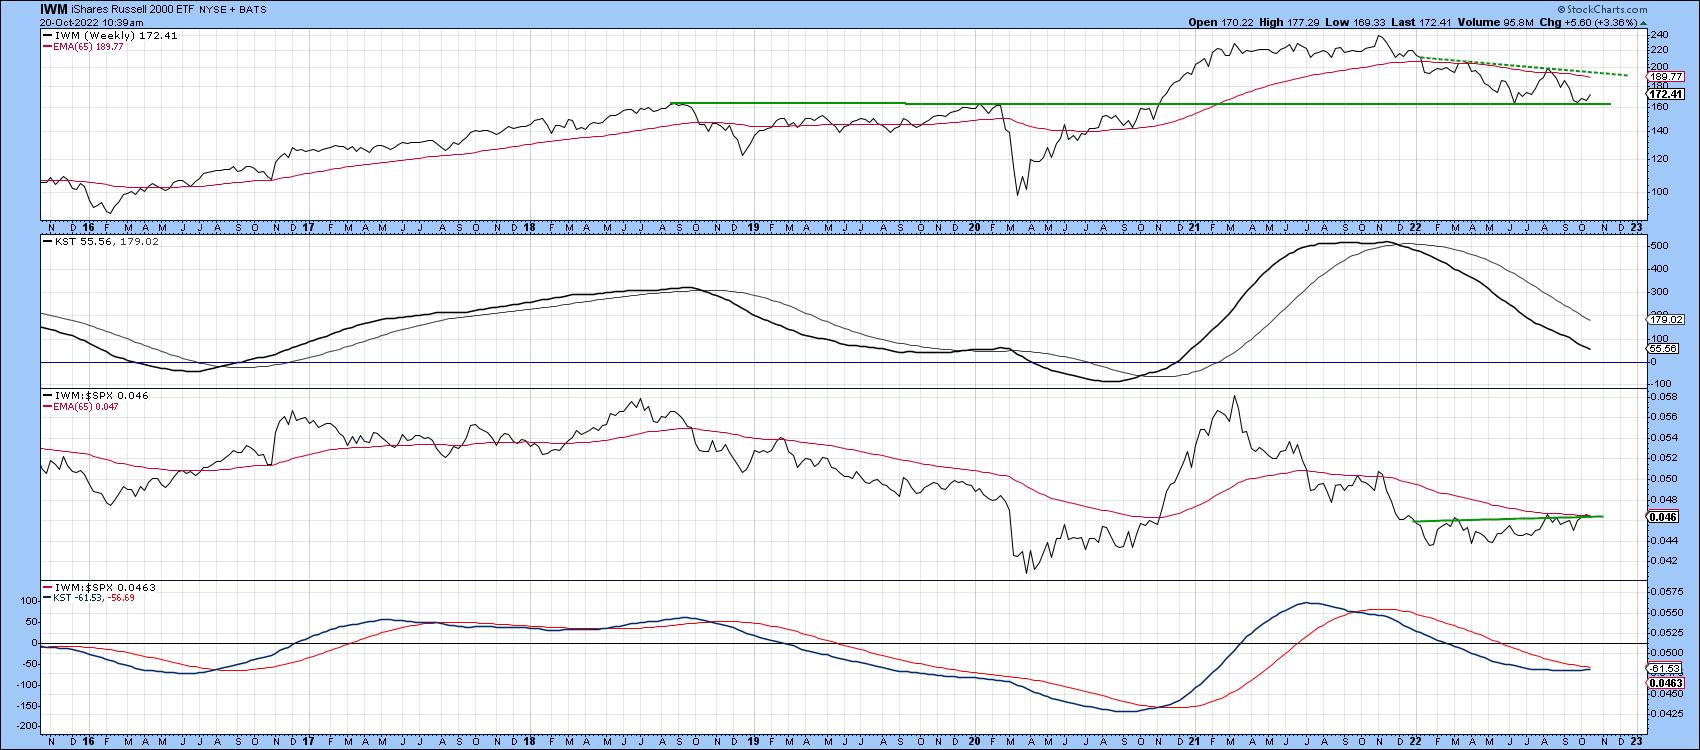
Chart 3 shows that the Russell 2K ETF broke out from a major consolidation pattern in late 2020 and has now pulled back to support at the extended breakout trendline. Long-term momentum, in the second window, is bearish, and the price itself remains below its 2022 resistance trendline and 65-week EMA. Consequently, it's not a raging buy yet, but you can see that relative momentum in the bottom window and the RS line itself are both poised to surpass resistance. Until they do, I am keeping the caution flag hoisted. Please remember that, going forward, it's possible to update these charts by simply clicking on them. They are then savable to one of your chart lists.
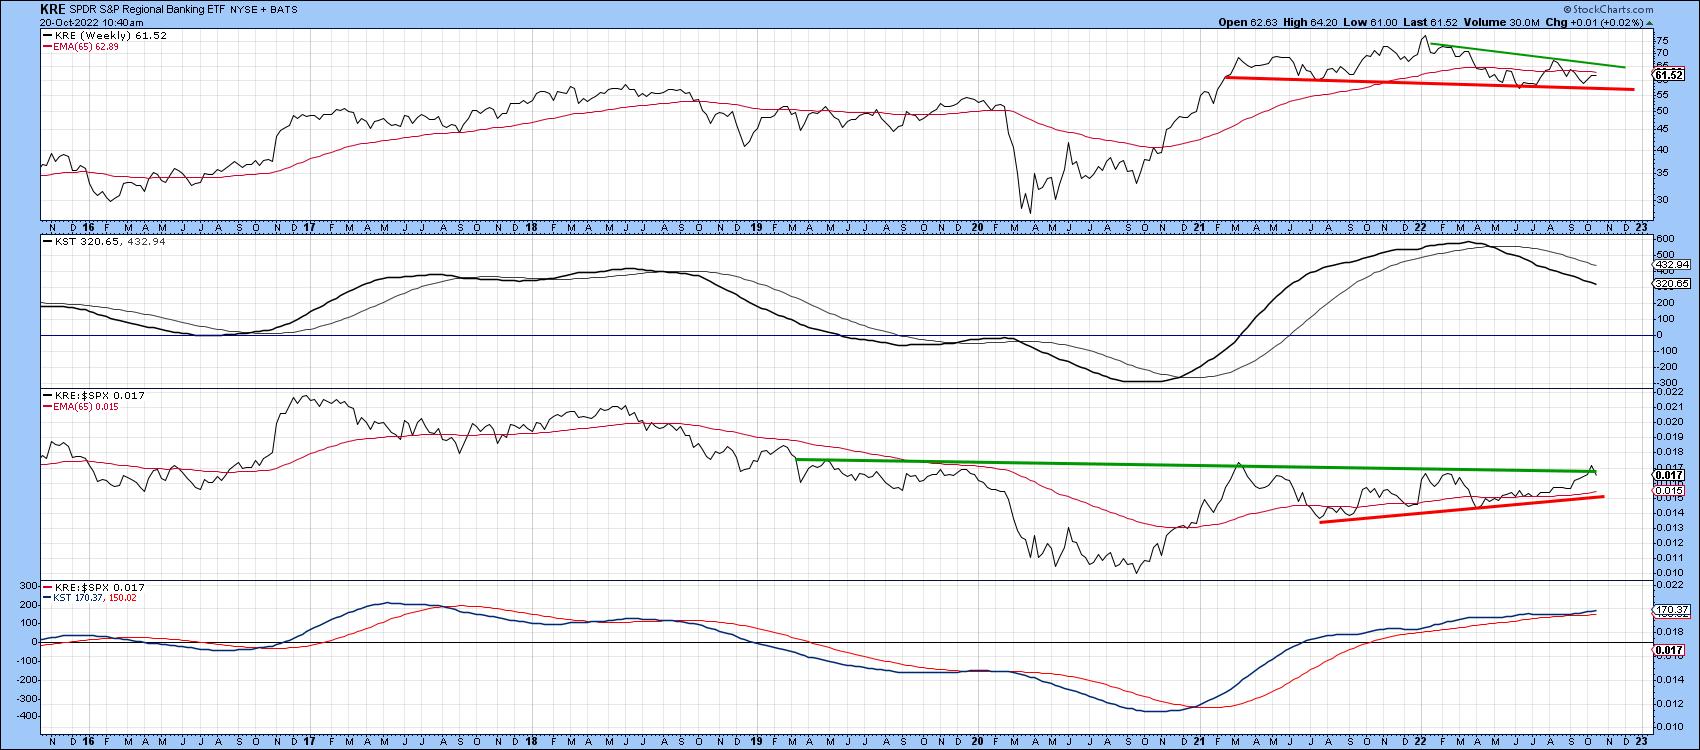
The SPDR Regional Banking Index (Chart 4) is also trying to break out on a relative basis. It is being supported by a positive long-term KST for relative action, as featured in the bottom window. This positive RS trend suggests this sector could break to the upside in the event of a nice year-end rally. However, should the rally scenario fail to take hold, the price itself could easily slip below the red neckline of a potential head-and-shoulders top.
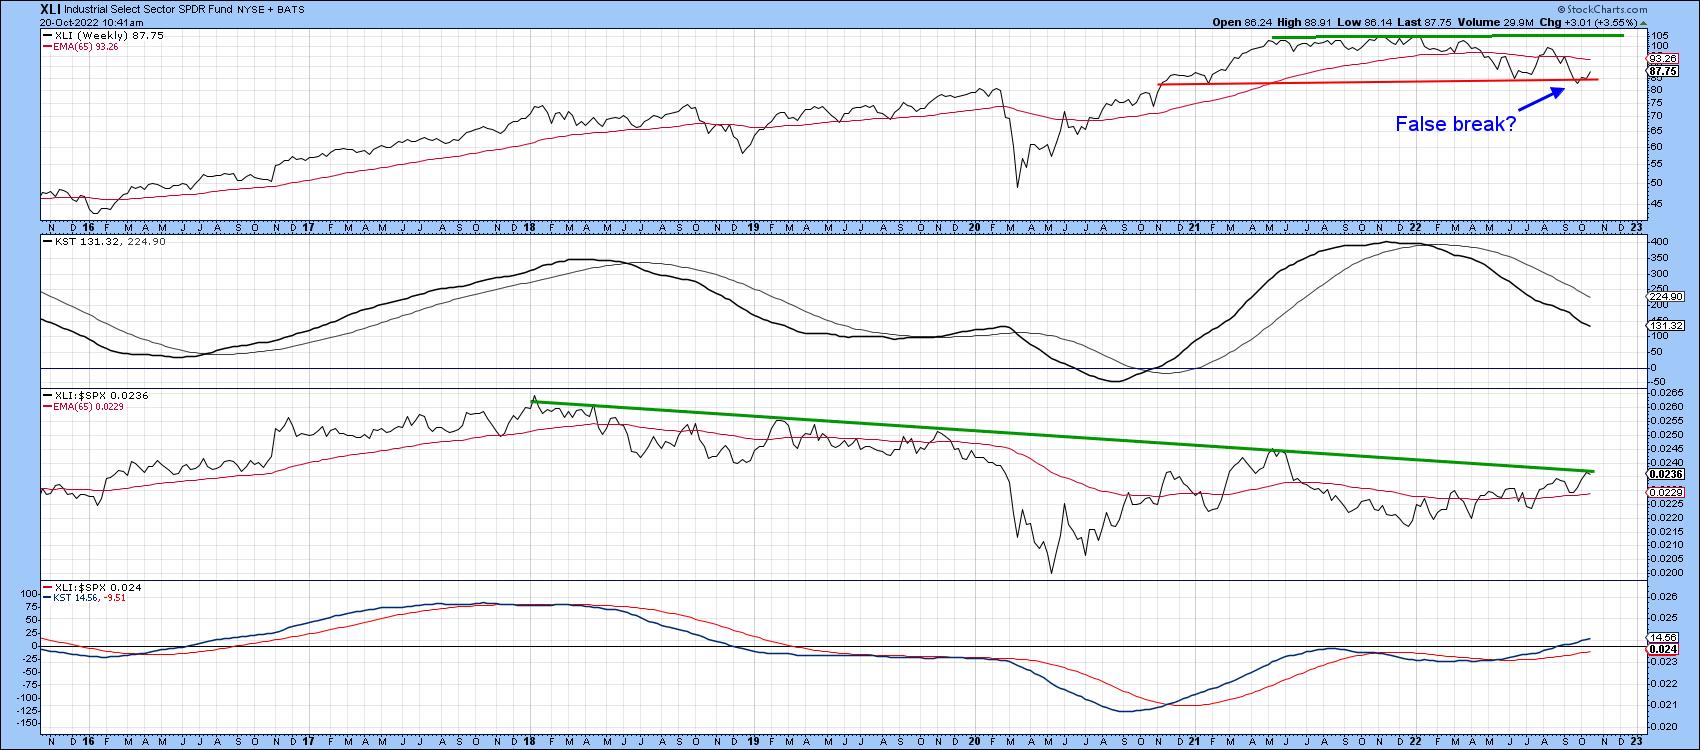
The RS line for the SPDR Industrials (Chart 5) has started to edge through a 5-year resistance trendline. It looks likely to experience a stronger break, as the KST for relative action is in a positive mode. The price itself may have experienced a false break to the downside, but needs to confirm this with a positive crossover of its 65-week EMA. Industrials also face the challenge of a moderately overbought and declining long-term KST.
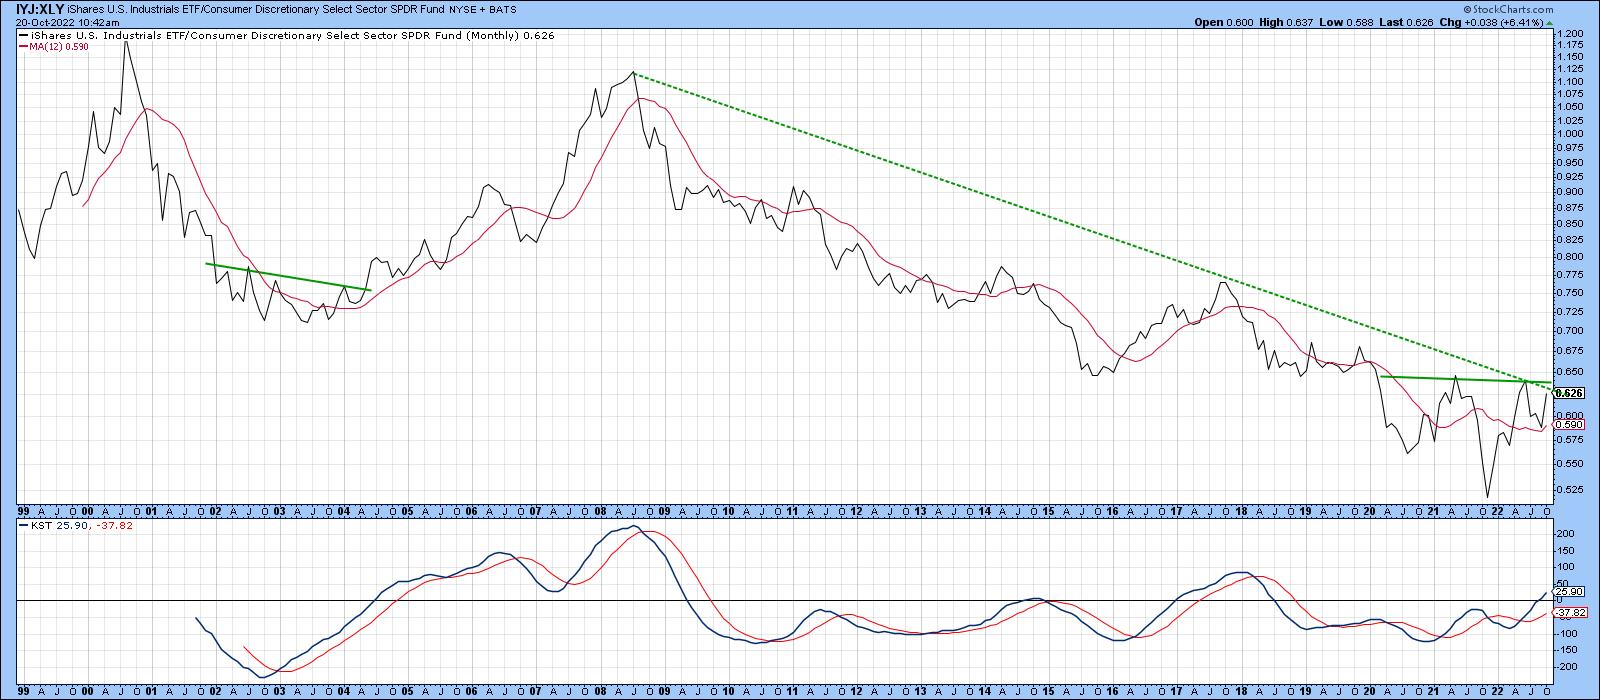
Industrials could be a leading group in the next bull market. That view is based on its relative strength against consumer cyclicals, which could be in the process of reversing a 23-year down trend. If the dashed down trendline and horizontal potential neckline, featured in Chart 6, are both surpassed, that would strongly suggest a new long-term theme favoring industrials is underway.
Technology, a Sector with Deteriorating Technicals
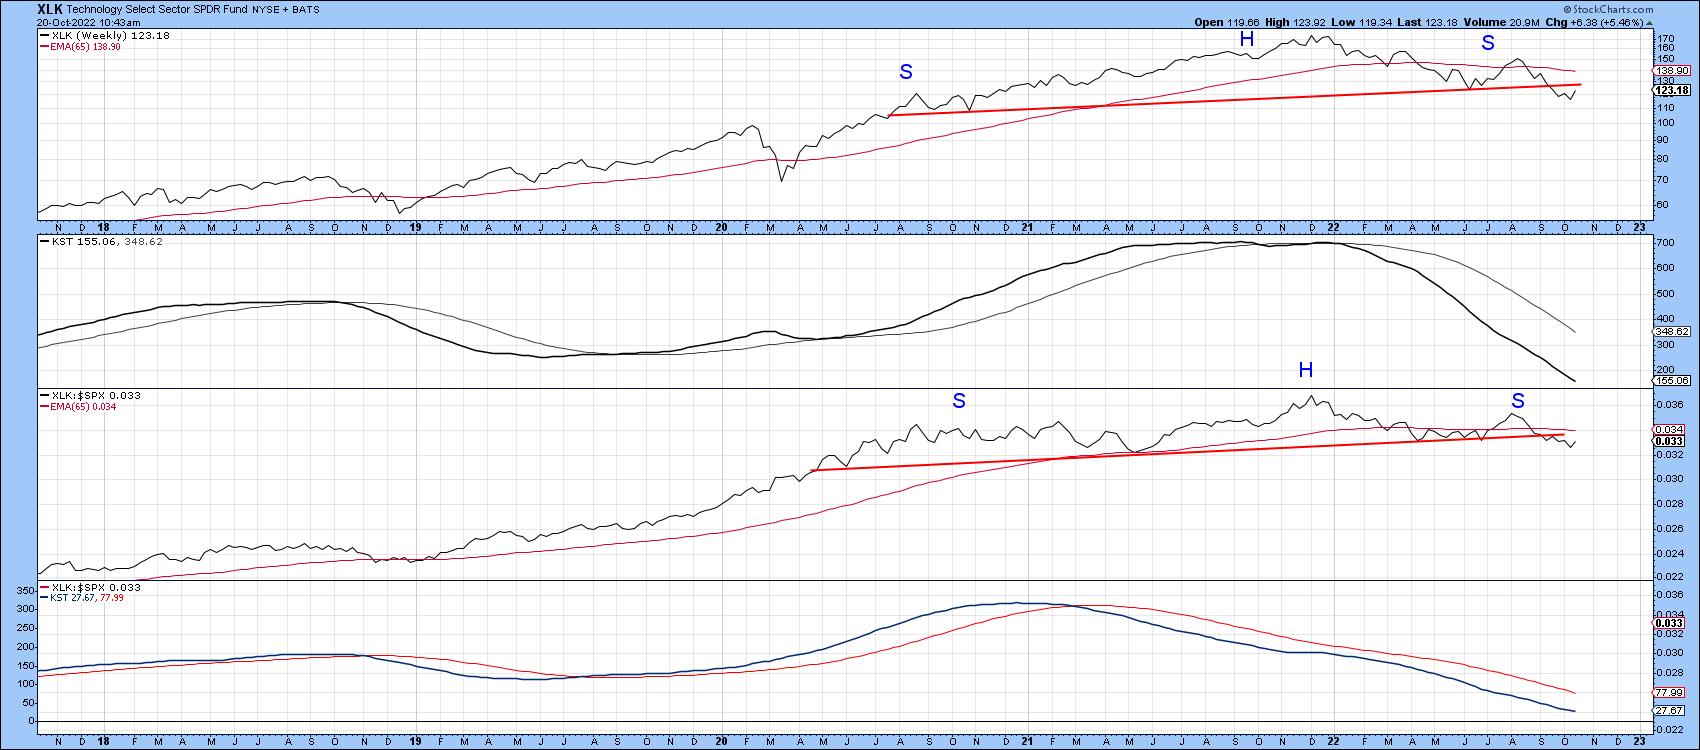
Technology has suffered a lot this year, but Chart 7 shows that the SPDR Technology ETF has only recently completed a head-and-shoulders top on both an absolute and relative basis. Neither of the KSTs are below their equilibrium point, so further losses are likely. That means that if, the market ultimately registers a new low, technology could be a sector that helps put it there.
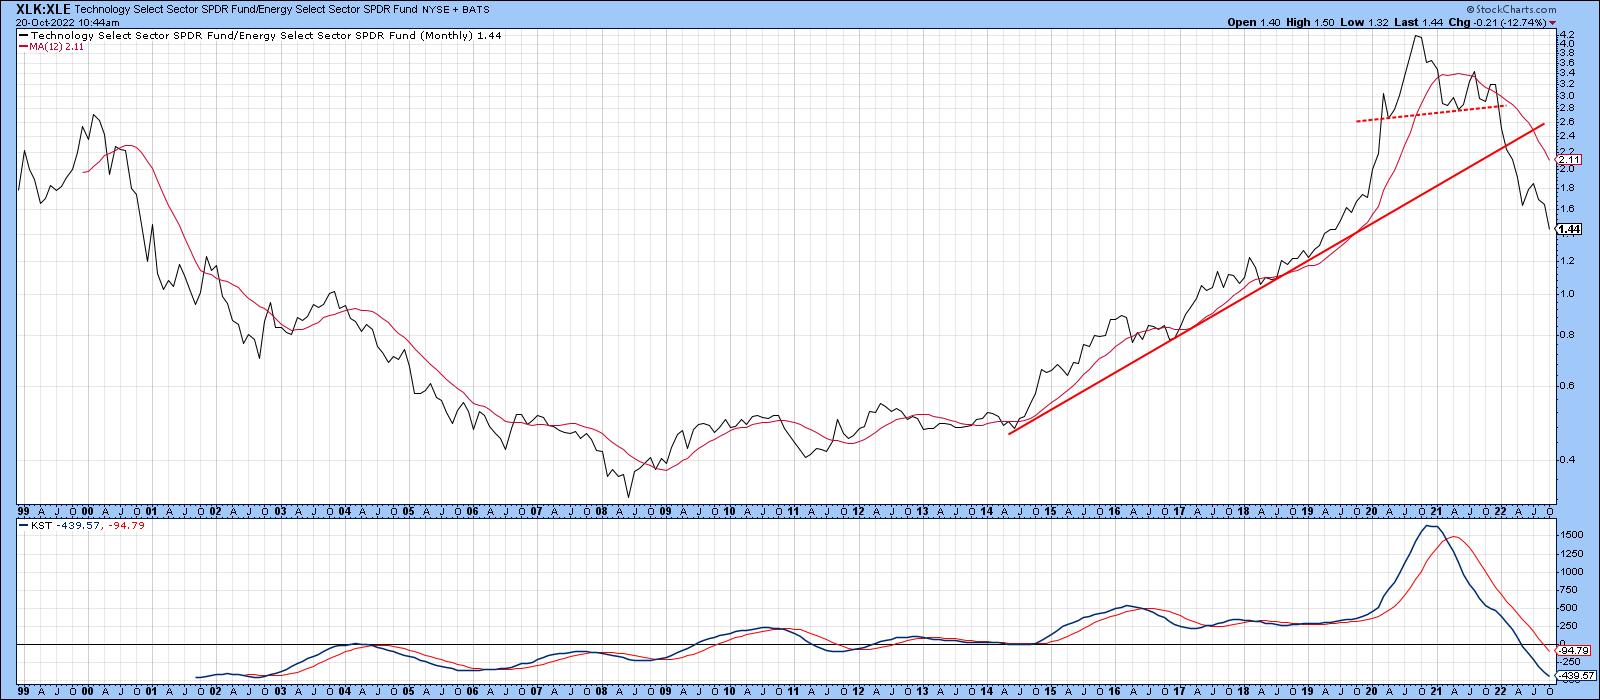
Technology has already reversed two long-term theme changes this year. First, as shown in Chart 8, it has been falling like a stone against energy.
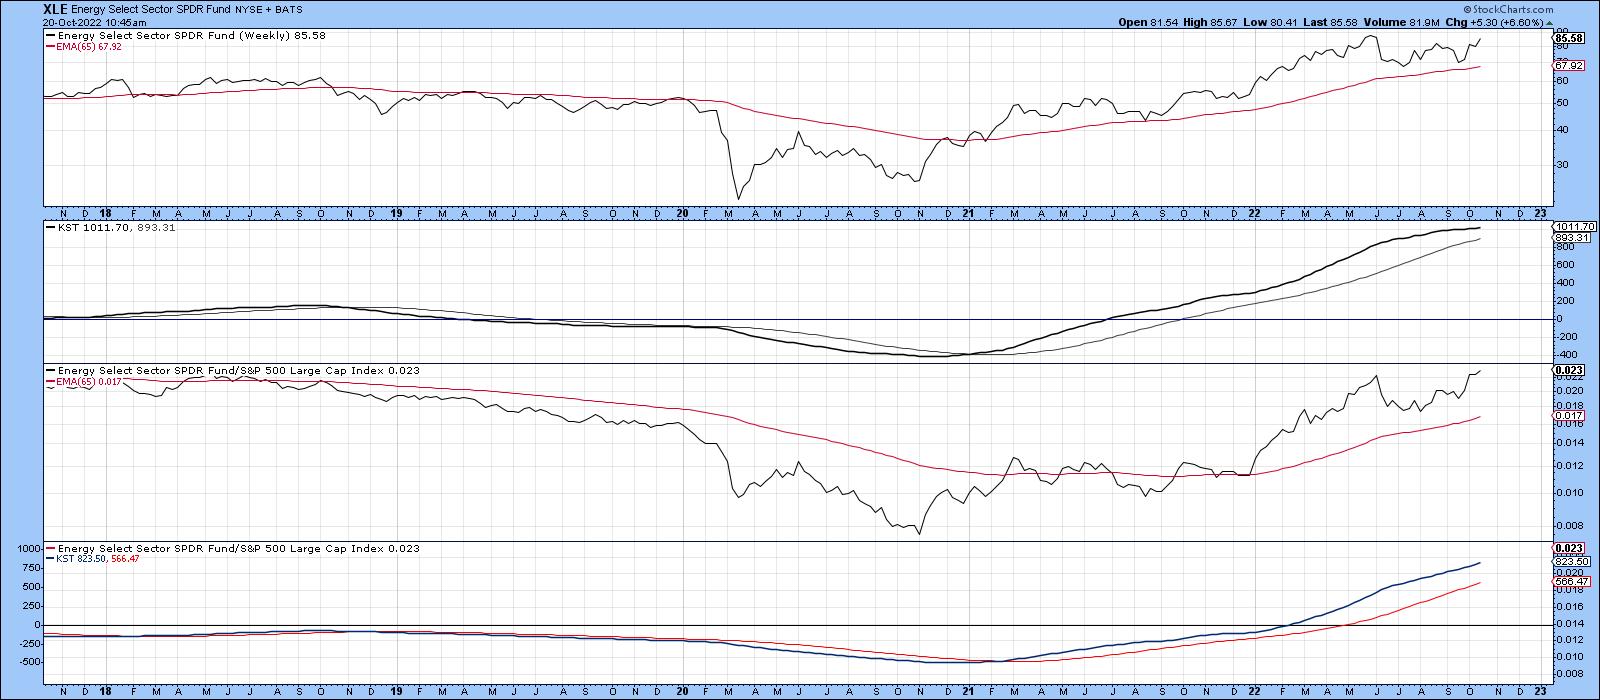
Energy itself, though, continues to look strong, as we can see from Chart 9.
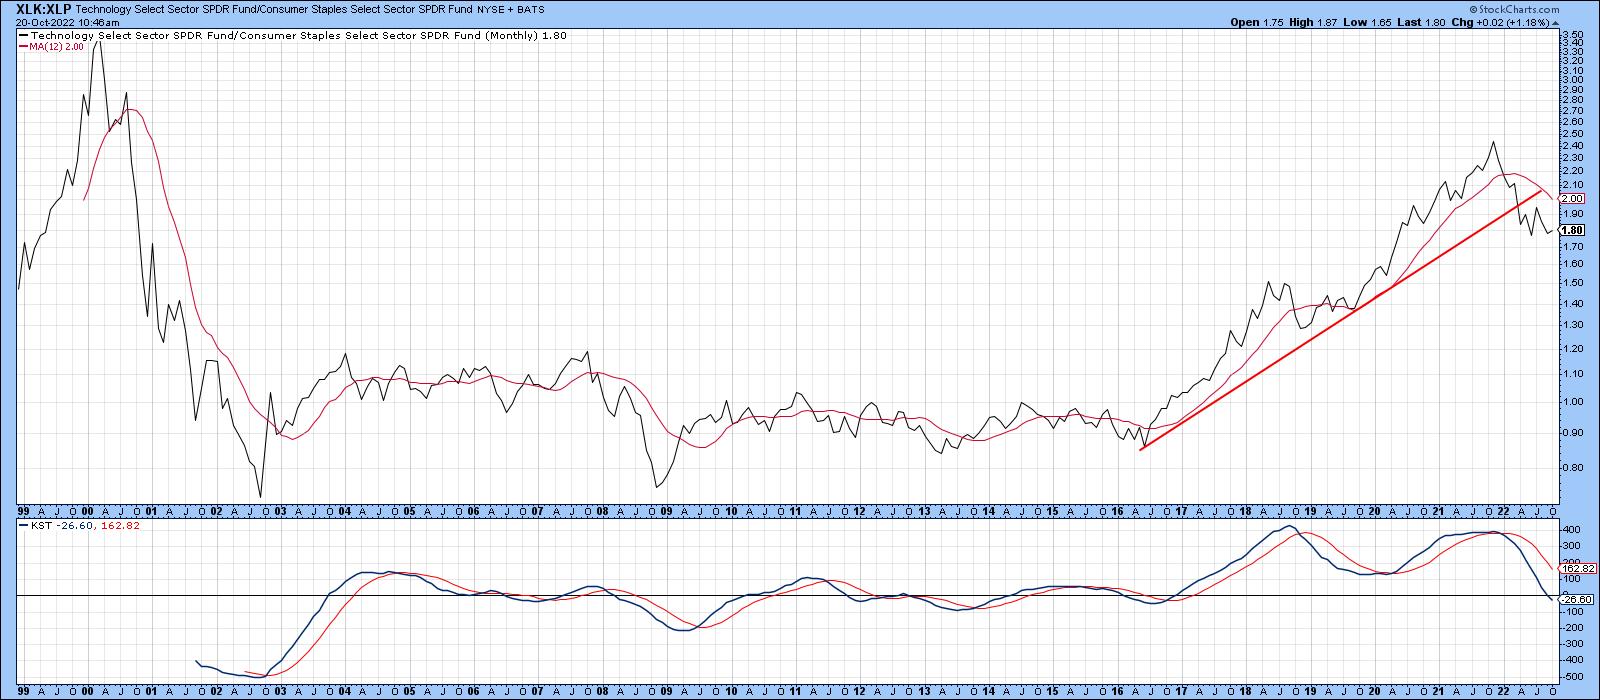
Second, Chart 10 pits technology against consumer staples in a form of confidence indicator. This relationship appears to have peaked on a long-term basis, as market participants have pulled back from the higher risk technology stocks to favor the more defensive staples. That's not a good sign for the longer-term market prospects either.
Good luck and good charting,
Martin J. Pring
The views expressed in this article are those of the author and do not necessarily reflect the position or opinion of Pring Turner Capital Groupof Walnut Creek or its affiliates.


