The Oil Price Gets Resuscitated: Is it Enough to Keep the Bull Market Alive?
Just when it seemed that oil was peaking, OPEC breathed new life into the commodity this week by threatening a sizeable production cut. That does not change the overextended nature of the longer-term indicators. Nevertheless, it does hint that oil prices and their related stocks may be on the verge of another up leg.
Long-Term Charts
Chart 1 sets the longer-term theme, as it tells us that the West Texas Intermediate recently experienced a false upside breakout. That move was then confirmed by a negative 12-month MA crossover. Normally, a whipsaw such as this is followed by an above-average move in the opposite direction to the breakout. However, prices are determined by people's emotions. Since people can and do occasionally change their minds, it follows that markets can also. In the current situation that may mean the oil market is in the process of re-grouping as a prelude to moving higher. I don't think the odds favor such a scenario, but it's important to bear in mind that it stands a sporting chance of happening.
The signal most likely to achieve that change would be a credible month end close above the multi-year resistance trendline and the 12-month MA -- let's say, a nice round $100.
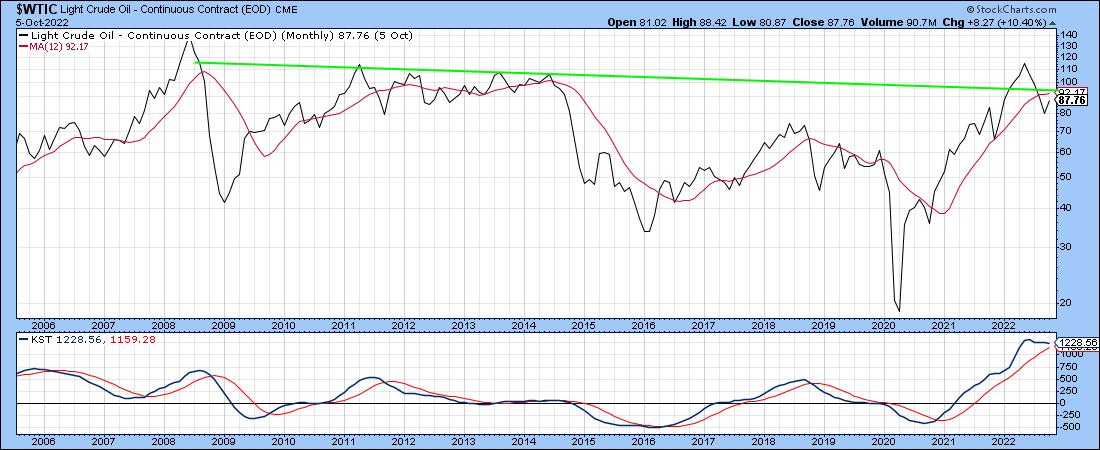
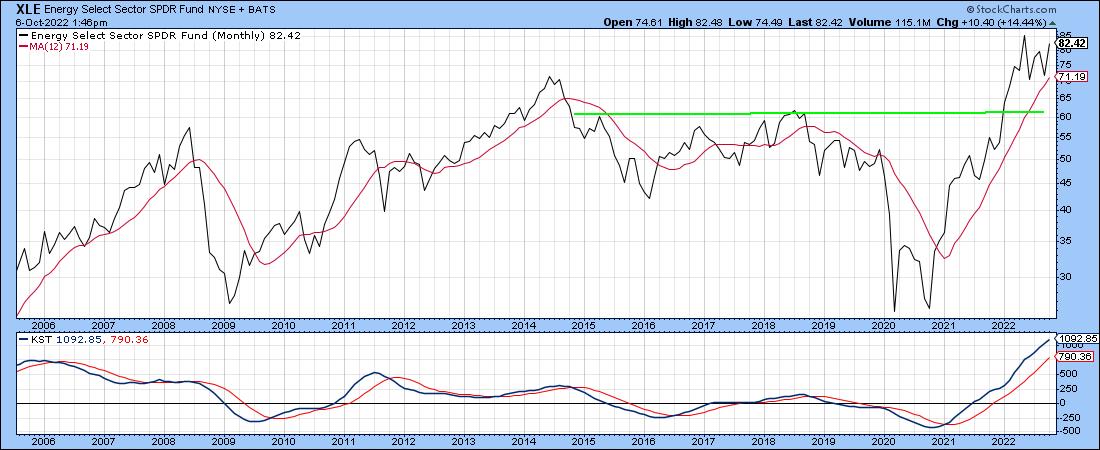
Chart 2 is much stronger, as it shows the SPDR Energy ETF (XLE) to be well above its breakout trendline and 12-month MA. The shares, unlike the commodity, never triggered a sell signal. Since the XLE discounts the future average price of oil, this is a very bullish sign. Does it mean that oil prices are guaranteed to move higher? Absolutely not! However, if you are trying to build a bullish case, it is nicer to have the shares on your side than not.
Short-Term Charts
Chart 3 indicates that the oil price is in a short-term downtrend. However, it is now at resistance in the form of the 10-week MA and June/October down trendline. This positioning offers the possibility that the price may be in the early stages of forming the right shoulder of a large head-and-shoulders top. That is highly speculative, currently, but worth monitoring for a future possible development in the event that the current rally fizzles out.
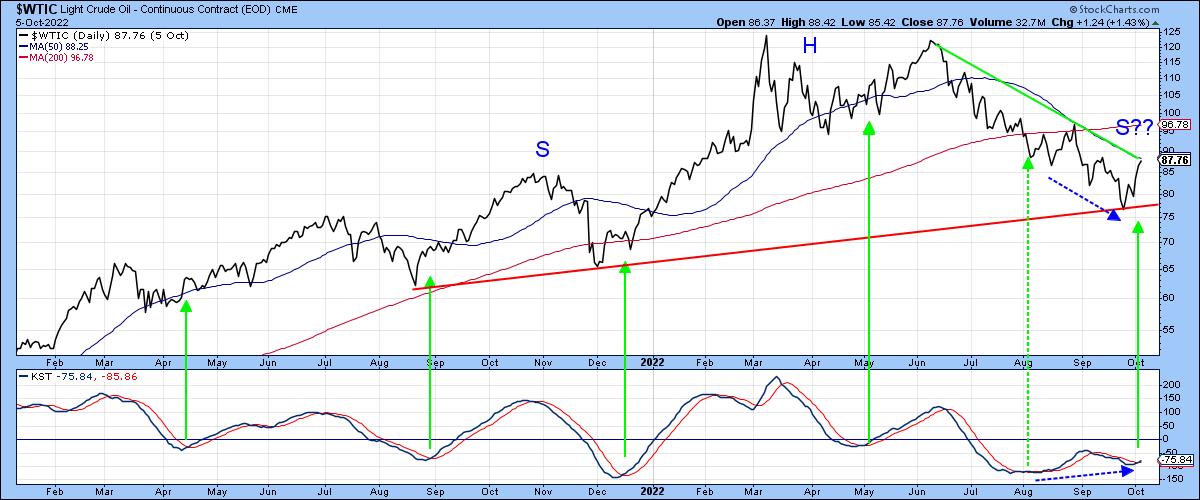
Returning to Wednesday's picture, we see that the daily KST has just triggered a buy signal. Note that it has also diverged positively with the price itself. Divergences are only potential until confirmed. In this case, that would involve a breaking of the 2022 down trendline and 10-week MA.
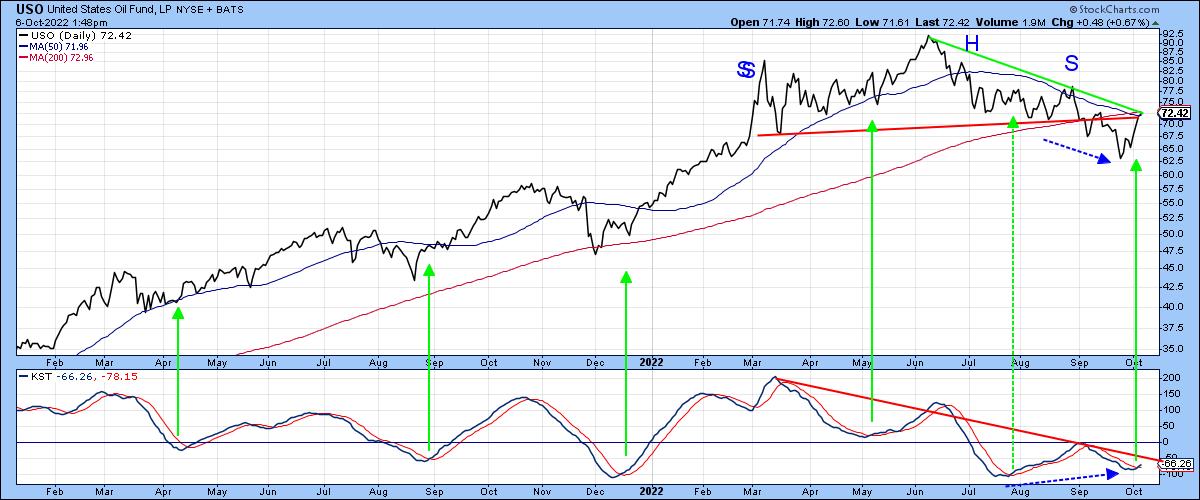
Chart 4 shows the shorter-term action for the US Oil Fund, the USO, where the crucial state of the technical position is even more apparent. Note that the price is right at the two converging trendlines, as well as the 10- and 200-day moving averages. That's happening at the same time the KST is crossing above its signal line and is setting up a positive divergence with the price. If those two converging trendlines are violated, it would indicate a head-and-shoulders failure, thereby suggesting a strong move to the upside.
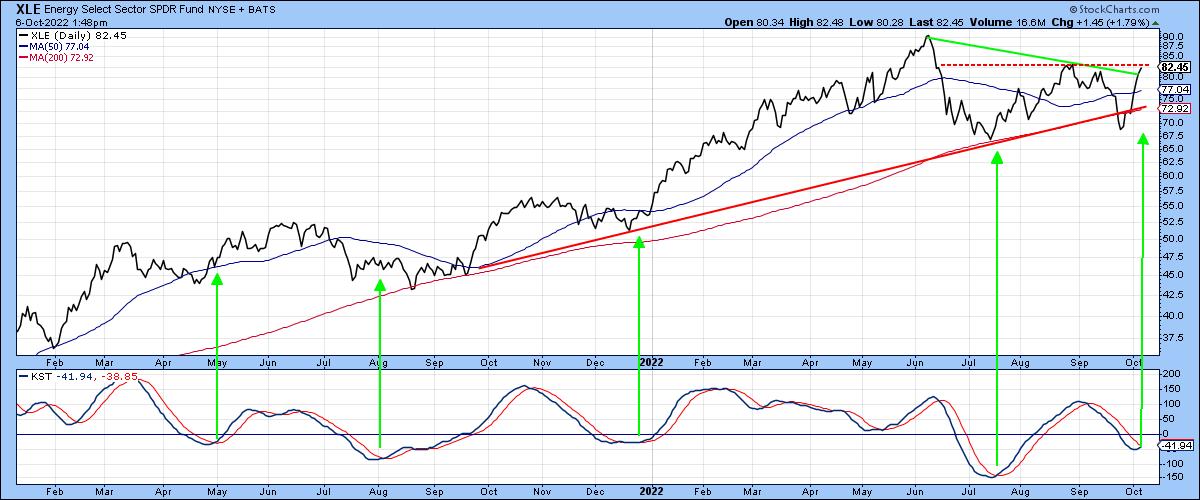
The XLE is again featured in Chart 5, where we can see that it recently experienced a false downside breakout below its 2021-2022 up trendline and 200-day MA. This move has been partially confirmed by a tentative violation above the post June down trendline. However, the real test lies at the red-dashed line, representing the most recent rally peak at $83. The upside reversal in the KST suggests that this resistance will be overcome.
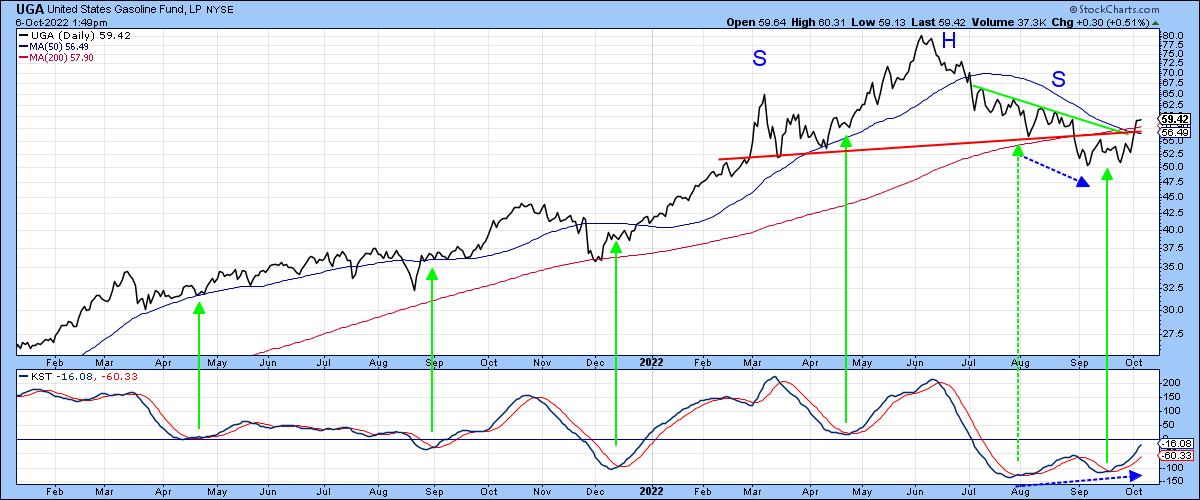
Finally, the US Gasoline Fund (UGA) did complete a head-and-shoulders top. Adding to the credibility of the break was the fact that it was accompanied by a negative 200-day MA crossover. However, that break is now questionable because things have reversed in the last few days, as the price is now back above both the neckline and both moving averages. It has also crossed above its post-June down trendline, thereby confirming the positive divergence between it and the daily KST.
Conclusion
The long-term picture for the oil price, as painted in Chart 1, is bearish. The shorter-term charts also broke down but are now fighting back and are at resistance. If they can push through it, the ensuing rally will probably have enough power to reverse the longer-term charts as well. How far the price might rally is unknown. What is known is the death of the oil bull market would have been greatly exaggerated.
Good luck and good charting,
Martin J. Pring
The views expressed in this article are those of the author and do not necessarily reflect the position or opinion of Pring Turner Capital Groupof Walnut Creek or its affiliates.


