Which Country ETFs Can Lead Us Out of the Bear Market and Which Ones Could Drag Us Deeper In?
When I am looking at a downtrend of a specific market that has been in existence for a while, I often ask myself which components might be on the verge of an upside breakout and could therefore lead it higher. Conversely, I have to ask if there are any downside breakouts taking place which could lead it lower.
The "market," in this case, is global equities, as represented in Chart 1 by the Dow Jones World Index ($DJW). As you can see, it recently bounced off its secular bull market trendline, thereby offering the possibility of a bear market low. That idea would obtain more credibility if it can rally back above the secondary dashed trendline. You could argue the case that this is a more significant line. While it may be slightly shorter, it has, nevertheless, been responsible for turning back five rallies. This compares to the solid one, which has only turned back the 2020 decline. I calculate the extended dashed line to currently be at around 456.

The question naturally arises as to what countries, if any, are in a position to lead the index higher. Conversely, if the bear market is to extend, which ones might drag it down to new lows? Let's consider both types of candidates in turn, limiting our analysis to ETFs to avoid currency and inflationary distortions to which local indexes are subject.
Constructive Looking Country ETFs
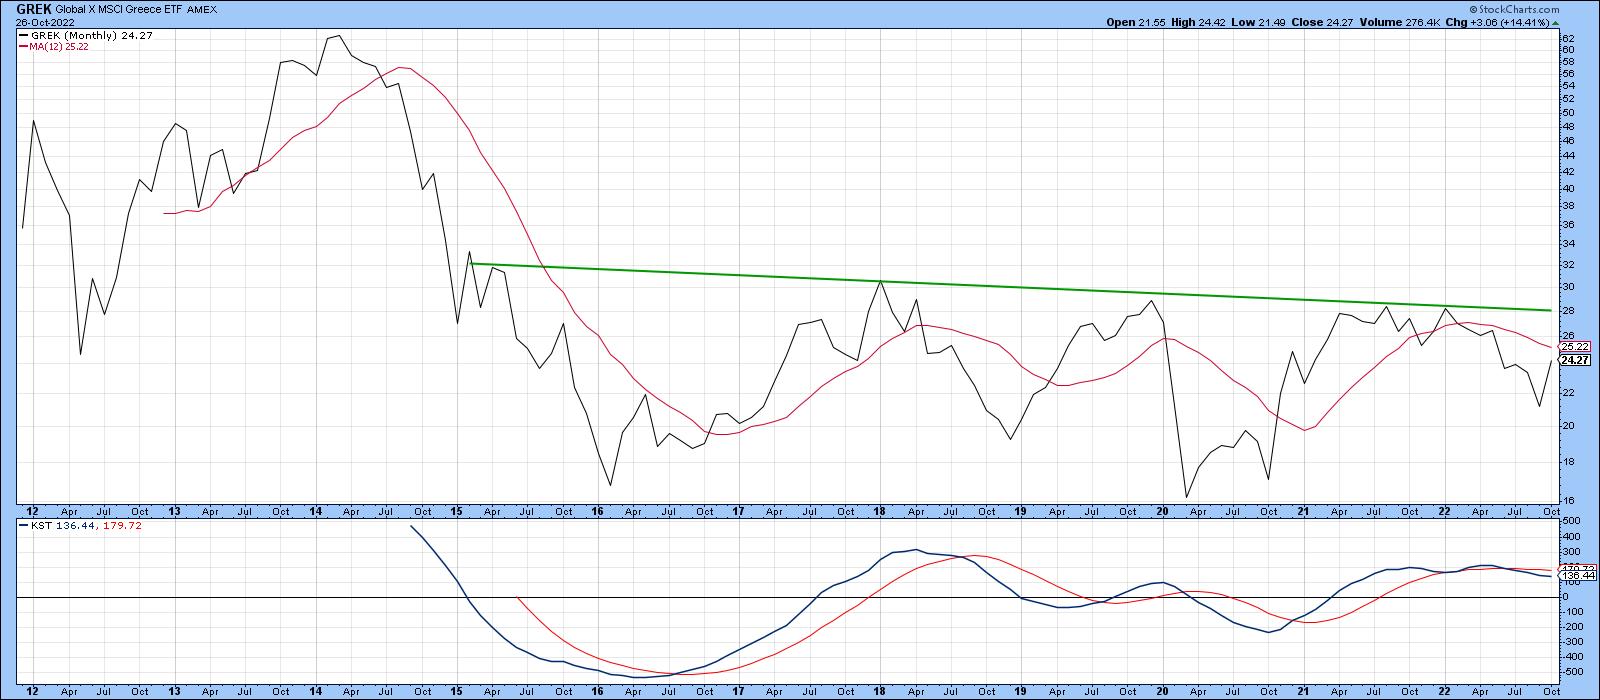
Charts 2 and 3 feature two European-oriented ETFs, Greece and Turkey. Both appear to be forming bases. The Global X MSCI Greece ETF (GREK) is still bearishly below its 12-month MA and is sporting a negative long-term KST. Nevertheless, at $24, it is certainly within striking distance of an upside breakout at $28.
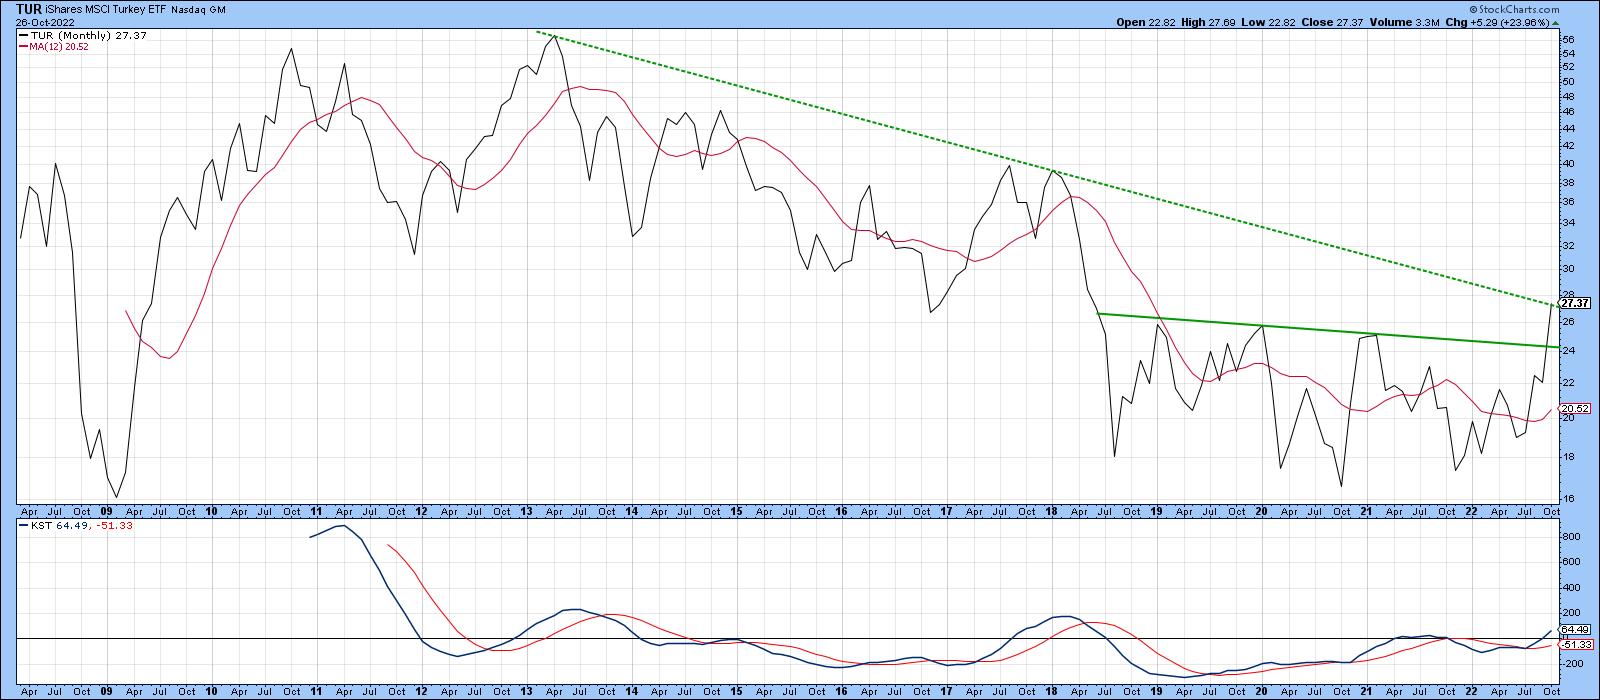
Turkey is currently experiencing massive inflation, which the government is fighting with lower interest rates. Yes, lower interest rates, that's not a misprint. On the face value, the country looks to be a basket case. But the chart begs to differ. Regardless of the policy, the iShares MSCI Turkey ETF (TUR), a dollar-denominated ETF, has broken out from a five-year base, an event that is accompanied by a positive long-term KST. It's currently facing a test of the 2013-2022 down trendline, but looks to be in better long-term technical shape than most other country ETFs.
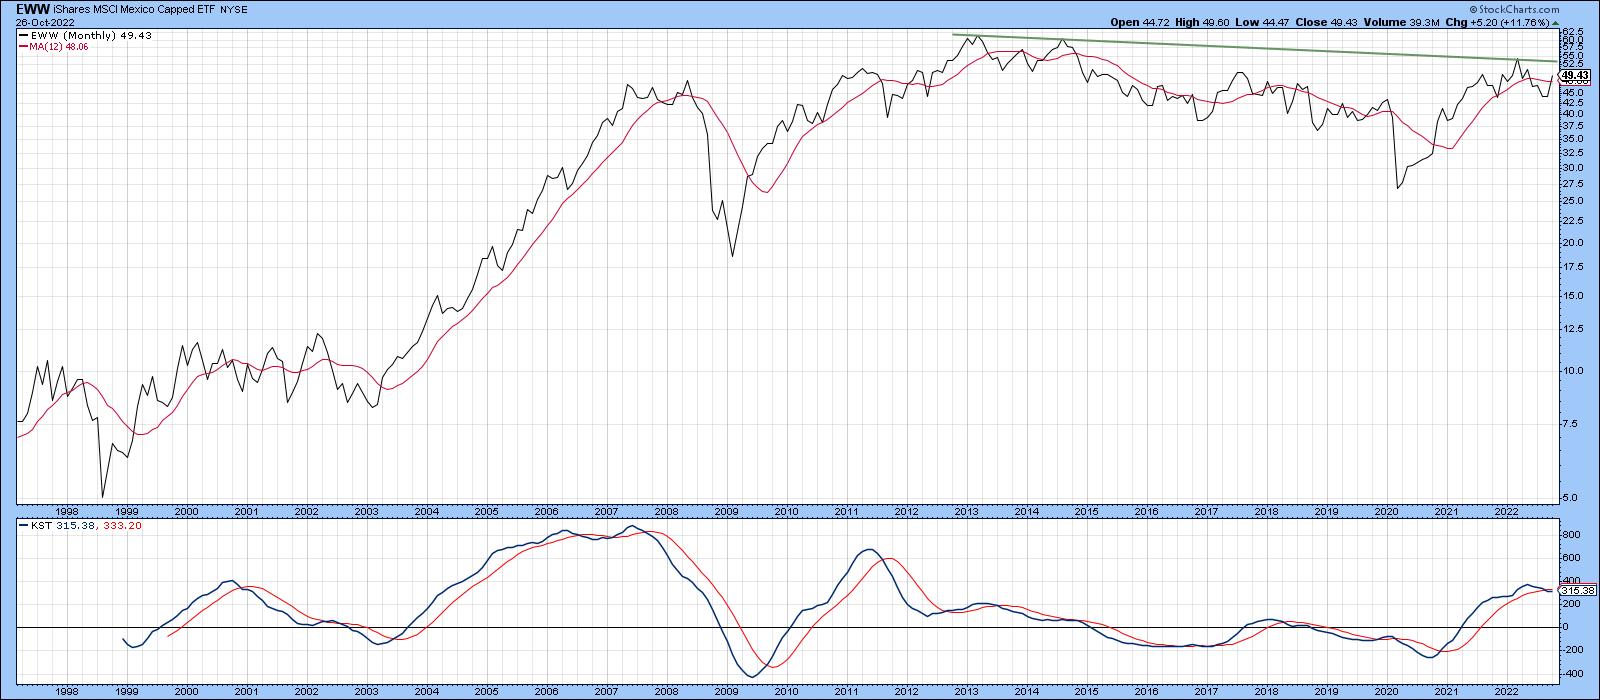
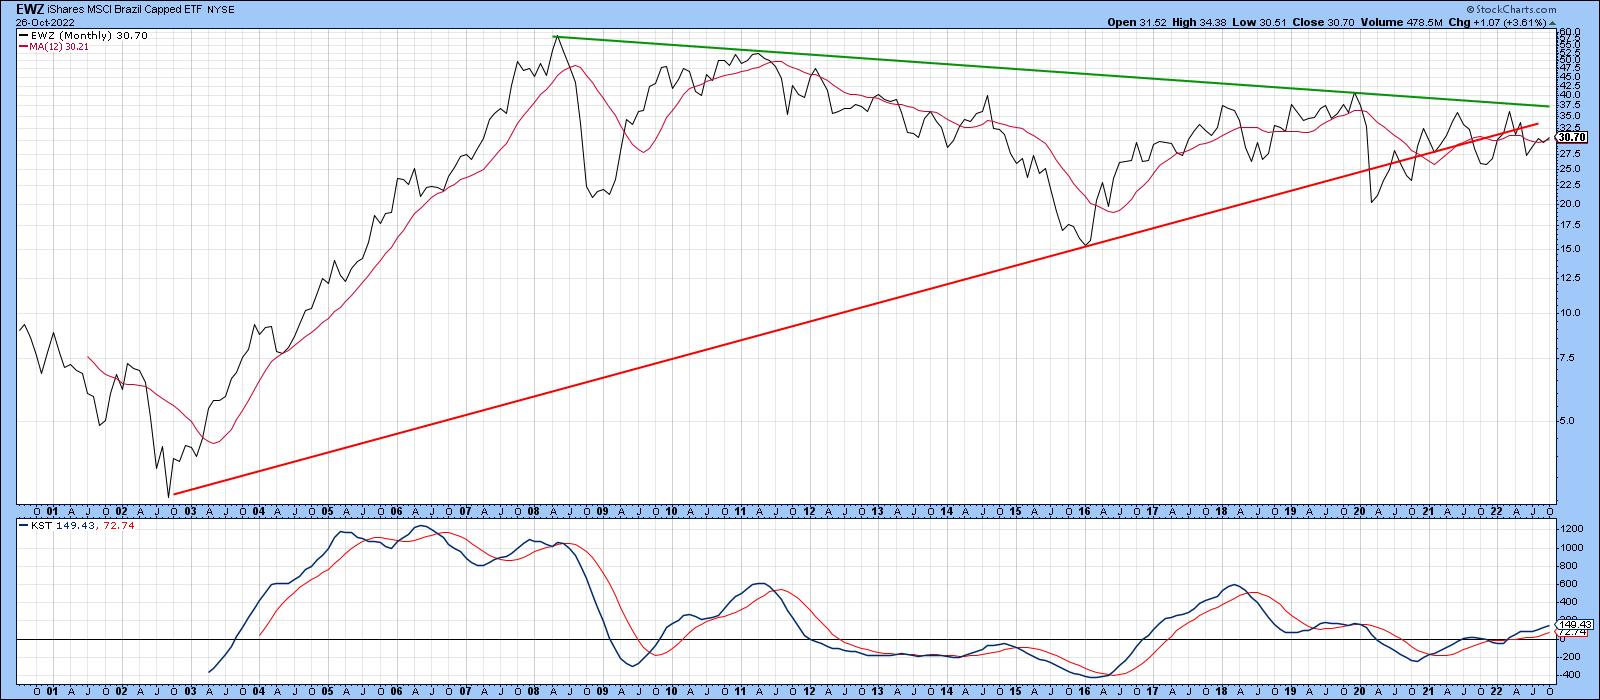
Latin America, in the form of the iShares MSCI Mexico ETF (EWW) and the iShares MSCI Brazil ETF (EWZ), is featured in Charts 4 and 5. The EWW has yet to break above its 2012-2022 resistance trendline, but, at a current $49, does not have to rally much to surpass it. The principal problem for the EWW is that its KST is overbought and declining.
That's not the case for its southern neighbor, Brazil. That's because its long-term momentum is in a relatively early phase of a primary uptrend. The challenge here, lies at the 2007-2022 down trendline at $37.50. A move above that point would take the price well above its 12-month MA and allow it to clear the extended red up trendline.
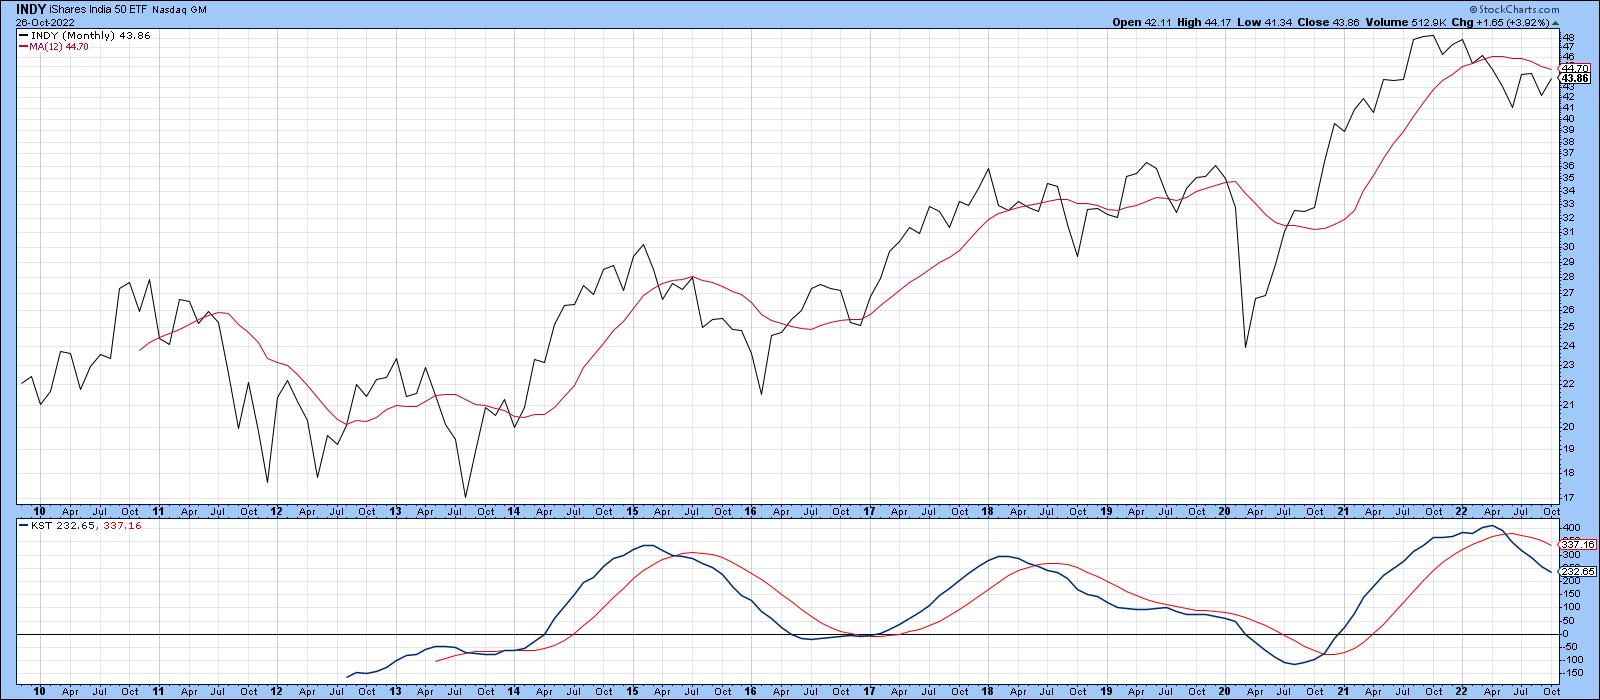
Finally, the iShares India 50 ETF (INDY) is technically in a bear market, since price and KST are below their respective MAs. However, my analysis is concerned with ETFs that are within striking distance of a new high in the event that global equities have begun a new bull market. In that respect, INDY is close to 10% of that goal.
Country ETFs Breaking Long-term Support
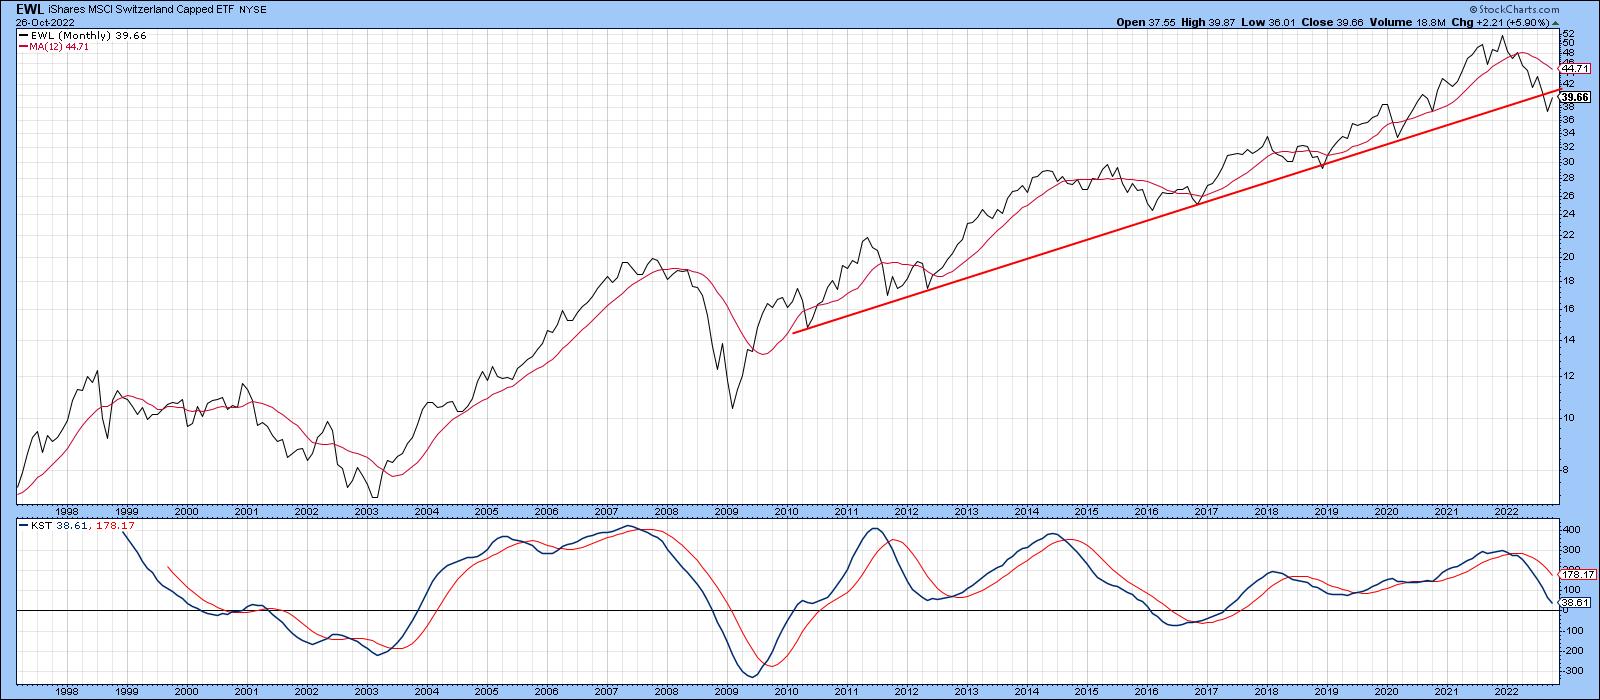
On the other side of the ledger are a number of country ETFs that have recently violated long-term trendlines. Take Switzerland, for example. The iShares MSCI Switzerland ETF (EWL) has dropped below its secular up trendline that dates back to 2010. A declining KST is consistent with such action.
The iShares MSCI Emerging Markets ETF (EEM), in Chart 8, has just violated its 2009-2022 up trendline. This event followed a false upside breakout in late 2020 . It represents a classic example of how whipsaws are followed by an above-average move in the opposite direction to the break.
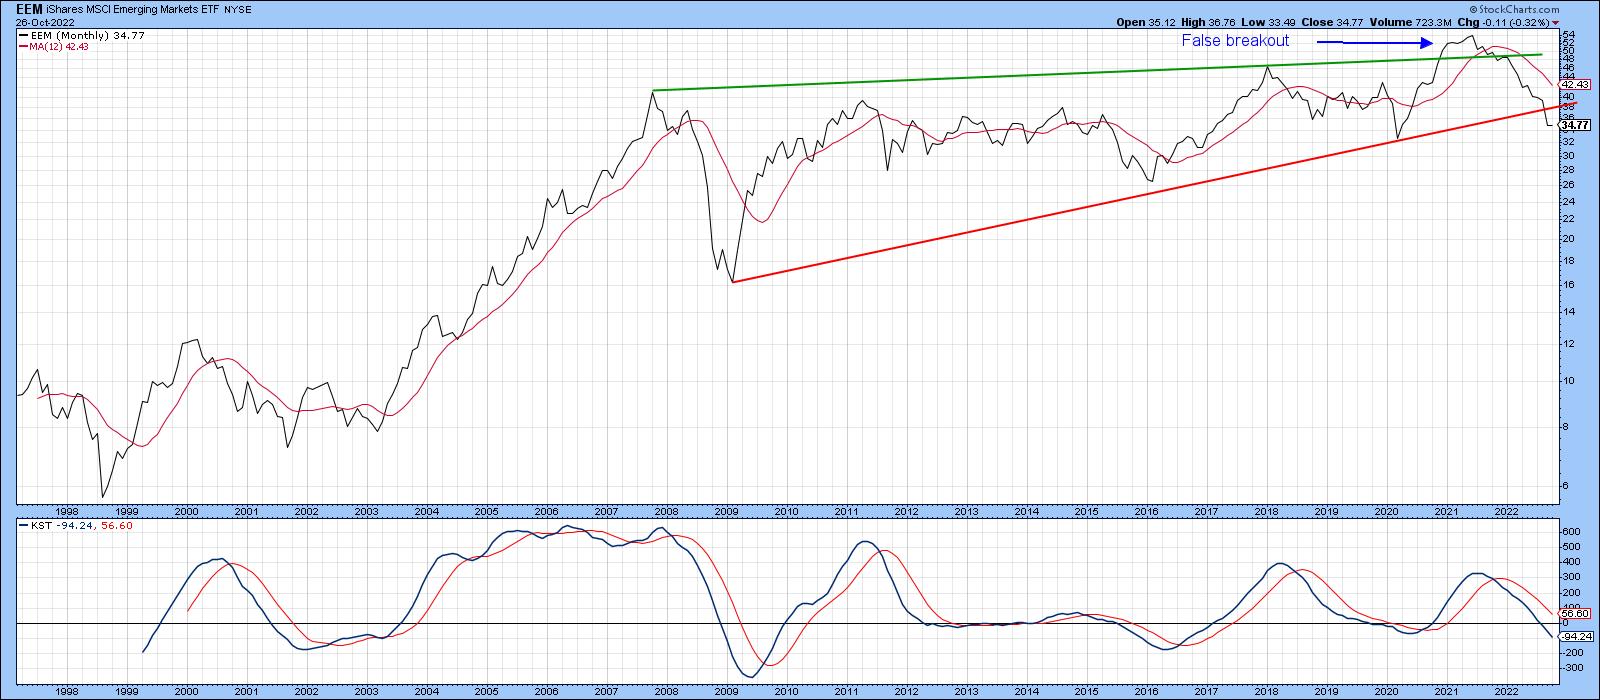
Chart 9 sports a nice up trendline for iShares MSCI Taiwan ETF (EWT), which turned back numerous declines prior to its September violation. It's obviously oversold on a short-term basis and likely to experience some digestion of recent losses. However, as long as it remains below the extended secular bear trendline, caution is appropriate.
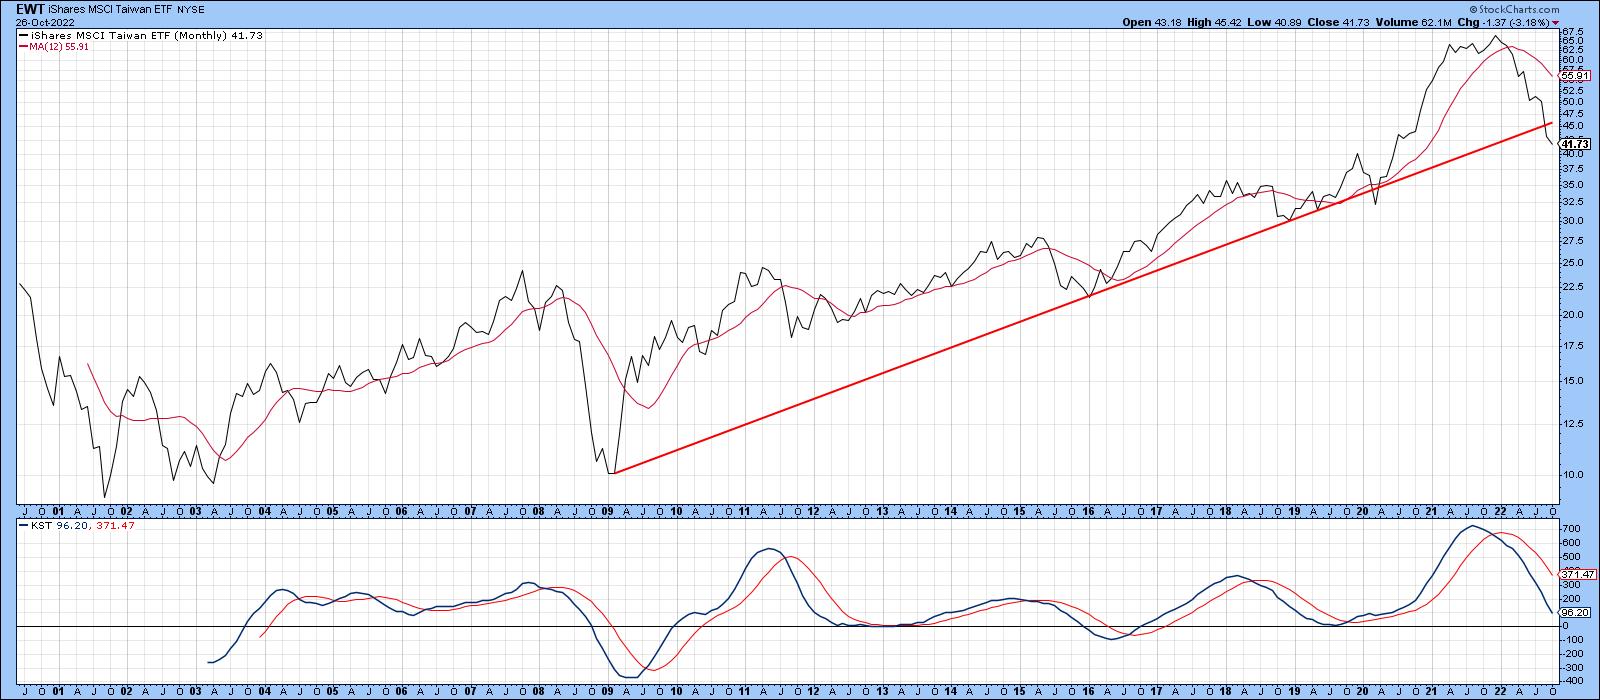
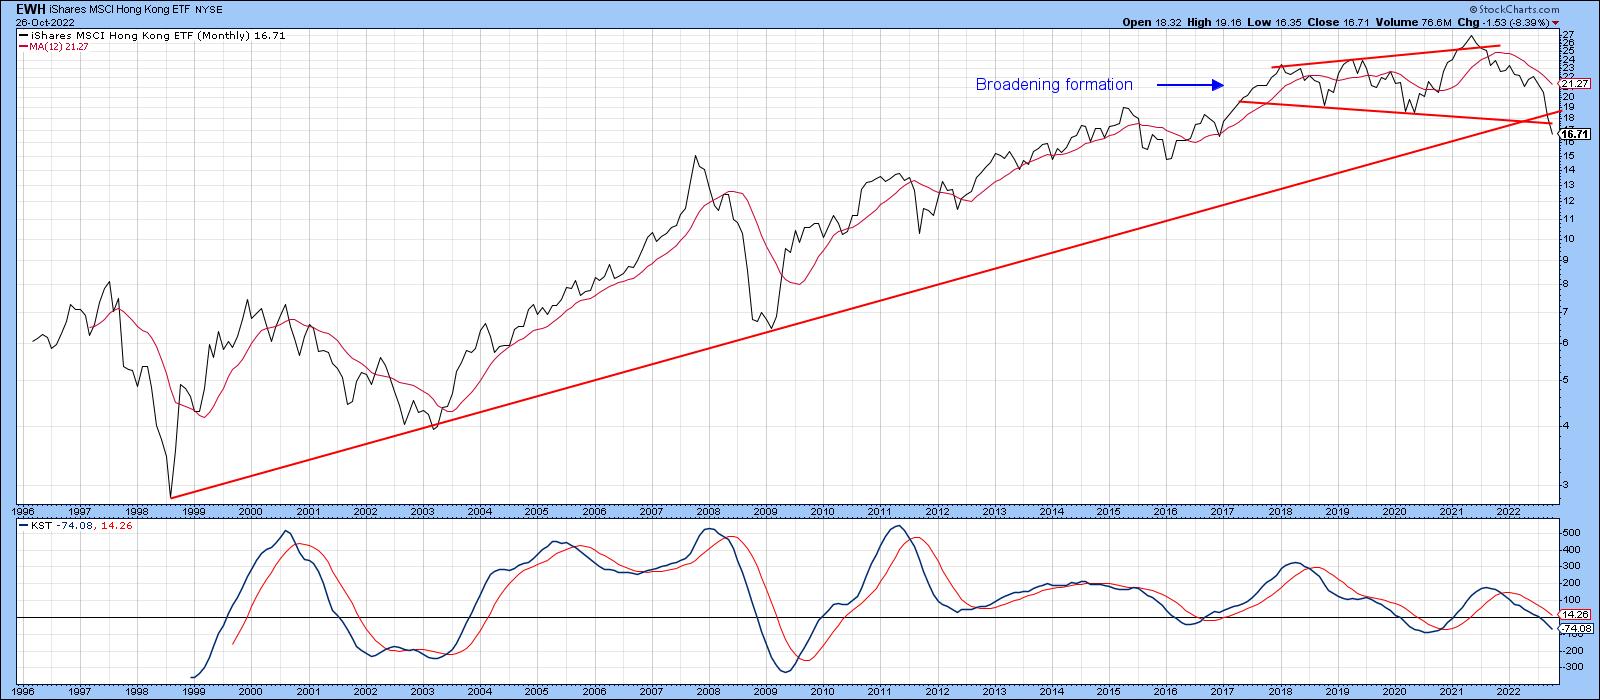
Chart 10 shows the iShares MSCI Hong Kong ETF (EWH), which has violated a 23-year up trendline and completed a five-year broadening formation. Since the KST is not yet oversold, that break is likely to be valid.
Global Conditions Look Oversold
Several countries are not that far from an upside breakout should the primary trend revert to a bull. On the other hand, several country ETFs have already broken down in a major way. If the current global oversold conditions can generate a rally, many of these downside penetrations would turn out to be false, which itself would likely be followed by an above-average move on the upside. In the meantime, it's probably wiser to take a cautious stance, since the primary trend evidence is still negative and the downside breaks remain in force.
Good luck and good charting,
Martin J. Pring
The views expressed in this article are those of the author and do not necessarily reflect the position or opinion of Pring Turner Capital Groupof Walnut Creek or its affiliates.


