Tesla's Bear Market Low: Are We There Yet?

I don't usually get into individual stocks, but, back in August, I found Tesla's price action to be quite interesting. That's because I felt the stock, along with its fearless leader Elon Musk, were important icons of the 2020–2022 phase of the post-financial crisis secular bull market. As such, Tesla (TSLA) had the bell-weather potential to help us determine whether a new primary uptrend had begun in the early summer of 2022 or if the bear was in hibernation. By re-grouping and rallying, it would be signaling a positive resolution. However, by breaking down, it was more likely to provide a bearish lead role.
TSLA, Technically Speaking
Chart 1, reproduced from the article, shows the price had traced out a large head-and-shoulders top between late 2020 and 2022. Instead of selling off sharply, it subsequently experienced a trading range and broke back above the extended neckline. The right-hand part of the chart shows the price turning back from its 200-day moving average (MA) and, once again, challenging the breakout point. again. The relative strength (RS) line replicated this action.
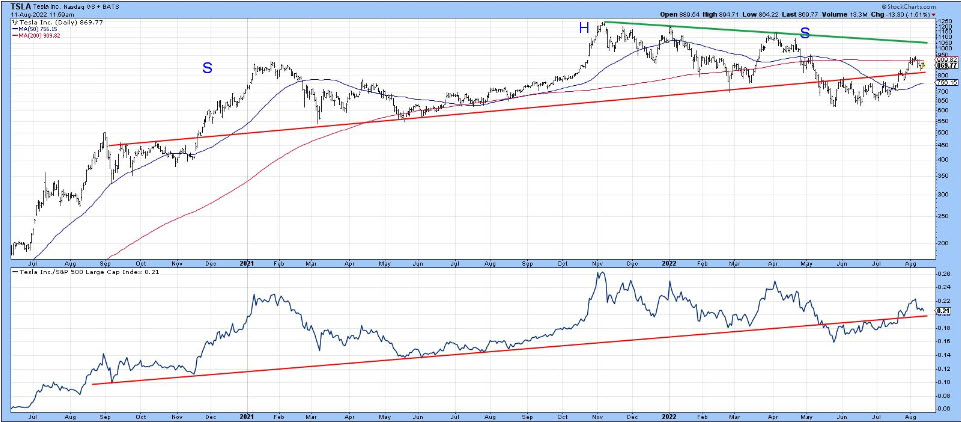
CHART 1: A LARGE HEAD-AND-SHOULDERS CHART PATTERN IN TSLA.
Chart source: StockCharts. For illustrative purposes only.
At the time, it was vitally important for the price to hold above the extended neckline, in order to avoid a double false breakout similar to the price action shown in Chart 2 for the 1946 top in the Dow Jones Industrial Average ($INDU). Remember, false breakouts, when confirmed, are usually followed by an above-average move in the opposite direction to the breakout. Double false breakouts up the ante a step further.
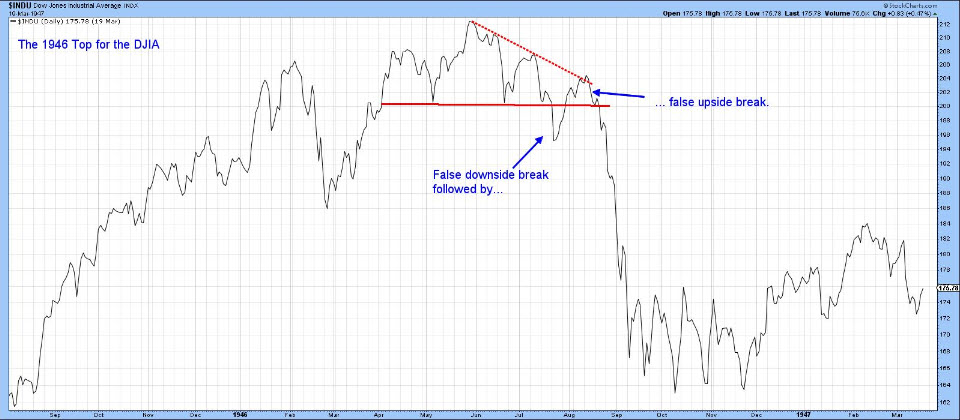
CHART 2: FALSE BREAKOUT. Here you see a false upside breakout followed by an above-average move in the direction opposite to the breakout.
Chart source: StockCharts. For illustrative purposes only.
Chart 3 updates Chart 1 to 2023, where you can see that TSLA had one more small rally left, prior to a violation of its extended neckline and a subsequent waterfall decline. The stock is definitely in a bear market, but whether it will fulfill my theory that a TSLA collapse to new lows would drag the whole market with it is still open to question. It's true that the stock dropped to a post-June low in October, but that was a marginal sell-off, not one commensurate with the collapse of an icon, which is what has happened to TSLA in the intervening months. At that marginal new market low in October, signs of real capitulation were missing, some of which were discussed in this article.
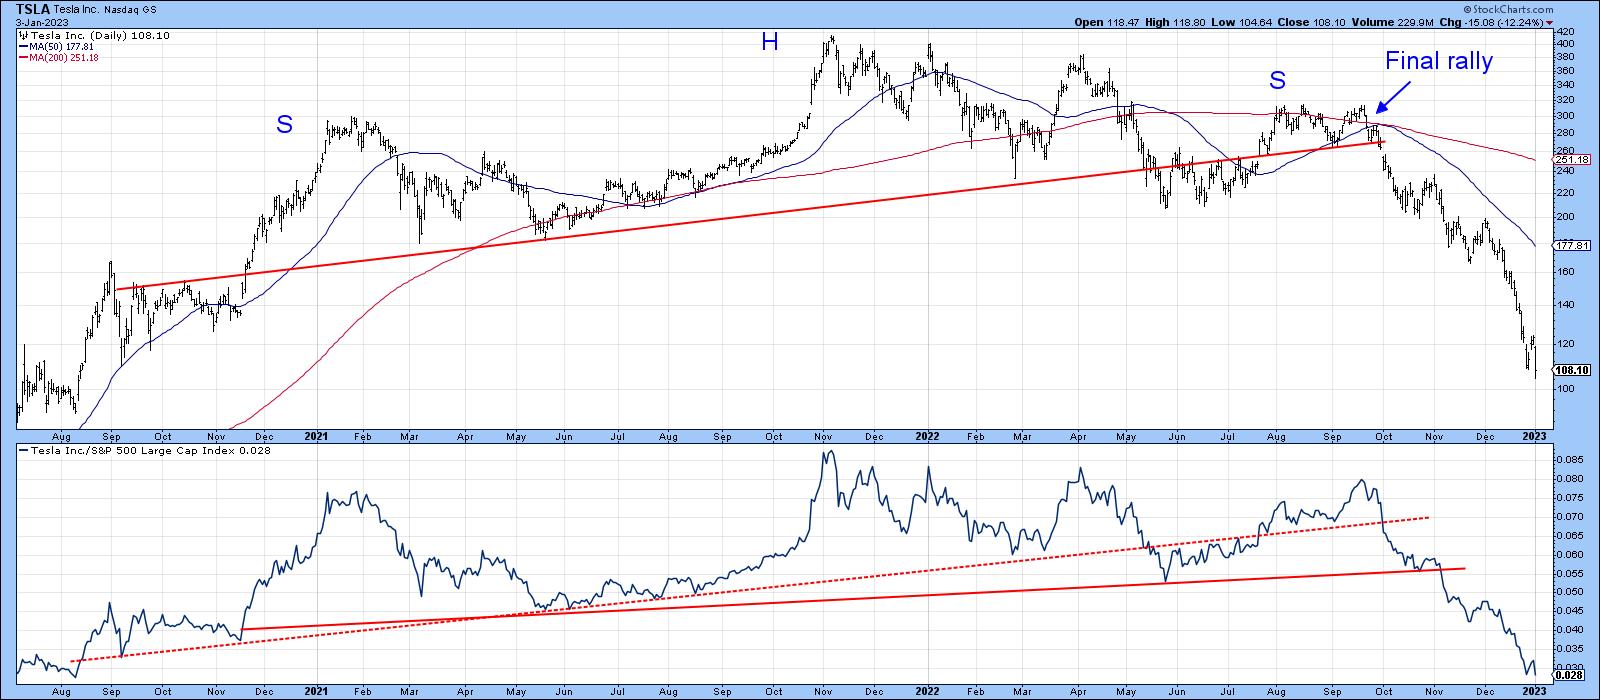
CHART 3: ONE FINAL RALLY FOR TSLA. After the small final rally, TSLA stock broke below its extended neckline and declined rapidly, and looks like it may have more downside left.
Chart source: StockCharts. For illustrative purposes only.
Where Does Tesla Go From Here?
The answer to that question is unknowable. However, it is possible to look at some downside projections based on the depth of the 2202–2022 top featured in Chart 4. The first thing to note is that price has already achieved its minimum ultimate downside objective at a recent $107. Given the widespread coverage of the recent sharp sell-off, it could be argued from a contrarian aspect that the downside projection has already been met and that TSLA is currently experiencing "the" low. I can't argue with that, except to say that the longer-term indicators remain bearish. Consequently, all we can realistically do at this point is call for a relief rally and see how things pan out. After all, the long-term KST in Chart 5 has barely dropped below its equilibrium point and is nowhere near an oversold reading from which you could reasonably expect a buy signal to be generated.
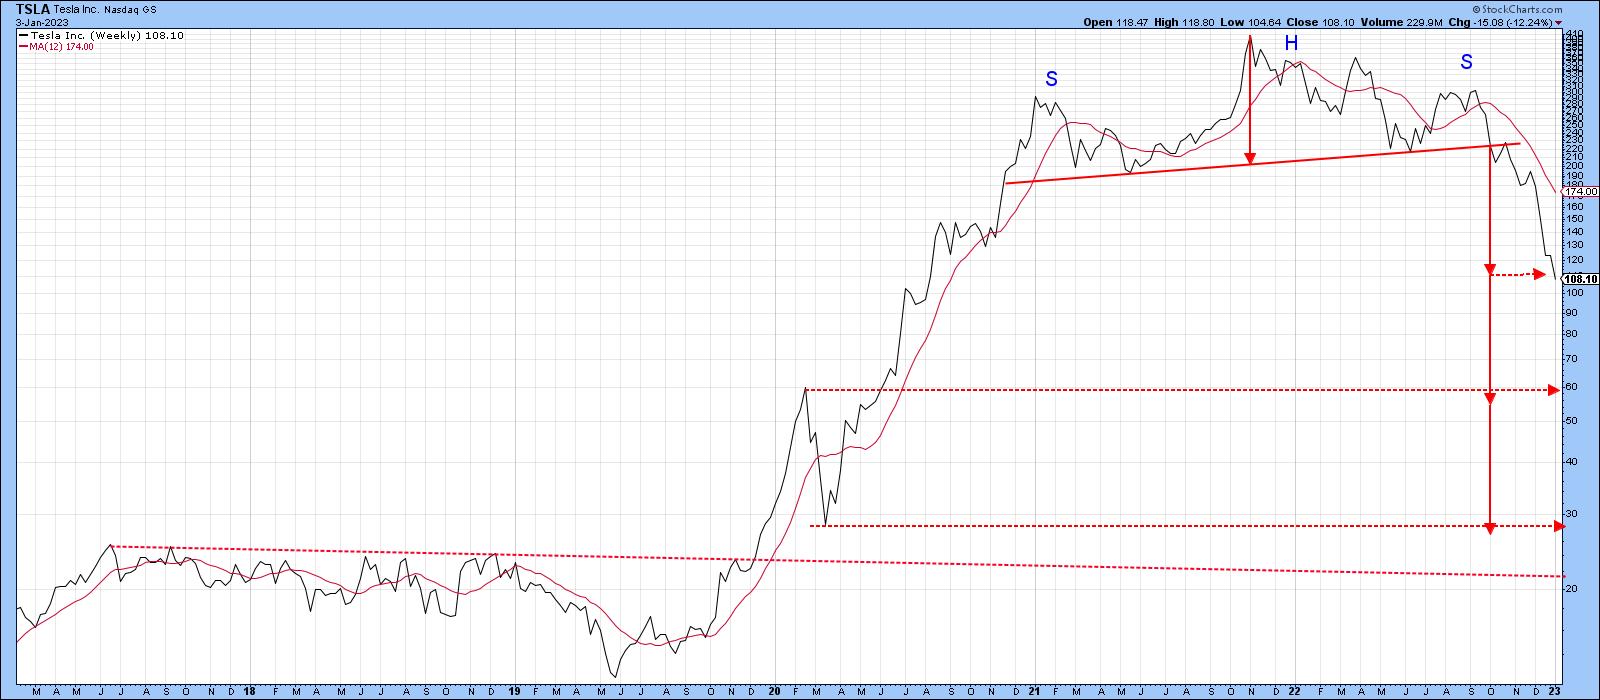
CHART 4: HOW LOW CAN TSLA GO? Looking at this chart, TSLA's stock price has reached its minimum ultimate downside objective. There's a chance of a potential relief rally but if long-term indicators continue to be bearish, trade with caution.
Chart source: StockCharts. For illustrative purposes only.
That said, it's evident the bull market, apart from the sharp 2020 decline, was a straight-line-up affair, generating little in the way of support. Bearing in mind that previous highs and lows represent potential future support levels, the next two multiples of projected downside action approximate the early 2020 high and low at around $60 and $30 respectively. That doesn't necessarily mean either will be achieved, but they would be intelligent places to expect a reversal in the event price moves lower. Regarding the question of whether TSLA will be a reliable leading indicator for the bear market itself, I think we are likely to find out relatively early in the first quarter.
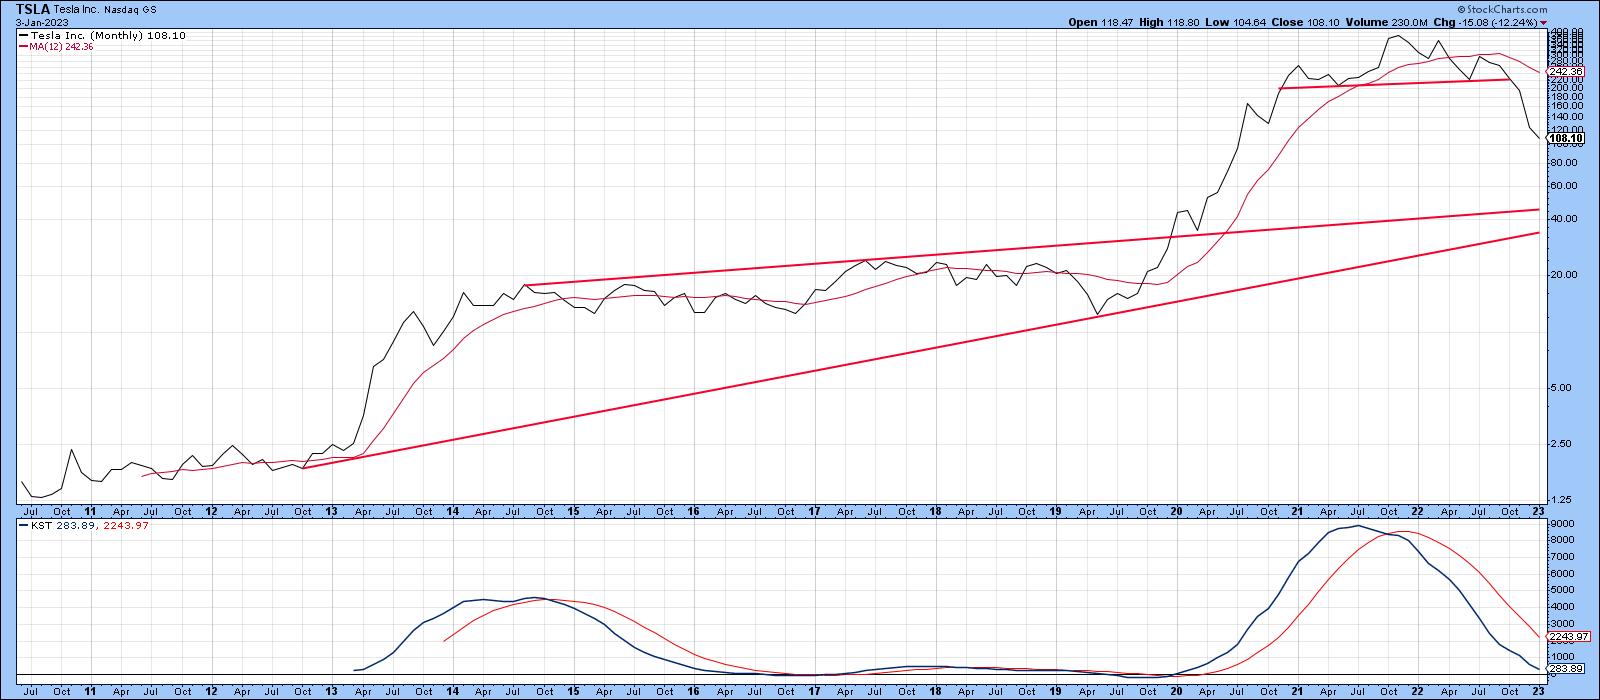
CHART 5: LONG-TERM KST INDICATOR IS NOWHERE NEAR OVERSOLD. There may be more downside in TSLA's stock price.
Chart source: StockCharts. For illustrative purposes only.
Good luck and good charting,
Martin J. Pring
The views expressed in this article are those of the author and do not necessarily reflect the position or opinion of Pring Turner Capital Groupof Walnut Creek or its affiliates.


