These Four "Basket Cases" Have Great Looking Charts
We are all aware of the investment principle that it's time to buy when the news is blackest. Even knowing this, it's always difficult to step up and click on that buy button, because the problems seem unsolvable. Moreover, how do we know for sure that another shoe isn't going to drop? We don't of course, but sometimes the charts can be used to help us decide.
Most weeks, I rank a list of 60-or-so individual country exchange-traded funds (ETFs) on a 52-week rate of change (ROC) basis, and have found that the top 10 usually offer above average returns until they drop out of the list. What's interesting is that a substantial number of the current top 10 represent countries that have had well-publicized economic or political problems in the last year or so. Moreover, most have great looking charts, albeit a bit overstretched on a short-term basis.
Take the UK, for instance. Several months ago, it was being chastised in the media for being unstable. After all, the country had just gone through three prime ministers at an unprecedented rate, the pound was crashing and the word "banana" was being widely used in press reports.
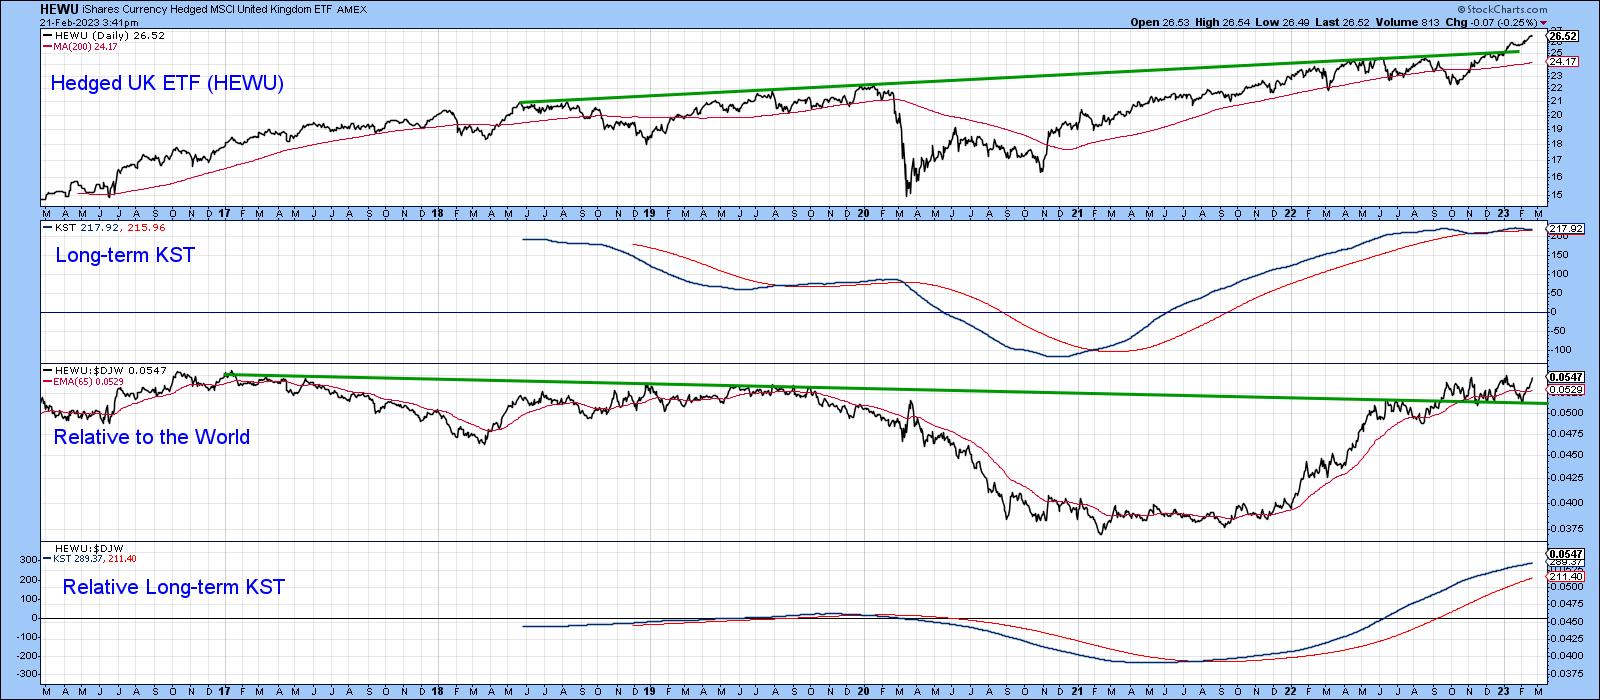
Chart 1 shows that such reports were greatly exaggerated. This arrangement, like all the charts in this article, features the weekly price, long-term Know Sure Thing (KST), the relative strength (RS) line against the Dow Jones Global Index and the KST calculated from that relative strength line. Ideally, we want to see all four components trading above their exponential moving average (EMA). It's important to have price and relative strength in a positive trend. The chart shows the price for the iShares Currency Hedged MSCI UK ETF (HEWU) recently cleared a resistance trendline that traces its roots back to 2018. The RS line has also cleared massive resistance in the form of a 2017-2022 trendline. The only thing not to like about the chart is the moderately overextended nature of the absolute KST.
There's no doubt that the tragic earthquake in Turkey will have a debilitating effect on the economy. To quote the New York Times on February 19, "Before the devastation, which also left millions homeless, Turkey was already reeling from a collapsing currency and runaway inflation that had reached an annual rate of 85 percent in October. Those vulnerabilities have punched holes in the nation's balance sheet and tipped Turkish families and businesses into a cost-of-living crisis".
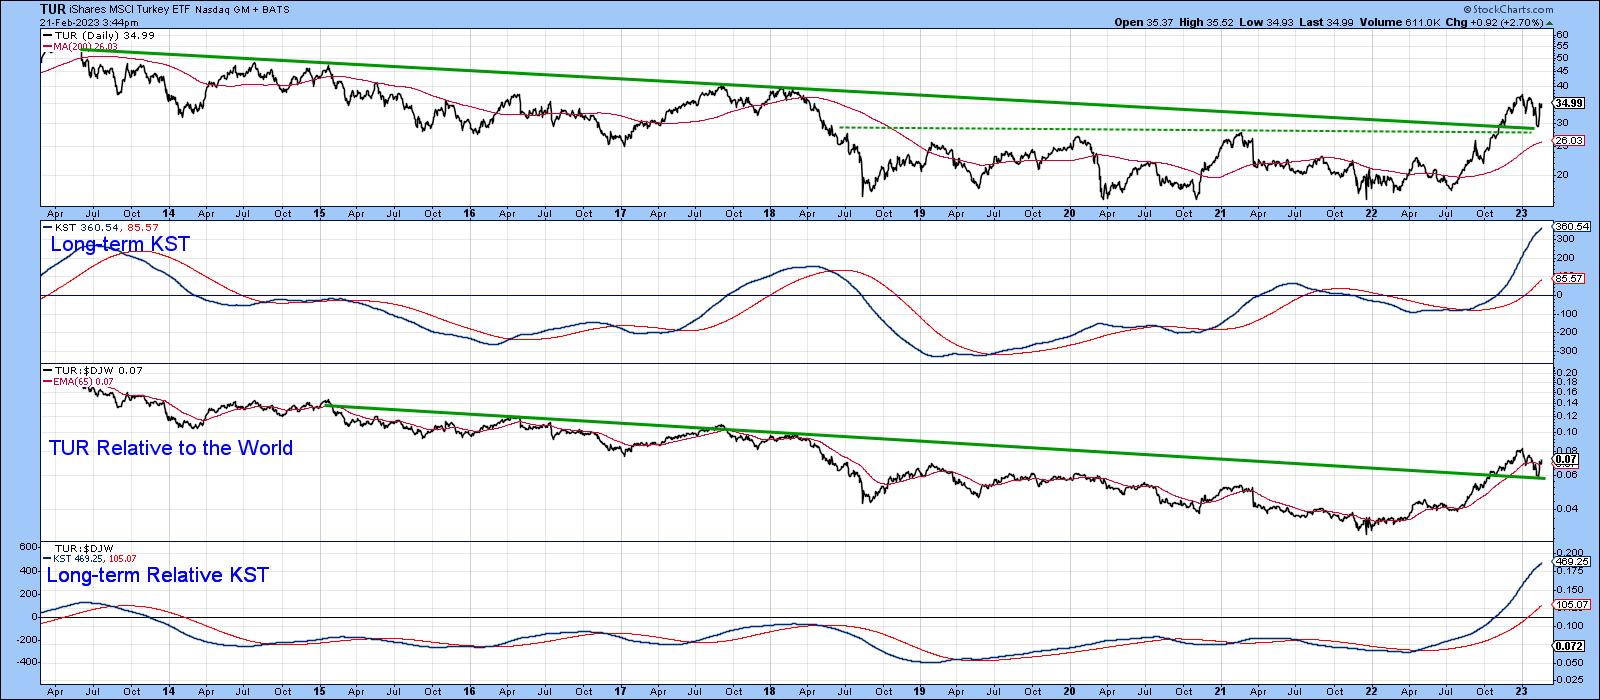
Despite the bad economic news prior to the earthquake, the iShares MSCI Turkey ETF (TUR) ETF still came in number one on my list of country performers last week, with an 82% gain year-over-year. Remember, the ETF is priced in US dollars, not Turkish lira. Chart 2 shows that, even factoring in the horrific damage done by the earthquake, the breakout from the two extended converging trendlines still held. At this point, all four series in the chart are trading well above their respective EMAs.
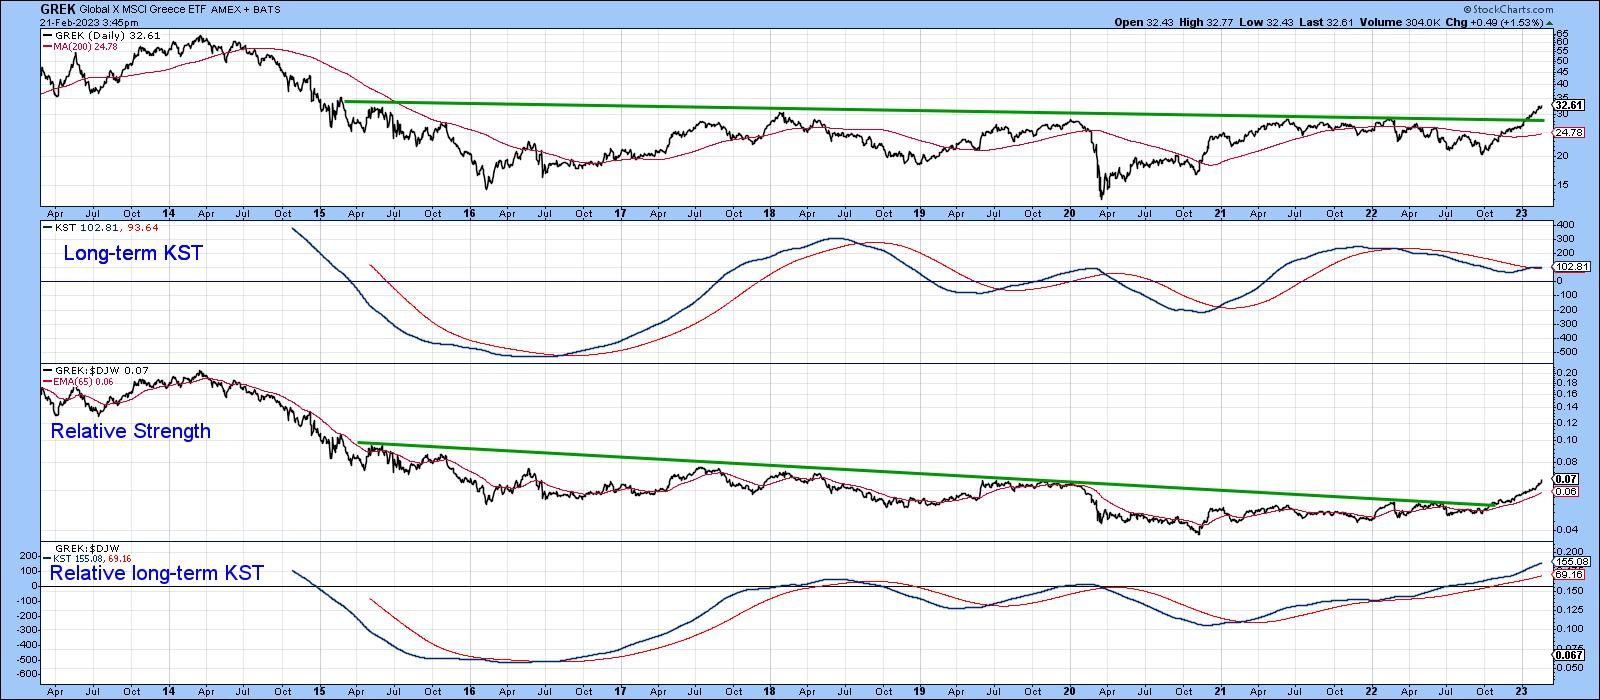
A few years ago, Greece was unquestionably regarded as the sick economic man of Europe. Many may still think of the country that way, but the chart suggests otherwise. That's because the last few years have enabled the Global X MSCI Greece ETF (GREK) to form a multi-year base and experience a decisive breakout. All four series are now positively positioned against their EMAs.
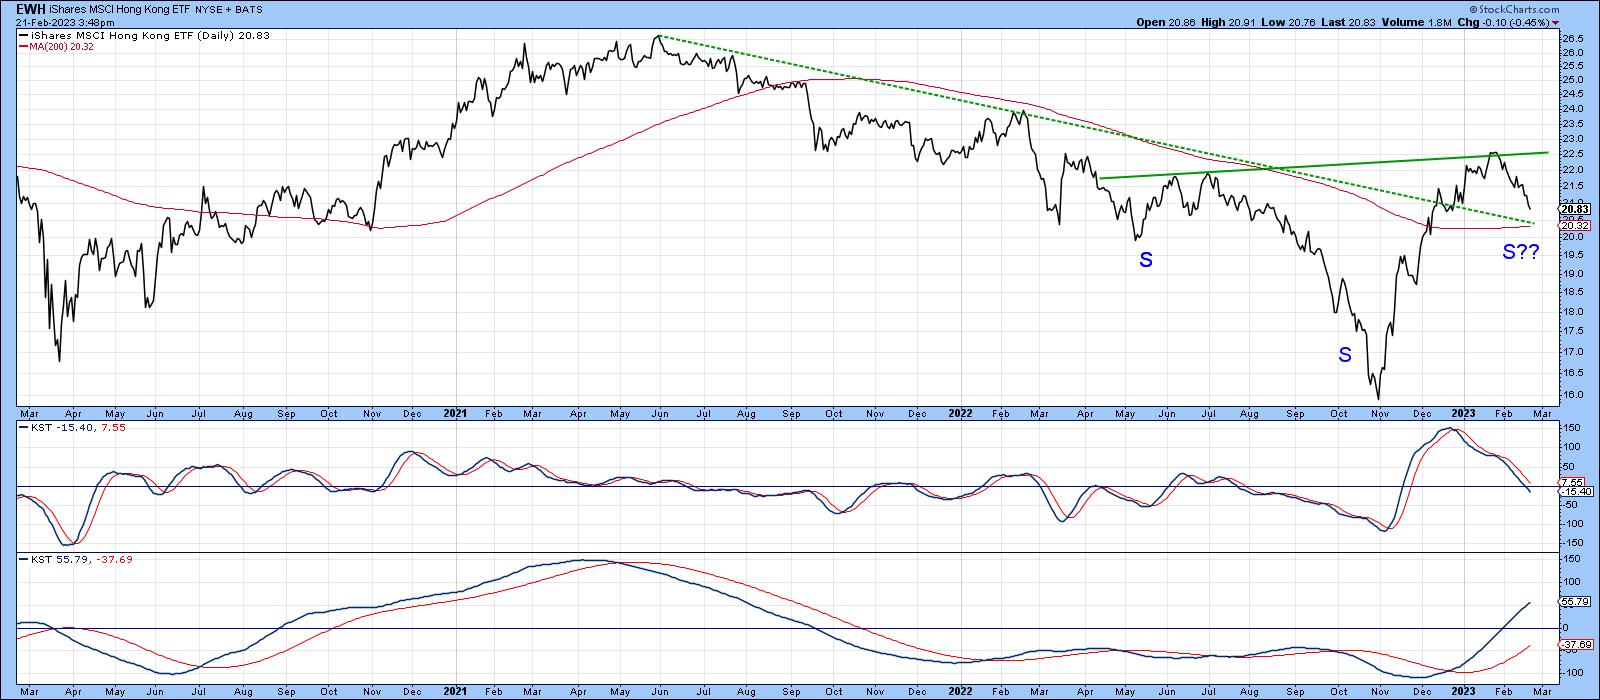
The year 2021 and most of 2022 were unkind to the Hong Kong market, largely because of the political takeover by China and the Chinese government's perceived hostile attitude to business in general. Technically, the result was a break below the 2012-2022 red support trendline, which looked pretty ominous at the time. The RS line has really been in a neutral trend since mid-2020, under the background of a rising relative KST. Circling back to the price, it now looks as though that downside break was a whipsaw.
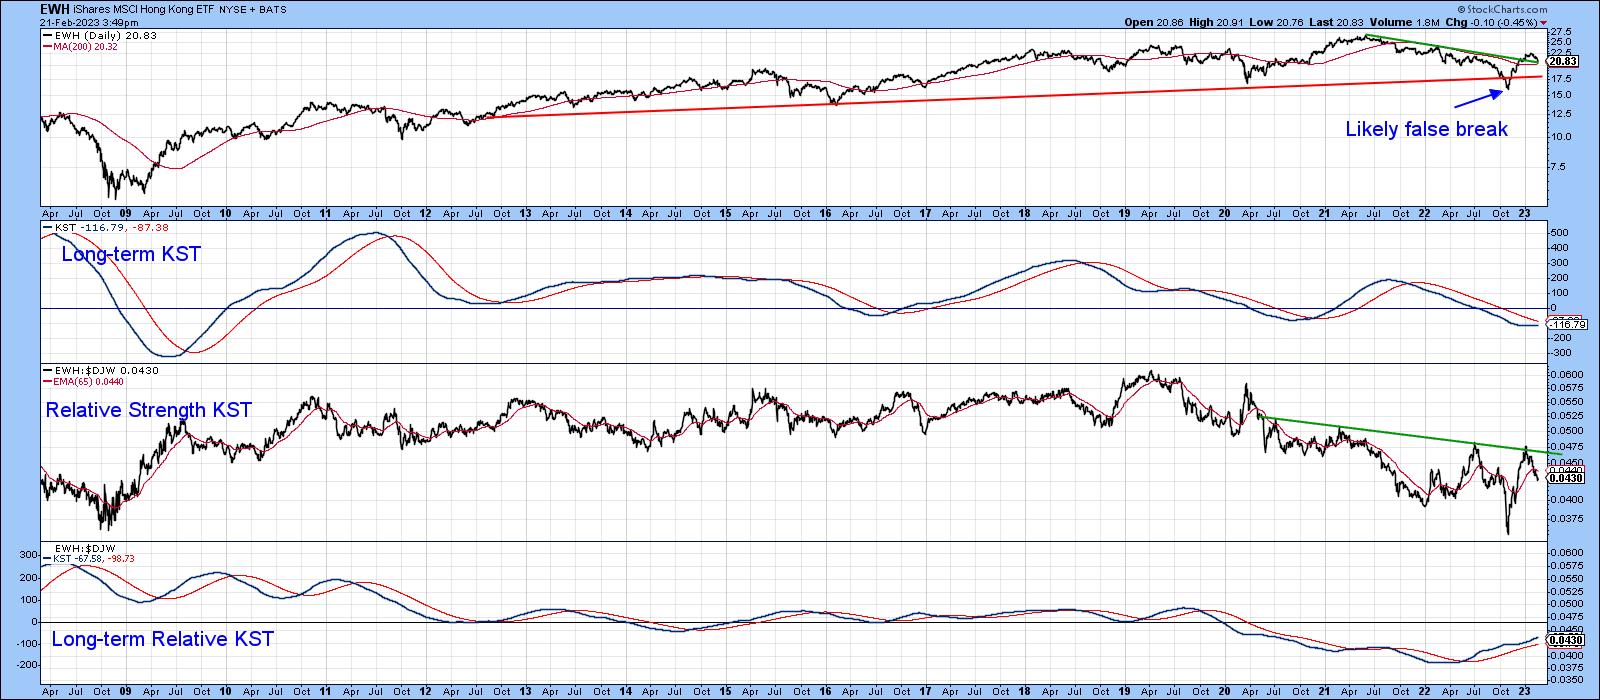
The reason being that it has since managed to cross above its bear market down trendline and 65-week EMA. The issue will be placed beyond a reasonable doubt in the event that the price can rally and hold above the $22.50 level, as that is where the neckline of a potential reverse head-and-shoulders pattern is residing. Chart 5 shows this potential setup in greater detail. Incidentally, EWH has not yet reached the coveted top 10, which could explain its more questionable technical status.
Good luck and good charting,
Martin J. Pring
The views expressed in this article are those of the author and do not necessarily reflect the position or opinion of Pring Turner Capital Groupof Walnut Creek or its affiliates.


