Trying to Unravel the Enigma of the US Dollar
The US Dollar Index ($USD) has taken a hit in the last few months, causing many commentators to cry "bear market." However, an examination of the long-term indicators doesn't indicate a consensus pointing in a southerly direction. Neither is there unanimity that the recent setback represents a counter-cyclical correction in an ongoing bull market.
The Very Long View
The US Dollar Index chart (see Chart 1) plots $USD on a quarterly basis, together with its nine-quarter moving average (MA). It also displays the Coppock Curve. Currently, this oscillator is above its MA, and $USD itself is trading north of its 36-quarter (nine-year) MA. Even though these are not the world's timeliest indicators, they place $USD in a positive very long-term trend. If you look carefully at the action since the low in 2008, you will also see that $USD has succeeded in tracing out a series of rising peaks and troughs. That pattern remains intact. Finally, $USD has decisively ruptured its secular down trendline, featured in Chart 2.

The Long View
That same monthly chart also displays the long-term KST and 12-month MA for $USD. The pink shadings display when both series were below their MAs for an extended period. The KST is overstretched but remains bullishly above its average. However, it has begun to stabilize, as a likely prelude to a decline and negative MA crossover. Finally, $USD itself has dropped below its 12-month MA, which is never a healthy sign.
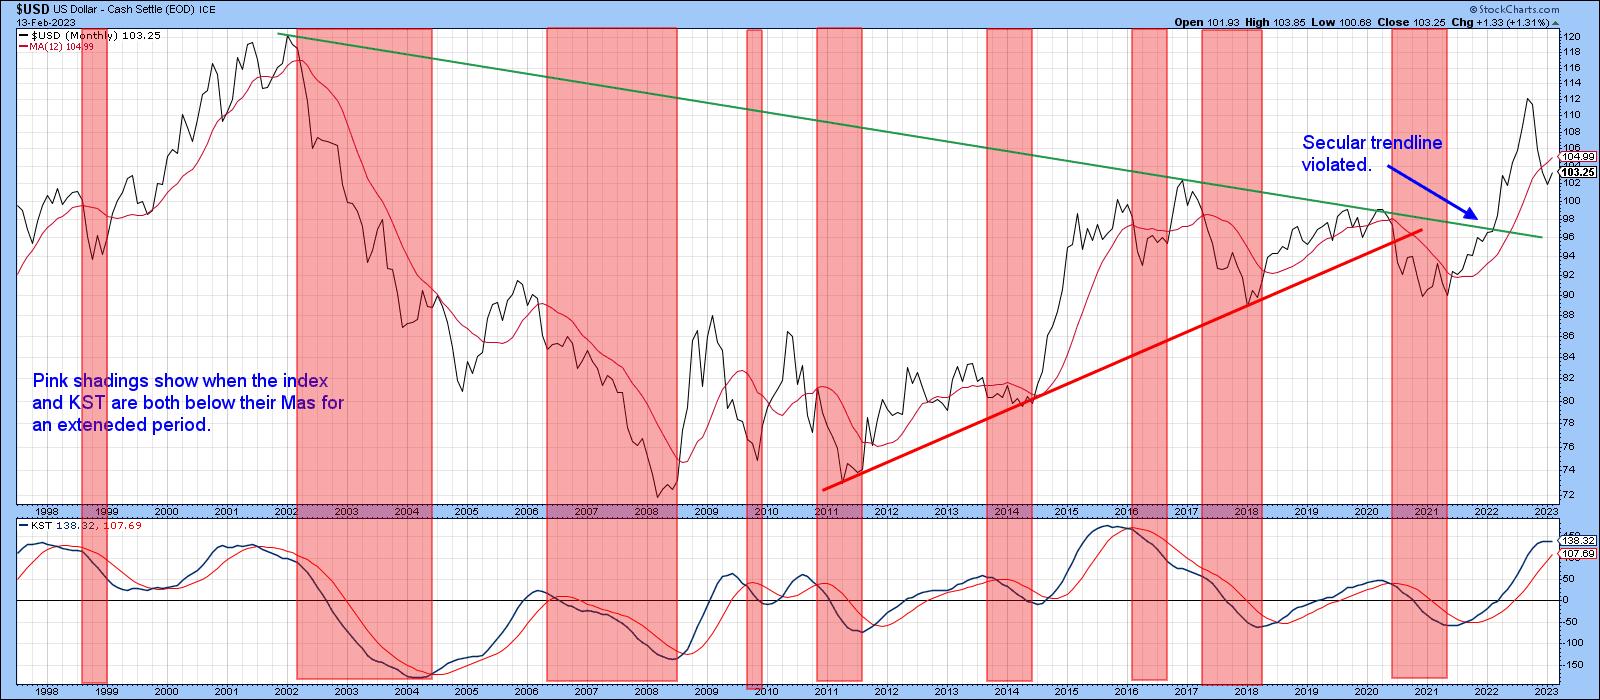
Chart 3 compares the Index to a PPO incorporating the six- and 15-month parameters. This time, the green-shaded areas reflect periods when the oscillator is bullish. That's when the shorter-term exponential MA is above its longer-term counterpart, i.e. when the indicator is above zero. Right now, this technique is in a positive mode, but the oscillator is falling sharply toward the equilibrium point. Based on its current trajectory, a negative crossover is likely to develop within 90 days.
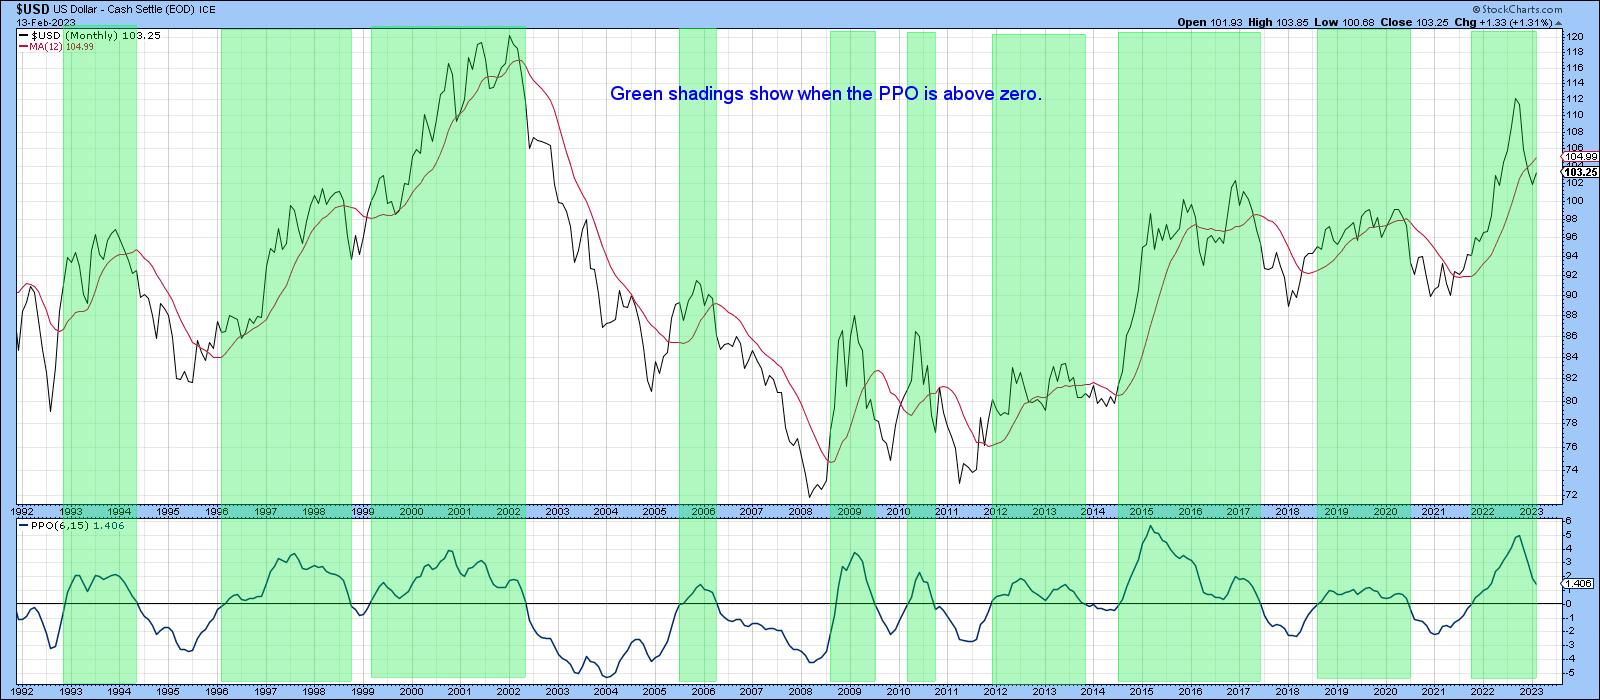
Chart 4 offers a more pessimistic view since $USD is below its 200-day MA. In addition, the Special K (SPK) is below its signal line. The pink shadings flag previous instances when both series have been negatively positioned against their moving averages for an extended period. The violations of two bull market trendlines add to the chart's negative vibes.
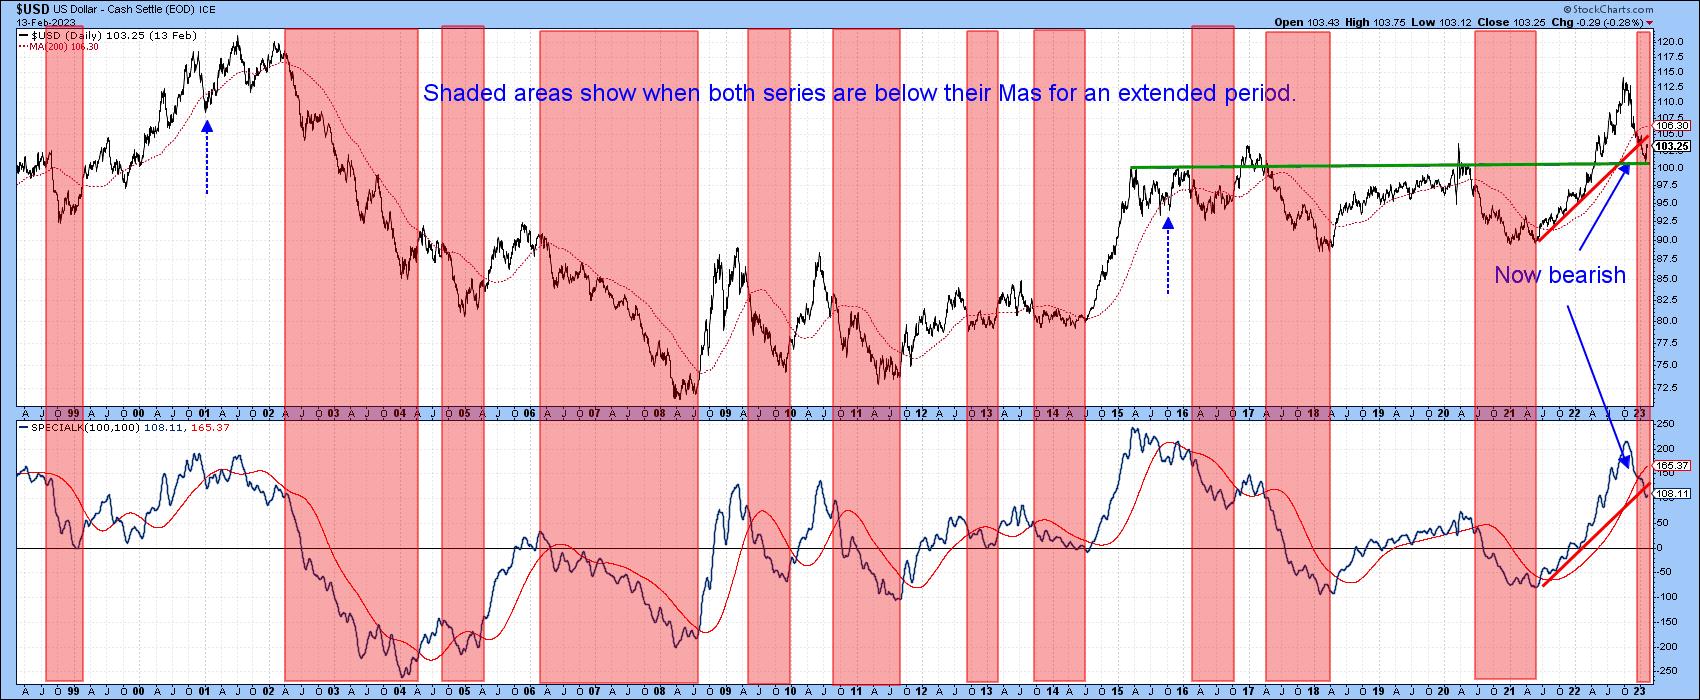
It's also possible that the 2022 decline represents the first down leg of what may turn out to be a multi-year trading range. That outcome would fit in with the positive longer-term outlook provided by Chart 1 and the violation of the secular down trendline in Chart 2. The floor would likely be the recent low and the horizontal trendline in Chart 4.
The Intermediate View
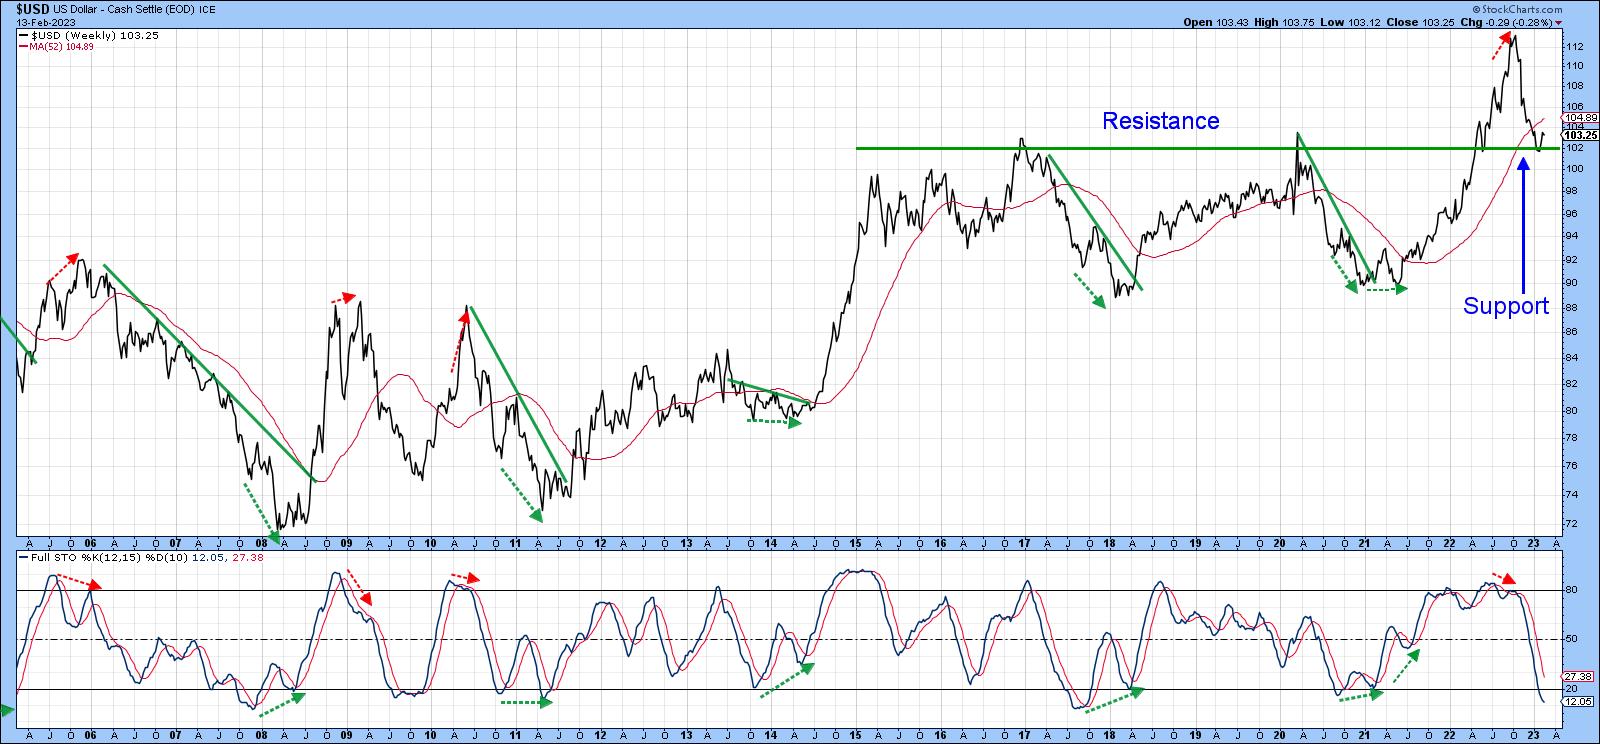
It seems likely an intermediate rally began in mid-January. First, the weekly stochastic oscillator, using the 12, 15, and 10 parameters, is almost as deeply oversold as it can get. Sometimes, as you can see from the dashed green arrows, a positive divergence is required to reverse the trend. However, when $USD recently fell into its oversold zone, it also reached a major support level, as indicated in Charts 4 and 5 by the horizontal green lines. An oversold market touching major support is usually followed by a bounce.
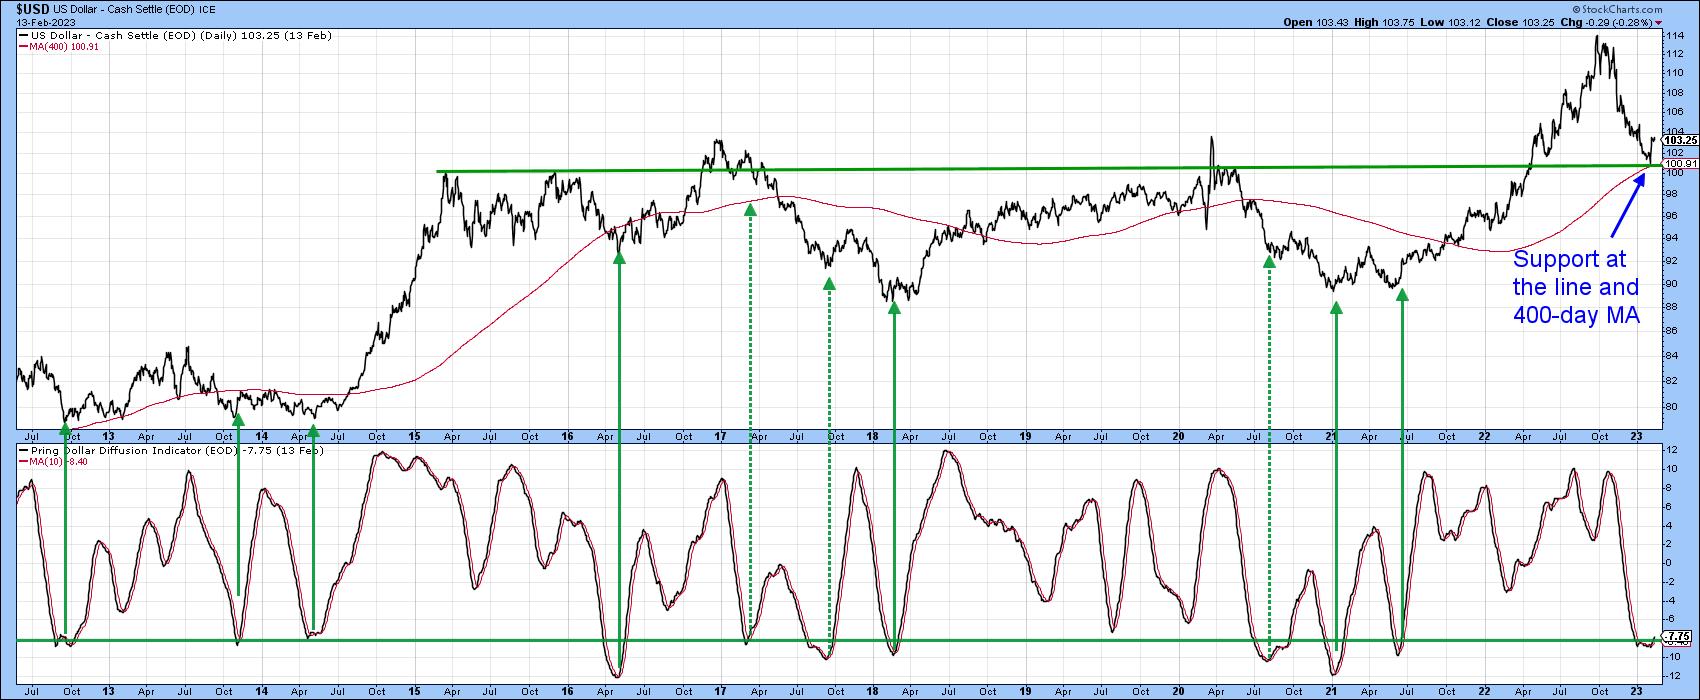
Finally, Chart 6 monitors daily activity through my Dollar Diffusion indicator. This series calculates the number of cross rates in a positive trend and is currently in a deeply oversold condition. The solid arrows flag valid upside oversold reversals; the dashed ones flag failed rallies and false positives. It's obviously not perfect, but, in most situations, it signals the end of a decline reasonably accurately. Its current overstretched condition, in conjunction with support at the green line and 400-day MA, suggests a worthwhile retracement rally of some kind is in the cards.
Where to for the Dollar
The long-term indicators are mixed, but not that far from a consensus bear market signal. On the other hand, the US Dollar Index has reached support at a time when it's deeply oversold. That means, if it's in a bear market, we're not likely to find out until the current intermediate oversold condition has been relieved. Prices trend up, and prices trend down, but, occasionally, things are resolved with a multi-month or multi-year trading range. Such a frustrating outlook may well turn out to be a reality for the balance of the year.
Good luck and good charting,
Martin J. Pring
The views expressed in this article are those of the author and do not necessarily reflect the position or opinion of Pring Turner Capital Groupof Walnut Creek or its affiliates.


