Don't Be Surprised by a Pleasant Surprise
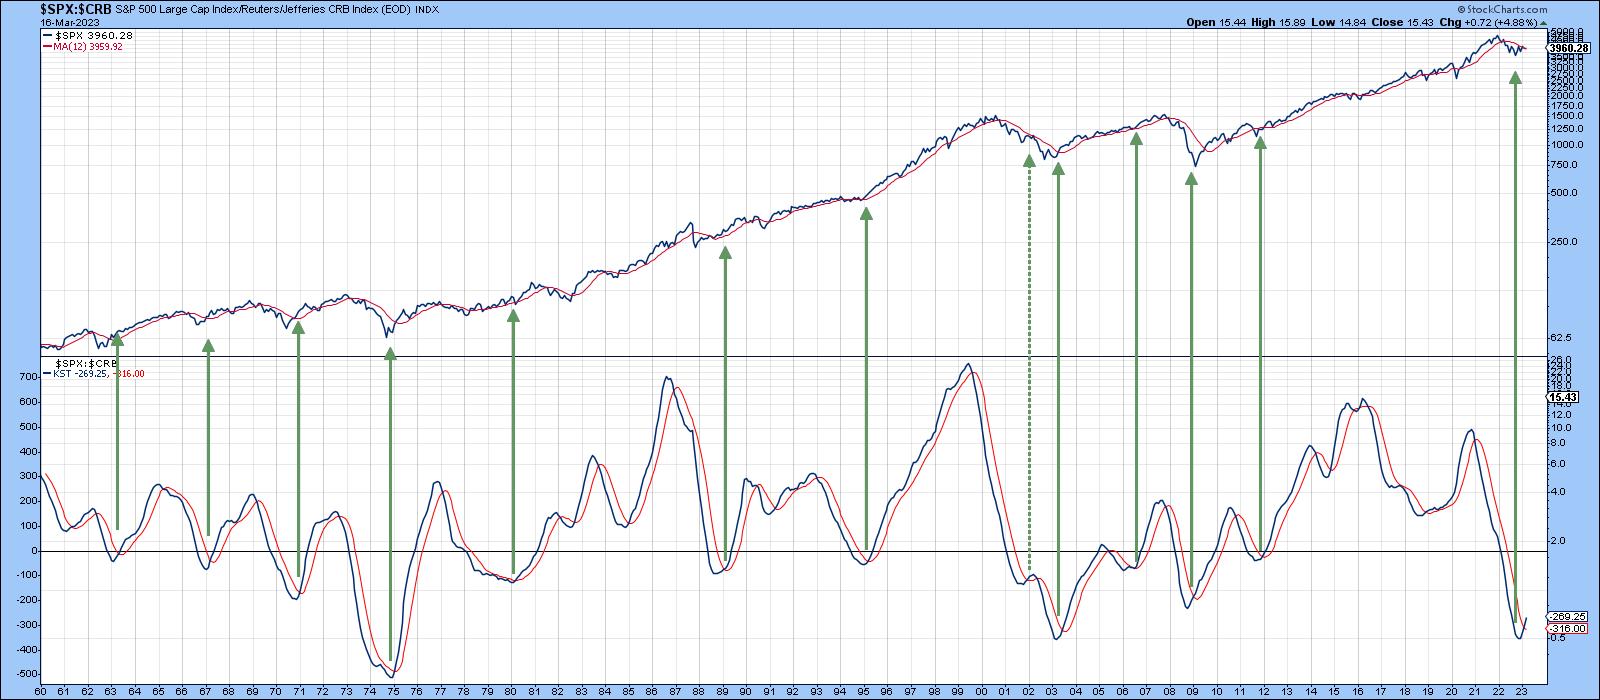
In early February, I pointed out that five consistently correct long-term indicators had triggered primary bull trend buy signals. The article certainly did not represent good timing from a short-term point of view, as the market has been selling off ever since. Nevertheless, these indicators remain in the bullish camp. Two have been updated in Charts 1 and 2, with a new addition featured in Chart 3.
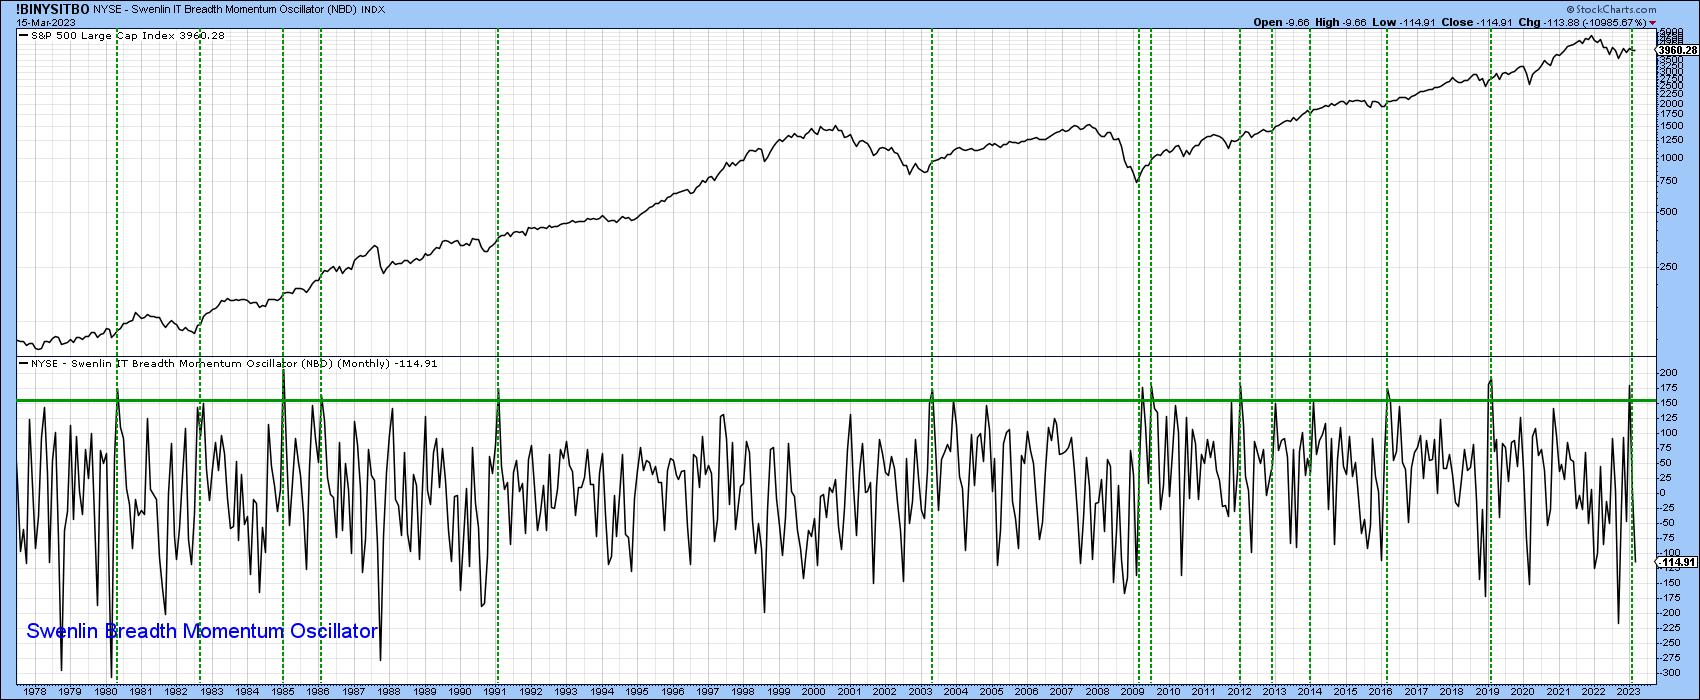
Chart 3 displays a monthly plot of the Swenlin Breadth Momentum Oscillator (!BINYSITBO), the concept of which isexplained here. The vertical lines show that, since 1978, this indicator has crossed the 150 threshold thirteen times. Each such breadth thrust was followed by a strong rally. A fourteenth such signal was triggered last month.
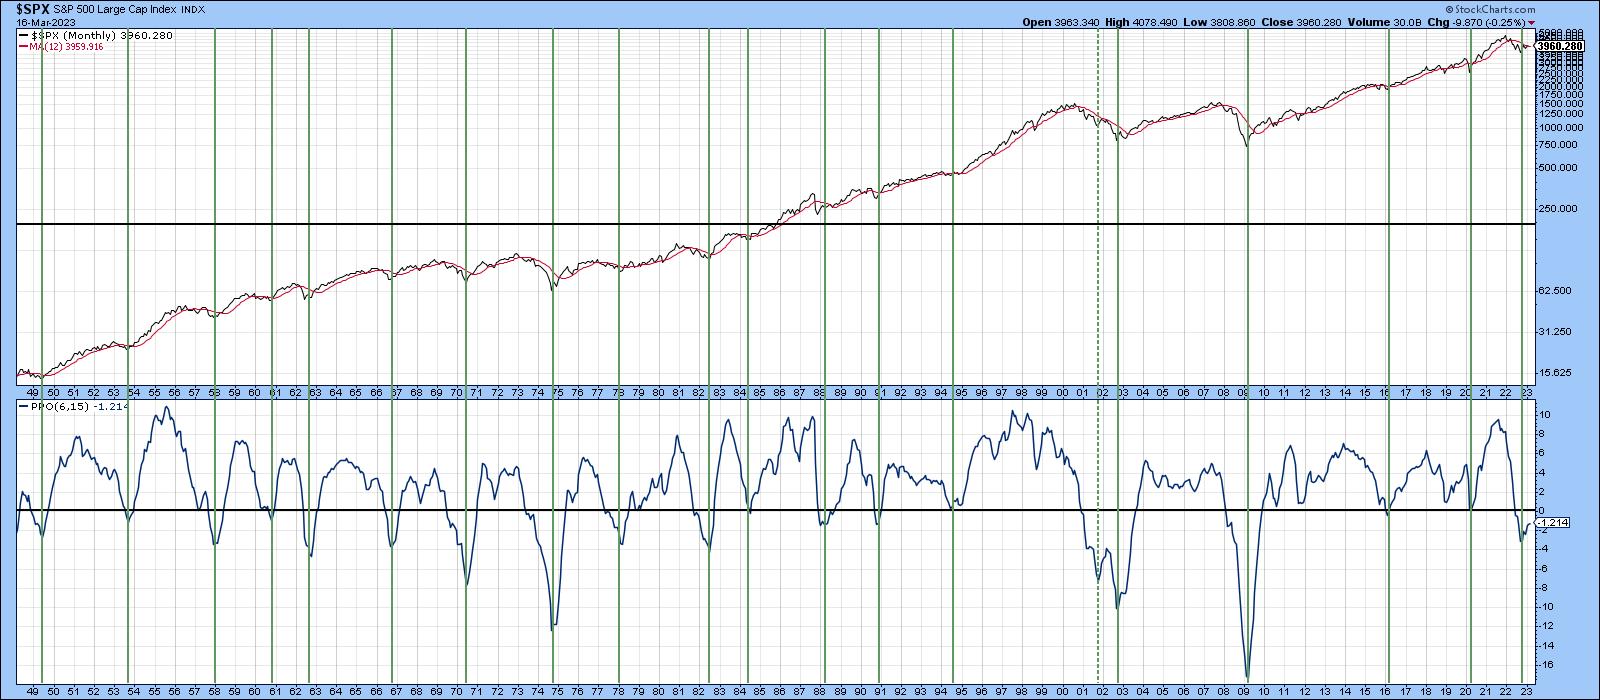
These bull market reversals could be threatened in the event that prices drop much further, but some of the short-term indicators I follow are suggesting that the cavalry is on the way. If the bull market scenario holds, this will turn out to be a great buying opportunity; after all, March is the second favorite month for important buying opportunities, after October. Also, we are just starting a very bullish seasonal time of the year; what is not firmly bullish though, is the S&P relative to its 12-month MA. That average is currently around 3,950, so, with a March 16th close of 3,960 that's a pretty small margin of comfort.
The Short-Term Picture
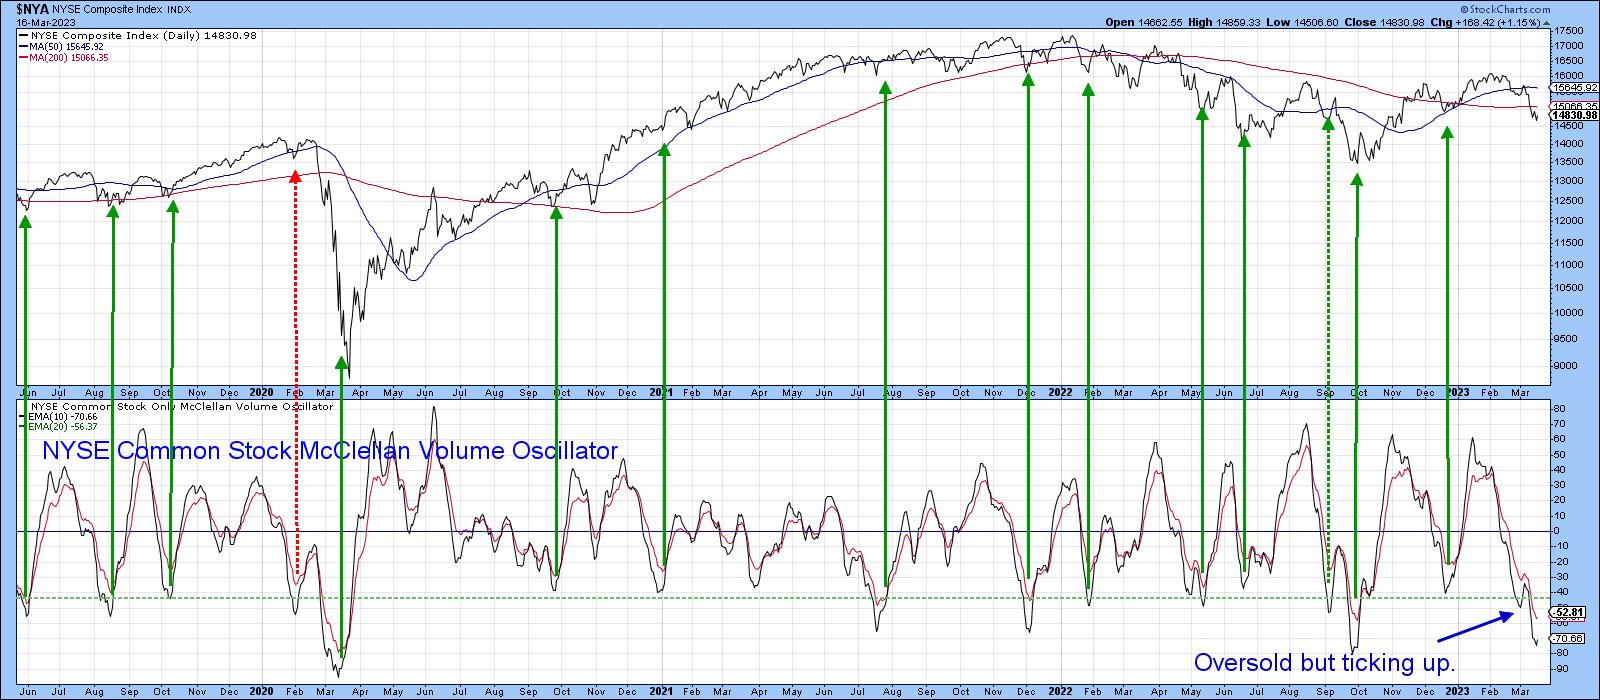
A useful indicator for spotting bottoms is the common stock only McClellan Volume Oscillator, or, rather, its 10-day EMA, which has been plotted in black (Chart 4). It has begun to tick up, but not enough to call a reversal, so we can't say it is bullish yet. However, this indicator is in the area of the 2020 and October 2022 low, both of which were followed by strong rallies after reversing direction to the upside. That overstretched reading tells me that, should prices merely stabilize in the next few sessions, an upside reversal will follow. If a mini-bull market really did begin last October, such an oversold reading ought to generate a strong advance, because genuine bull markets are invariably very sensitive to them.
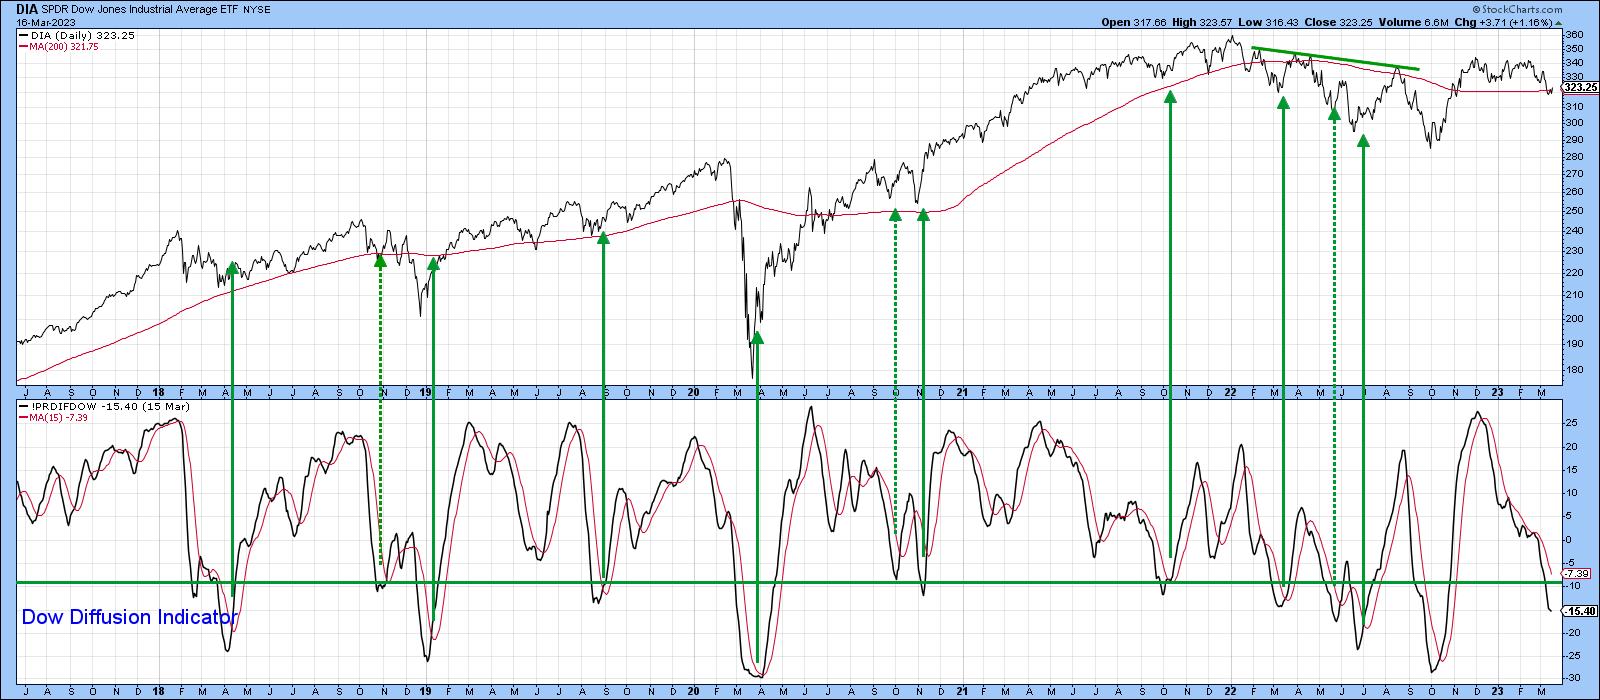
The same sort of comments can be applied to my Dow Diffusion Indicator, which is also deeply oversold. This one monitors the 30-Dow components to see which are in a positive trend. It triggers buy signals, as flagged by the green arrows, when it reverses to the upside from an overstretched level.
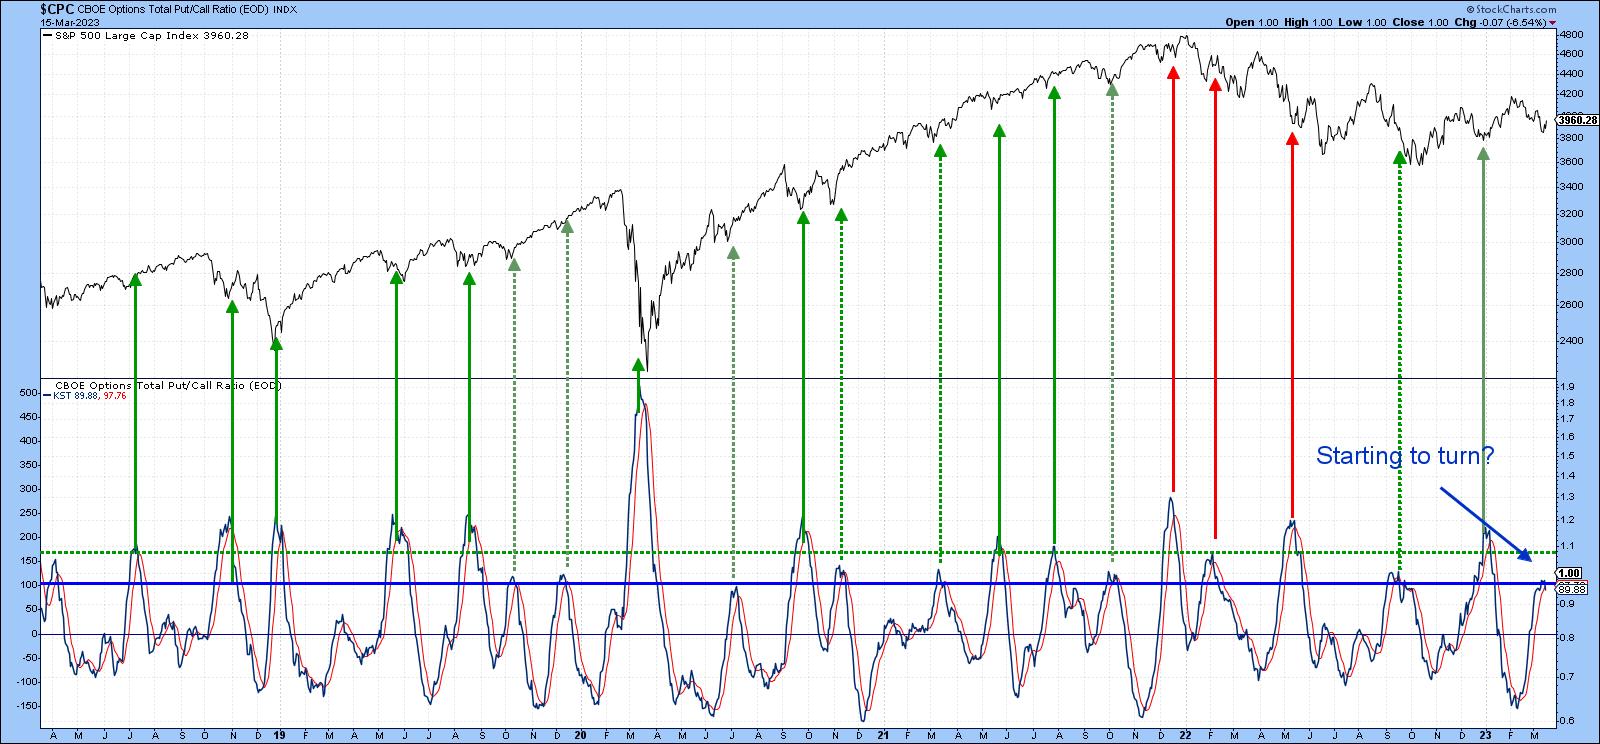
I also calculate a short-term KST based on put/call data. That's because sentiment momentum is just as important as the actual sentiment level. Assessing the speed of a mood swing, therefore, offers an additional dynamic to the analysis. In this instance, the solid green arrows in Chart 6 indicate when the KST peaks from a level beyond the green horizontal-dashed line. The dashed ones accomplish the same objective, but this time from a position around the blue line. Finally, the red arrows point up examples when these signals represent false positives.
In the last couple of days, the indicator has begun to slip to the downside once again. Given the wall-to-wall media coverage of bank failures, one would have thought that it would have rallied to a more elevated level. Its failure to reflect a higher level of negativity given the level of concern is a very positive sign, provided we have seen the top and the drop extends in the next few sessions. To follow this, and any of the other charts in this article, the chart can be updated by simply clicking on it. Note that this chart does not include the March 16 rally.
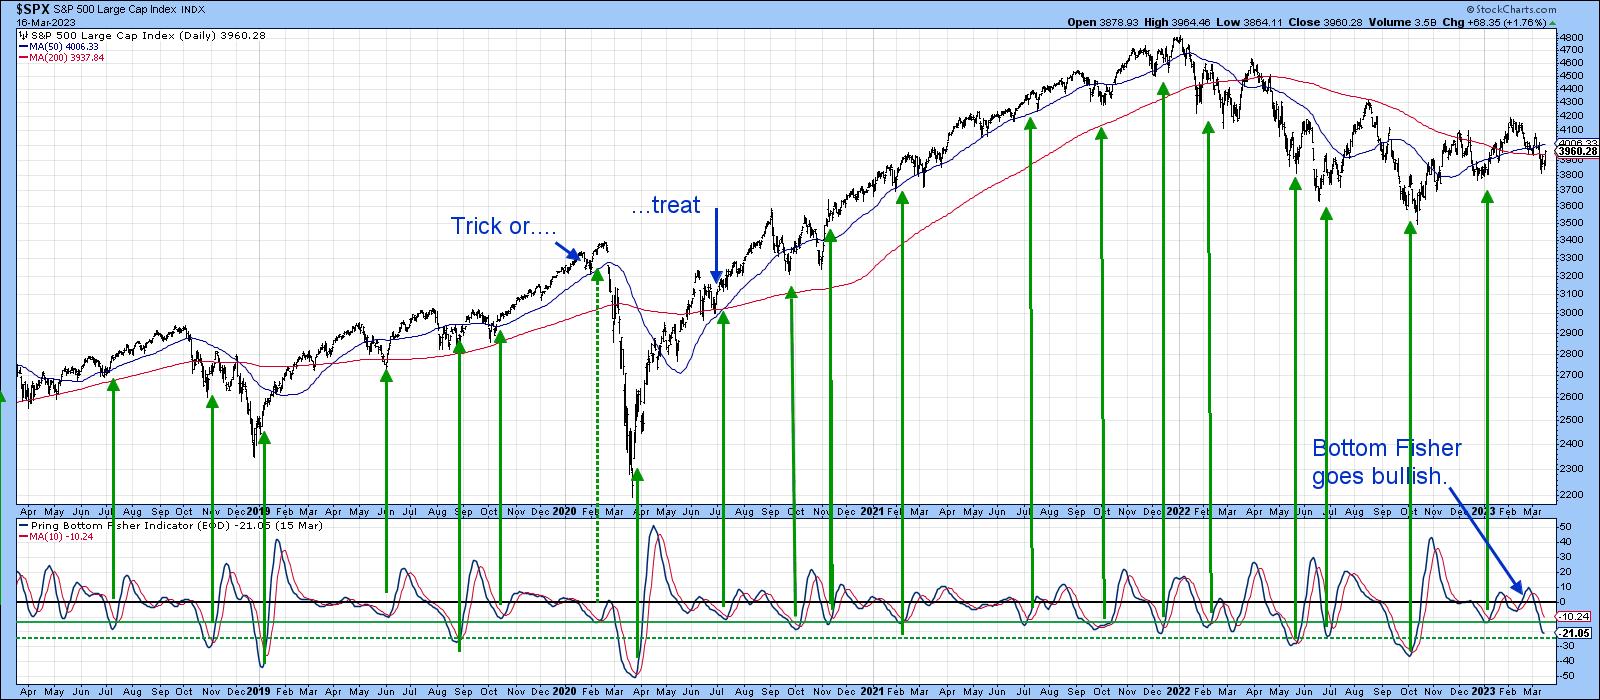
My Bottom Fisher, which you can read about here, gives short-term buy signals when it reverses to the upside from a position that is below the solid green horizontal line. What these reversals mean is that a progressive number of Dow components are shifting from a declining short-term KST that is also below zero to a rising one, thereby indicating a strengthening internal technical position. At present the "Fisher" is oversold, but still declining. However, given a few days stabilization or strength, it is likely to reverse to the upside.
NASDAQ Back in Favor?
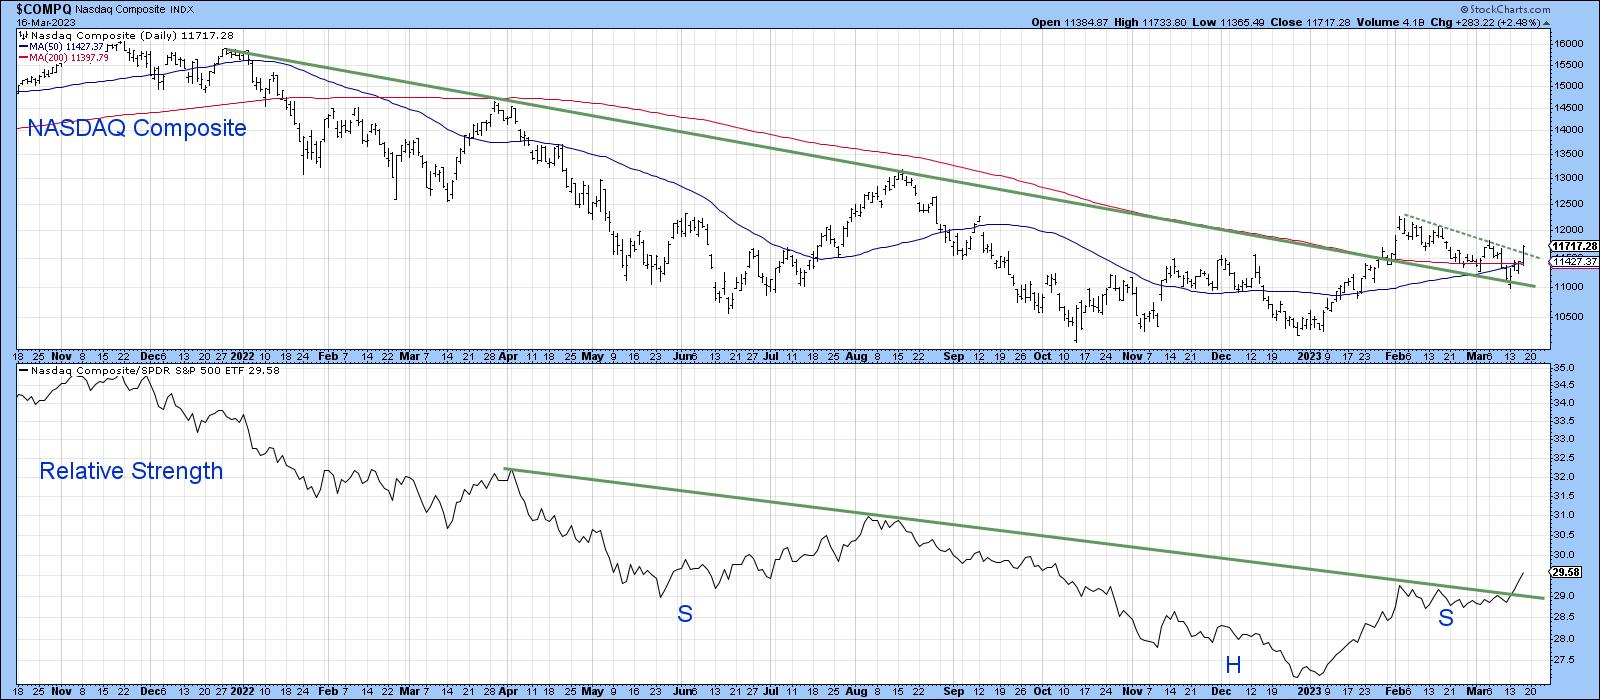
Our final chart shows that the NASDAQ has managed to hold above its extended bear market trendline and regain its 200-day MA. This index has been correcting since early February, but has now cleared the dashed green correction trendline. That suggests the retracement move has run its course, and the NASDAQ is now ready to rally. Finally, the RS line has broken out from a downward-sloping inverse head-and-shoulders, suggesting that, if a rally is underway, this will be amongst the leaders.
Conclusion
Primary bull markets are generally very sensitive to oversold conditions, unlike bear markets which are not. Working on the assumption that a lot of bullish long-term indicators are correct, the current widespread angst concerning the banking crisis and oversold short-term indicators suggests we may soon be pleasantly surprised. The next few days are likely to be critical in that respect.
Good luck and good charting,
Martin J. Pring
The views expressed in this article are those of the author and do not necessarily reflect the position or opinion of Pring Turner Capital Groupof Walnut Creek or its affiliates.


