Don't Let a Good Banking Crisis Go to Waste
Remember the wall-to-wall coverage concerning the FTX crypto collapse? It's a great example of why conventional wisdom and groupthink are usually wrong.
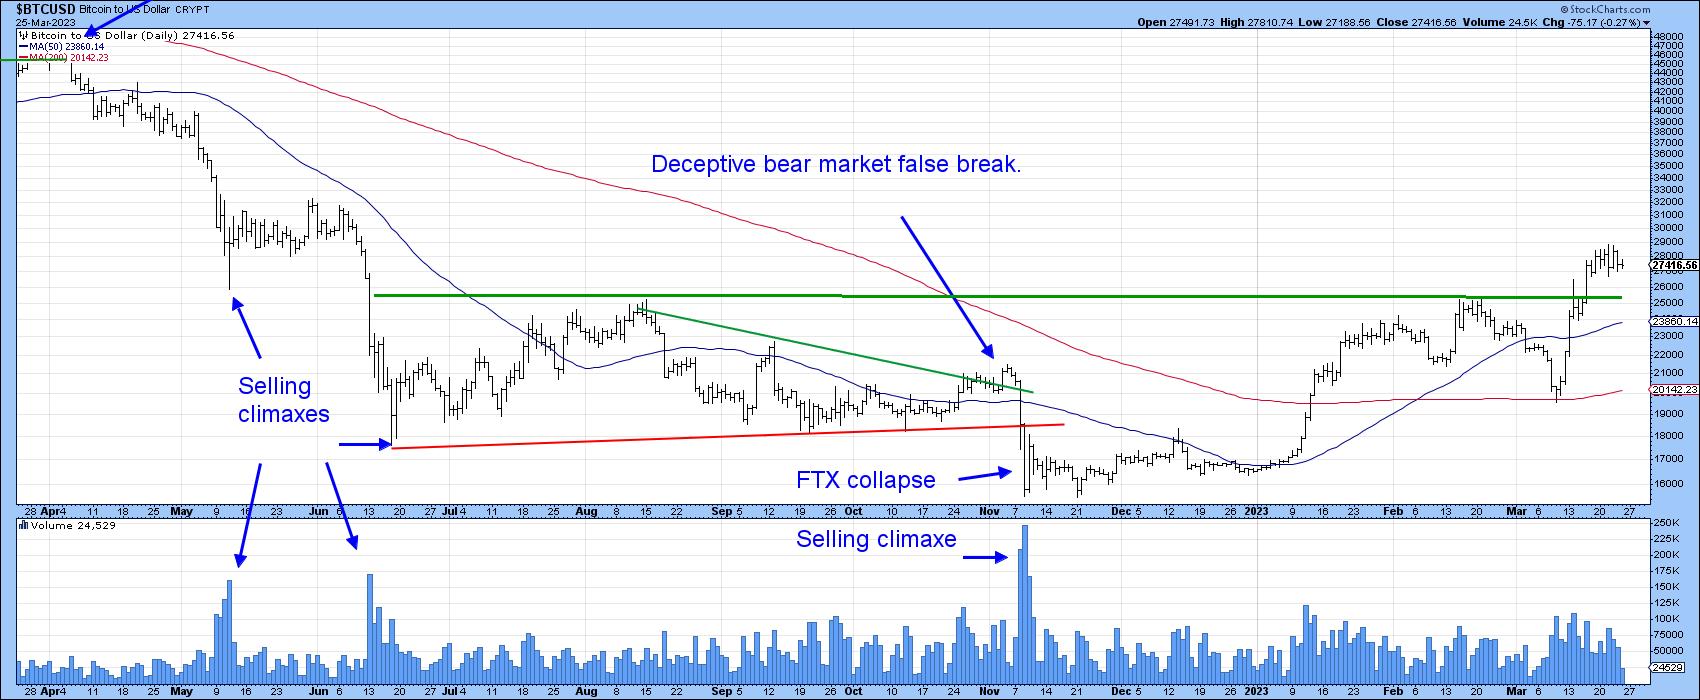
The prevailing hysteria had most traders brainwashed into expecting further crypto collapses and price drops. The simple fact is that, the market had been anticipating trouble since November 2021, but did not tell us the form which those problems would take. Chart 1 shows that, by the time the crisis hit, Bitcoin prices were tired of declining. The November 2022 selling climax and subsequent price action confirmed this.
I am not saying that it was possible to identify the November 2022 bottom as the low at the time. Certainly, we lacked the evidence for this. For example, useful techniques, such as declining peaks and troughs and the price relative to its 200-day or 12-month MA, were still bearish. The selling climax following a sharp drop, and the widespread awareness of the potential danger, though, was enough to conclude that a significant inflexion point had been reached and that the decline was no longer likely to extend in the intermediate term.
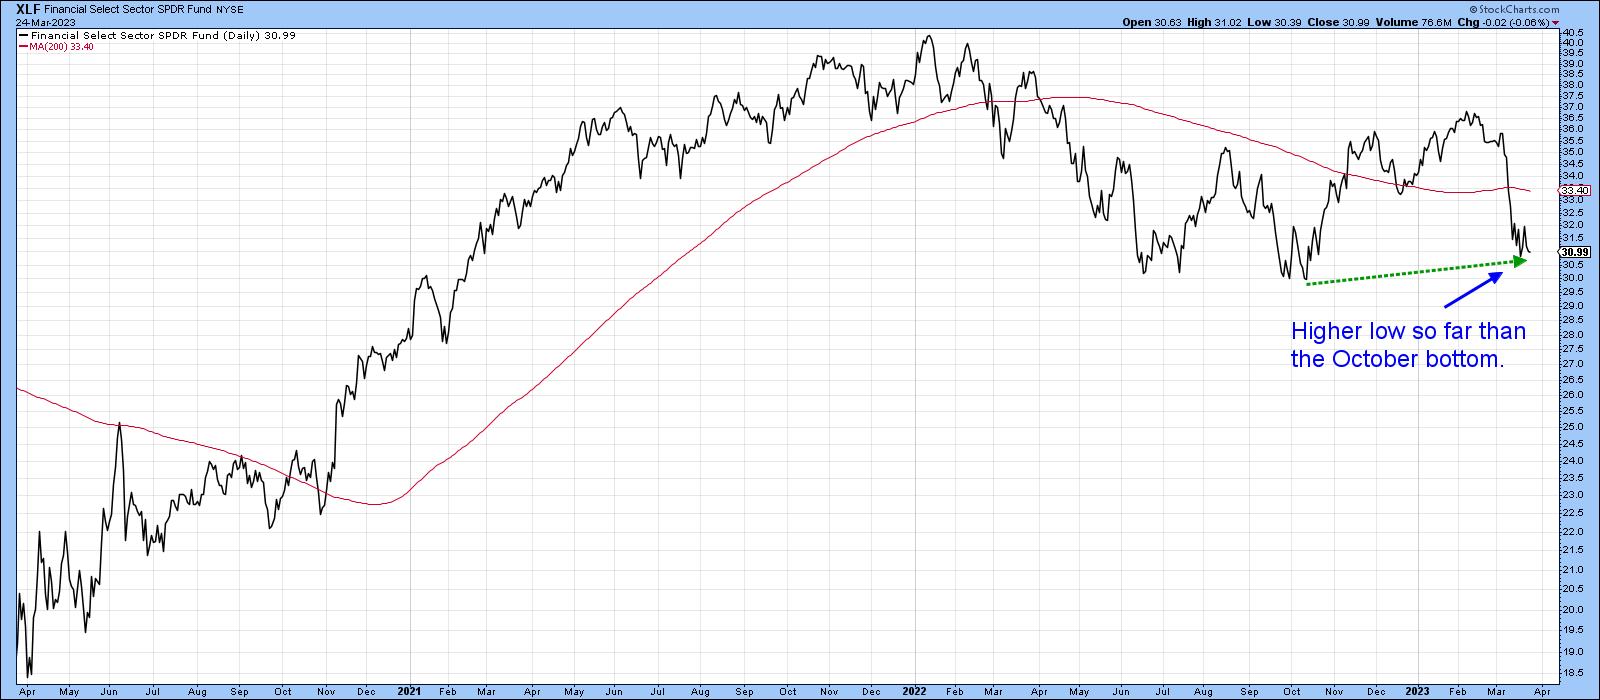
Fast-forward to the current banking crisis. Pause and close your eyes for a moment. Bear in mind the ominous national and international coverage given to the crisis. Now, ask yourself how much lower the SPDR Financial ETF (XLF) is relative to its July or October lows. Five, ten, fifteen percent, or perhaps more? Now open your eyes and look at Chart 2. The price is actually higher! All that scaremongering was unable to push prices to a new low. Of course, it's possible that another shoe could drop at any moment, but if it does not, it will be very encouraging from a contrary point of view.
The good news is that, apart from the obvious short-term oversold condition, there are some encouraging technical green shoots, suggesting that things may be ready to reverse to the upside.
First, Chart 3 tells us that the XLF has reached a crucial point, as it has tentatively dropped below support in the form of the secular up trendline dating from 2009. The PPO, using the 6- and 15-month parameters, is also slightly below zero, indicating a tentative sell signal. That said, this chart uses month-end closes, and it's not the end of the month yet. That's why an examination of the short-term price action is crucial, so let's go to the daily charts to observe what's happening.
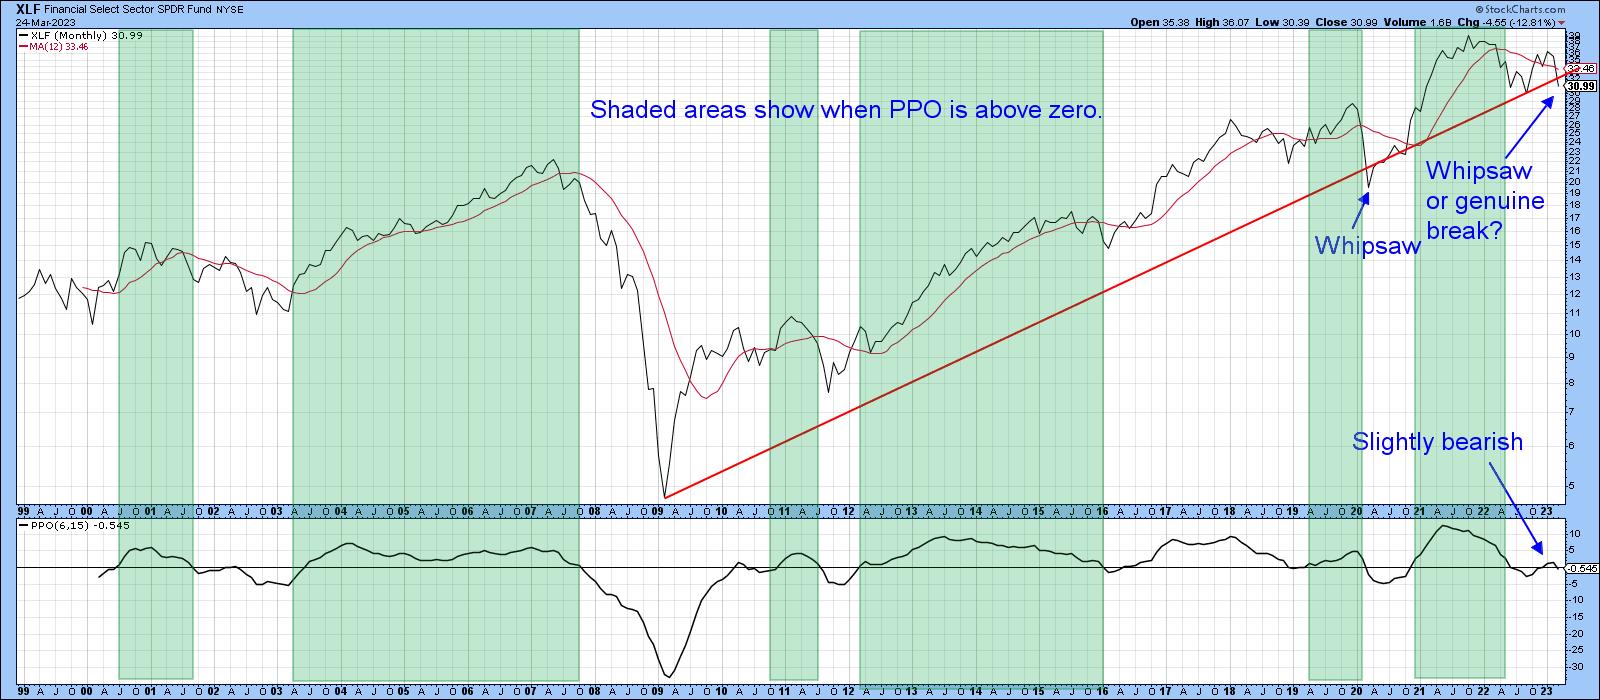
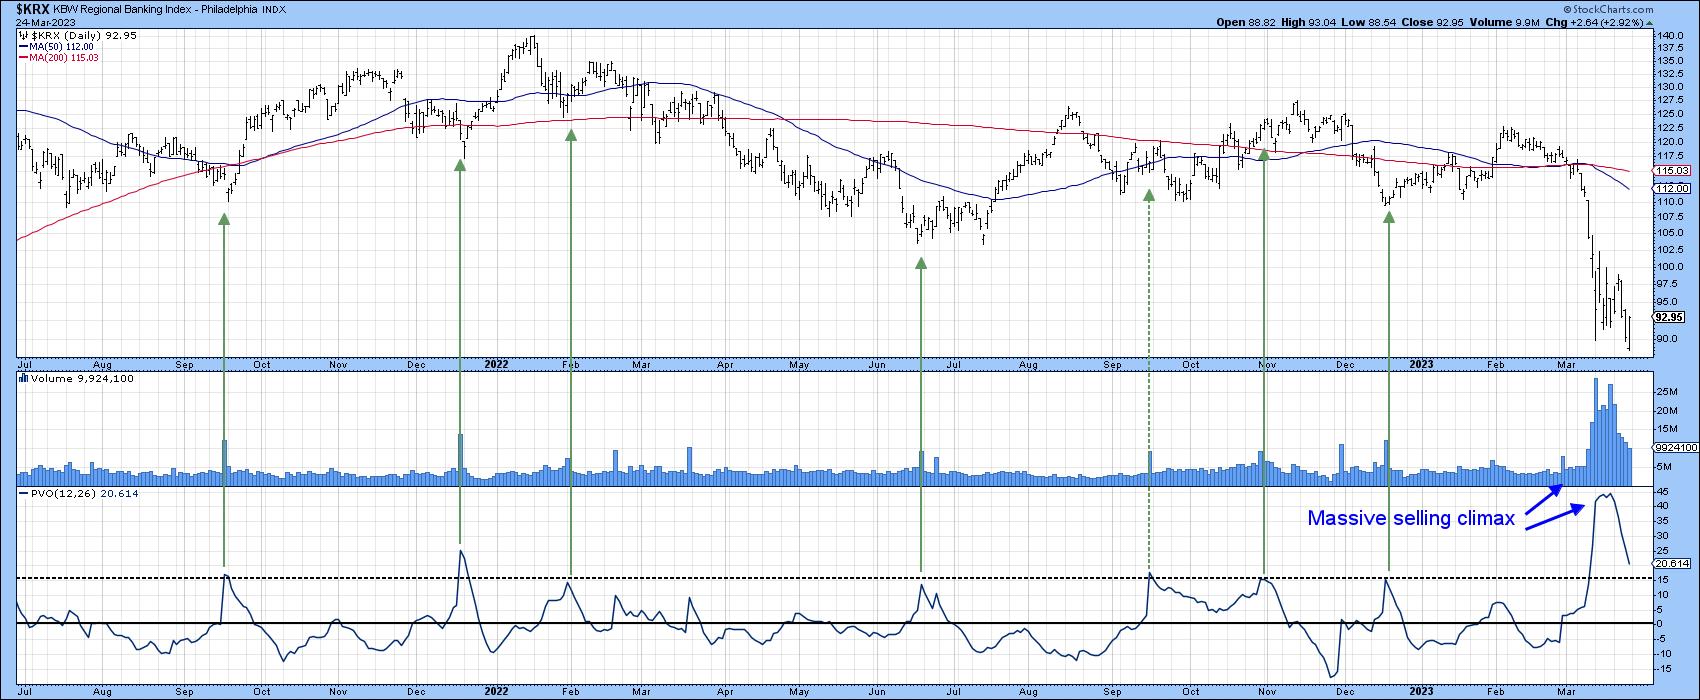
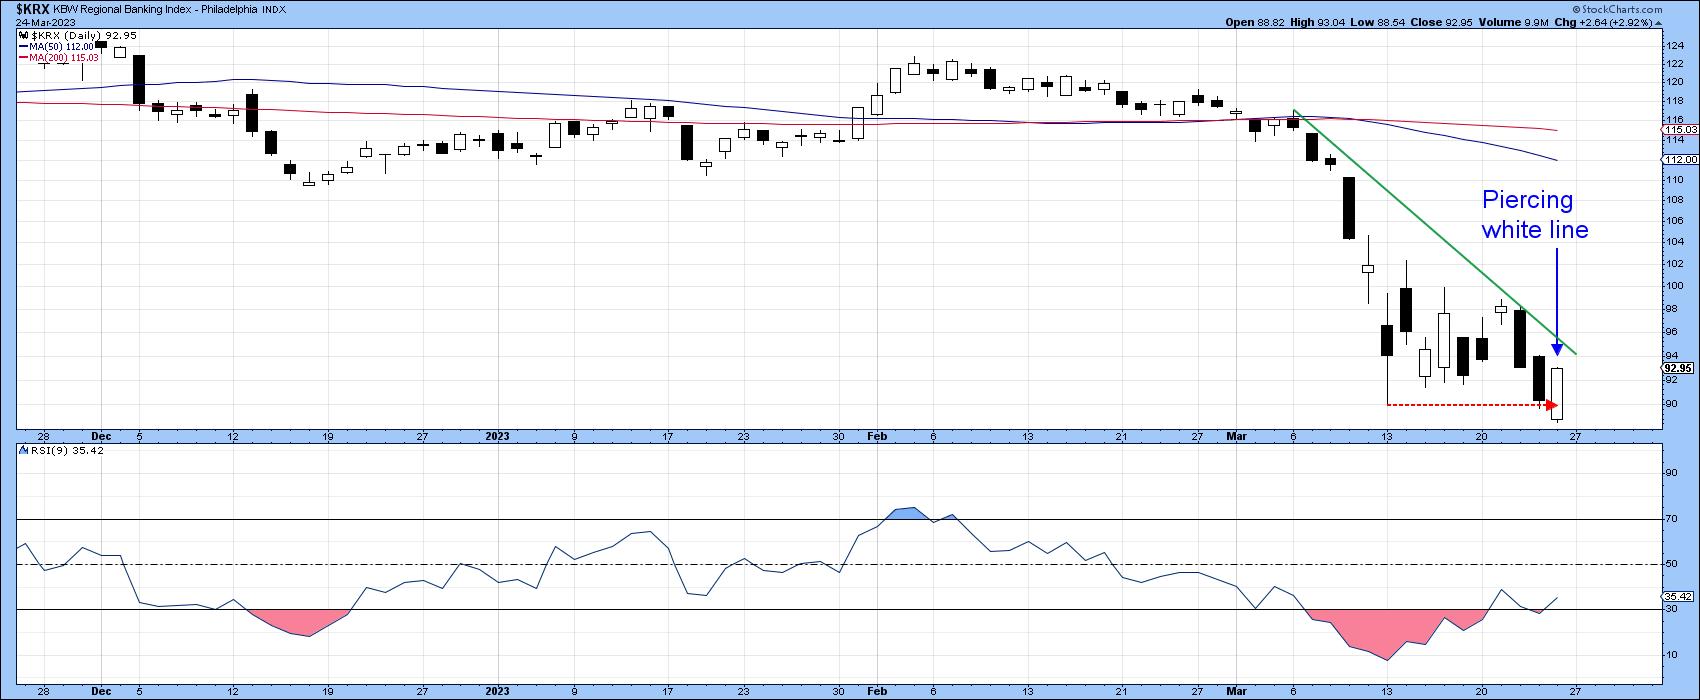
Chart 4 displays the KBW Regional Banking Index. This ETF has experienced a gigantic selling climax, which is evident both from the volume bars and the Price Volume oscillator based on 12- and 26-day parameters. Note that each of the previous smaller climaxes, with the exception of last September's signal, were followed by a rally.
Candlestick analysis in Chart 5 indicates that Friday's action was a bullish piercing white line. These patterns develop after a sharp decline, in which the real body of the white line opens with a gap to the downside. By the end of the session, though, buyers gained the upper hand, as the closing price takes it more than halfway up the previous candle's real body. It now requires a close above that green down trendline above $95 to confirm. (For a full description of this pattern, please see p. 349-350 of the fifth edition of Technical Analysis Explained.)To be sure, these patterns are expected to have a short-term effect on prices, but, given the finely balanced technical picture from Chart 3, a near-term advance from here could be enough to stave off a bearish longer-term signal.
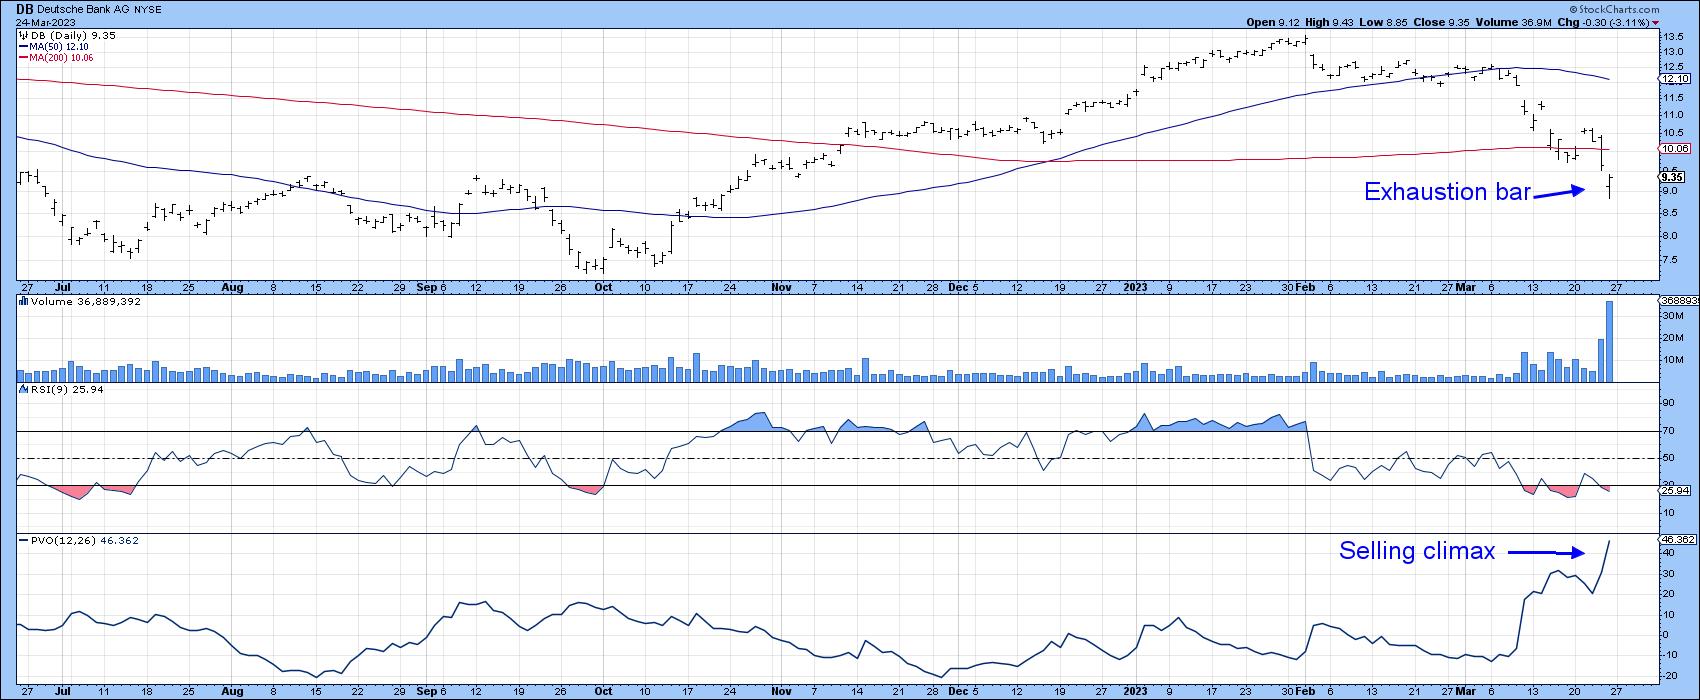
Friday's session was influenced by perceived problems at Deutsche Bank (DB). However, volume action was nevertheless encouraging, as it indicated a selling climax. That climax itself could still intensify should prices head lower. However, Friday's action suggests this is unlikely, since it reflects a bullish exhaustion bar.
These positive one-day formations (discussed in pages 204-206 in the fifth edition of Technical Analysis Explained) develop following a lengthy and sharp decline. The price opens sharply lower, creating a large downside gap in the process. However, it ends the session by closing in the top half of the bar. Friday's bar ended the session near the high. It was also accompanied with huge volume, which earns it extra bullish points. What is really interesting is that, even with all the excitement, DB's price is still substantially higher than its October low.
The General Market
If the banking crisis is truly over for the immediate future, this should be bullish for the broader equity market. In this respect, it's important to note that the banking crisis has given the market every excuse to experience a massive sell-off. Looking around, though, there has been relatively little in the way of collateral damage, consistent with a systematic collapse. Indeed, at no point has the $SPX penetrated its December low.
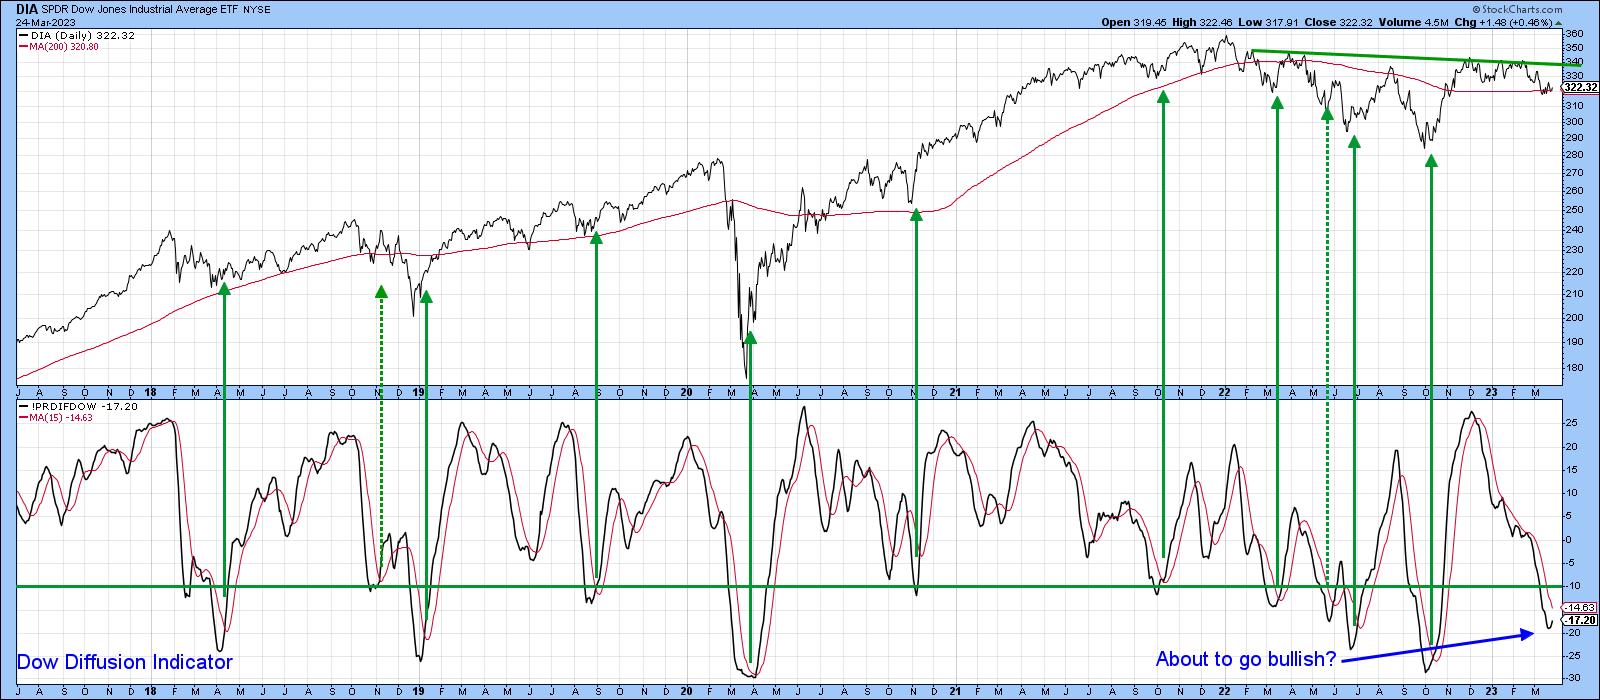
More to the point, we are starting to get some short-term buy signals. For example, the Dow Diffusion indicator in Chart 7 has just started to turn up and is close to a bullish MA crossover.
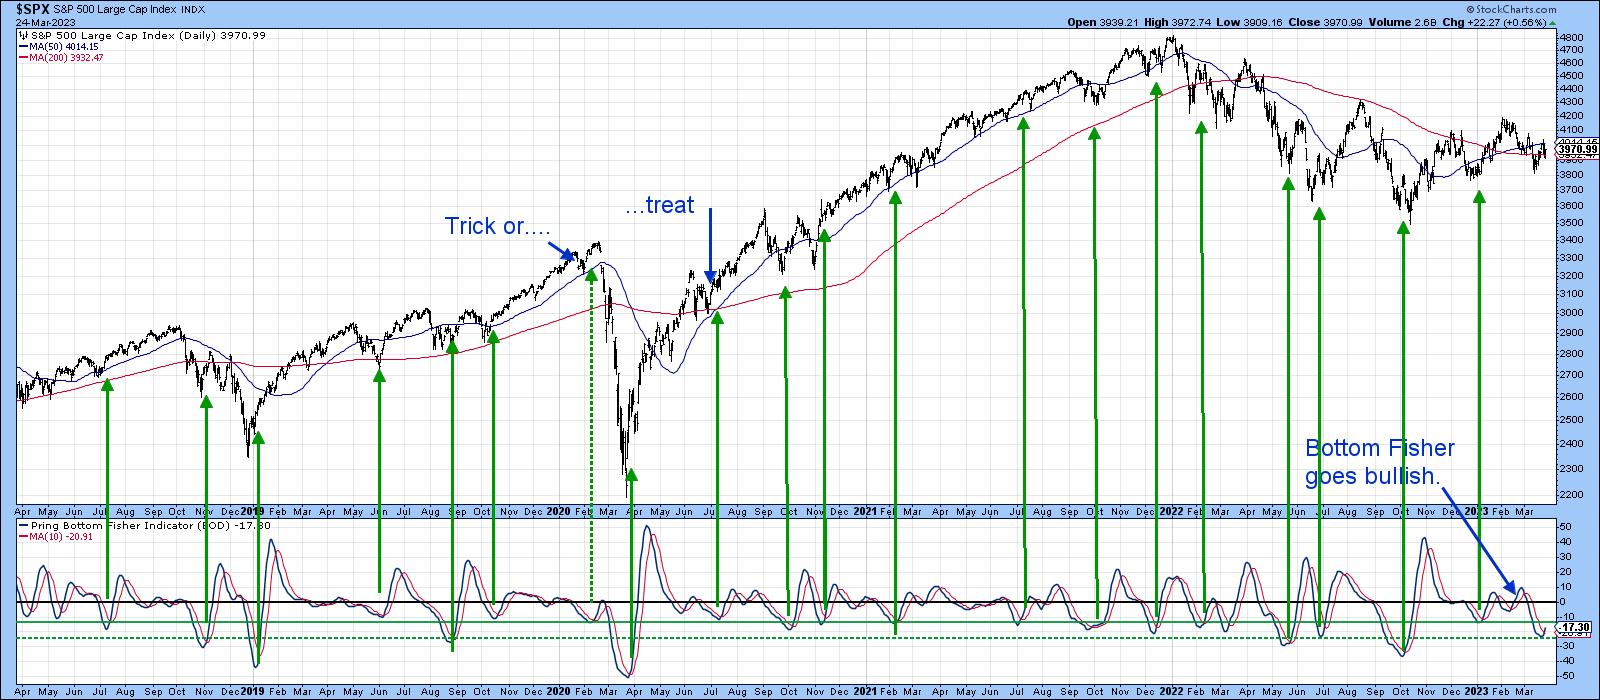
Also, my Bottom Fisher, which measures internal momentum relationships, has started to turn up from an oversold level, therefore earning another bullish green arrow.
These two indicators might be positive, but they do not guarantee a rally. However, given the widespread gloom and doom, it seems likely that the line of least resistance is higher, so don't let a good banking crisis go to waste!
Good luck and good charting,
Martin J. Pring
The views expressed in this article are those of the author and do not necessarily reflect the position or opinion of Pring Turner Capital Groupof Walnut Creek or its affiliates.


