Is Bitcoin Ready for Prime Time Again?
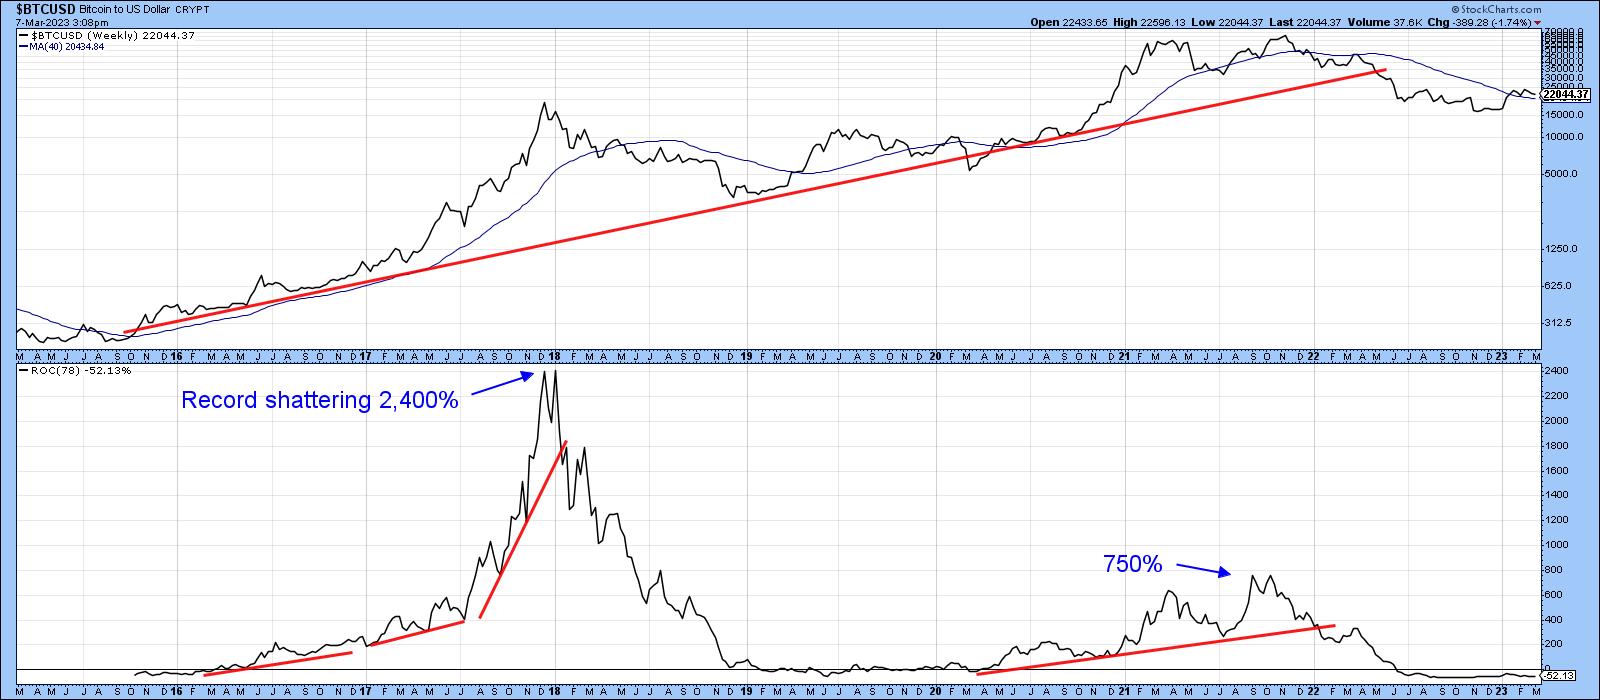
Last May, I wrote an article entitled "Bitcoin Bubble Finally Bursts", where I laid out the technical case for substantially lower prices. It was partially based on the fact that the 18-month ROC had peaked from a level in excess of 200%. My research, featuring 26 case studies of markets(not individual stocks)spread over hundreds of years, indicated that, whenever the 18-month ROC peaked from a reading in excess of 200%following several years of advance, that was enough to kill the bull market in question. Chart 1 shows that the Bitcoin ROC hit a record-shattering 2,400% in 2017. Remarkably, it only took three years to recapture the subsequent 80% decline. In 2021, the Bitcoin ROC reached a more modest, but still significant, 750%. The previous record, in excess of 500%, had been held by silver in 1980. The loss has so far approximated 75%, so the drop is definitely in the ballpark of downside activity for burst bubbles.
One of the characteristics of an unwinding bubble is the exposure of over-leveraged players. Indeed, I concluded the article by saying "with easy money no longer available, watch out below, as there are likely to be a substantial number of Warren Buffet's naked and fraudulent swimmers yet to be exposed." Last November, I again returned to the scene of the crime, because one of those naked swimmers, FTX and its collapse, was getting wall-to-wall coverage in the media, culminating in cover stories for The Economist, Businessweek, and Forbes. When such events grab the attention of the general-purpose media and public, in addition to regular market participants, it is often a good time to examine the charts for a possible reversal. After all, if everyone is aware of a problem, it's likely that it has already been factored into the price. It was far too early to call a basic primary trend reversal, as the longer-term indicators were still bearish, but, since then, several have begun to improve.
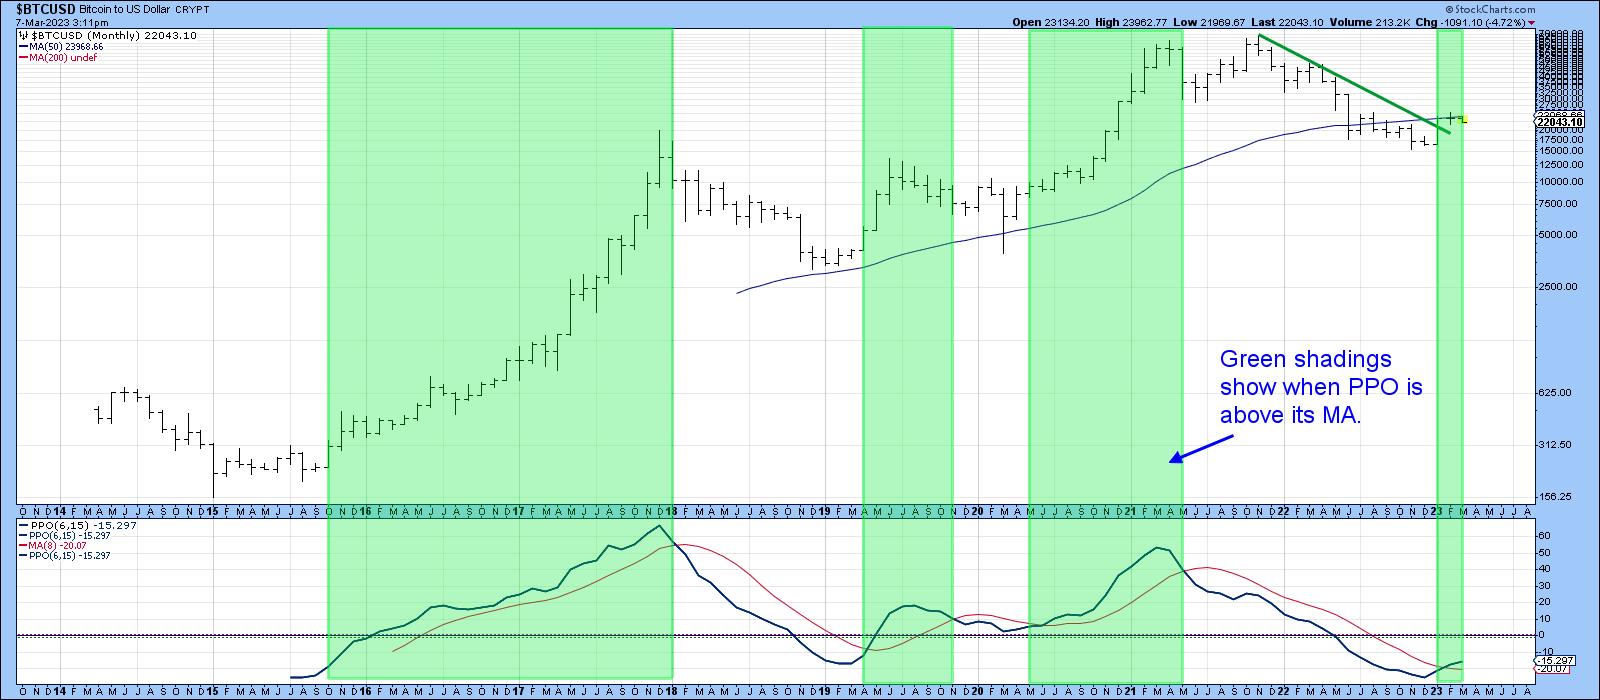
Chart 2, for instance features a PPO using the 6- and 15- month parameters. It goes bullish when it crosses above its 8-month SMA. Those periods have been flagged by the green shadings and include pretty well all the advances that have taken place since 2015. That indicator recently went bullish again, and the price itself violated its bear market trendline.
If it's a valid signal, and there are few grounds for suspecting otherwise, the implied strength ought to tip the balance in Chart 3, thereby enabling the current flat path of the Coppock Curve to reverse to the upside and a bullish signal. It's also evident that the price is extremely close to its 12-month MA, which reflects a very finely balanced technical picture.
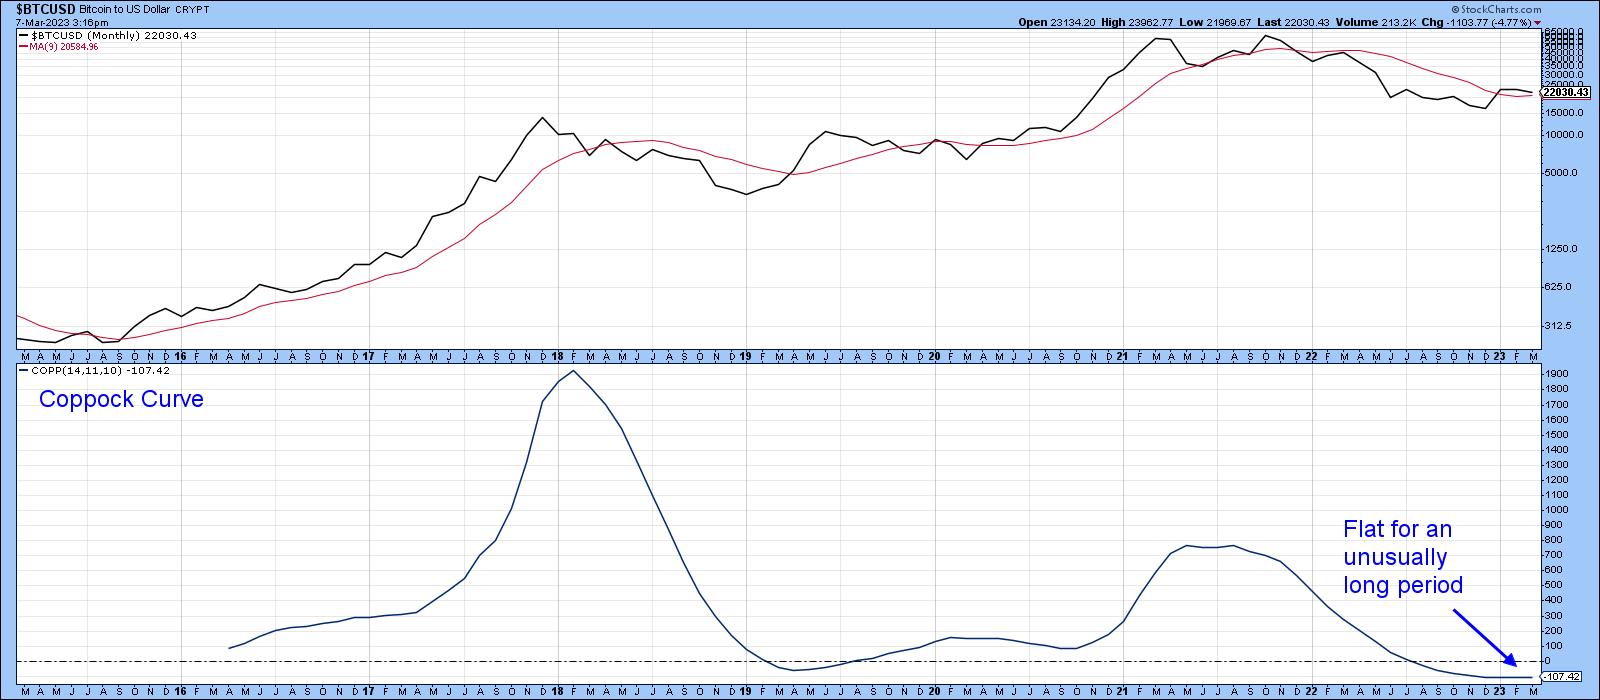
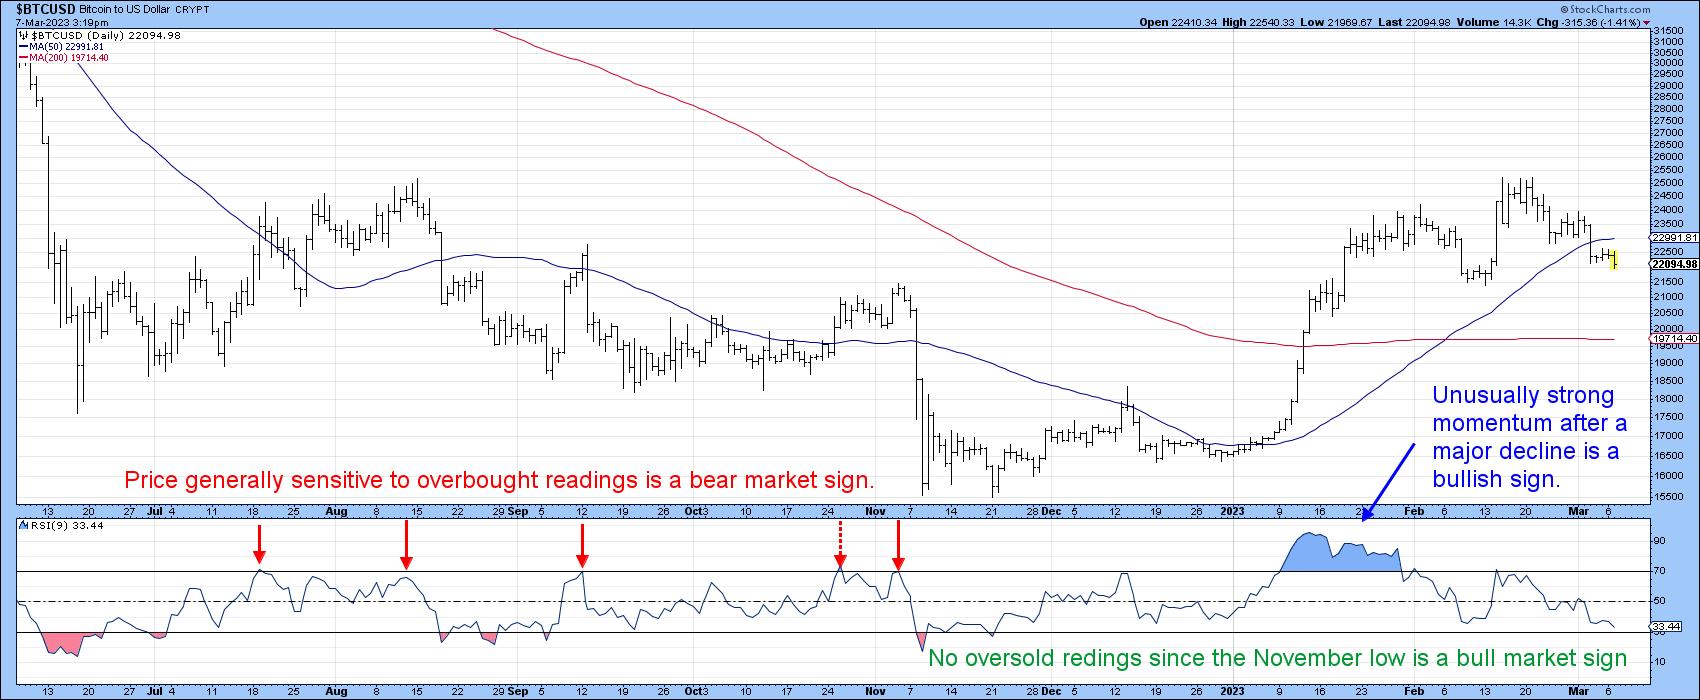
Chart 4 drills down in greater detail. The first thing to note is that there was no followthrough to the FTX collapse. Indeed, the price soon rallied back above the breakdown point, i.e. the red-dashed trendline, hinting that the whole move was a whipsaw. Now, it's running into resistance in the form of the 2022-23 green trendline around $25,000. A decisive move above that barrier would clearly re-confirm the series of rising peaks and troughs that began last November and complete a substantial base. However, the violation of the small 2023 red up trendline hints that the price may have to experience a test of its 200-day MA first.
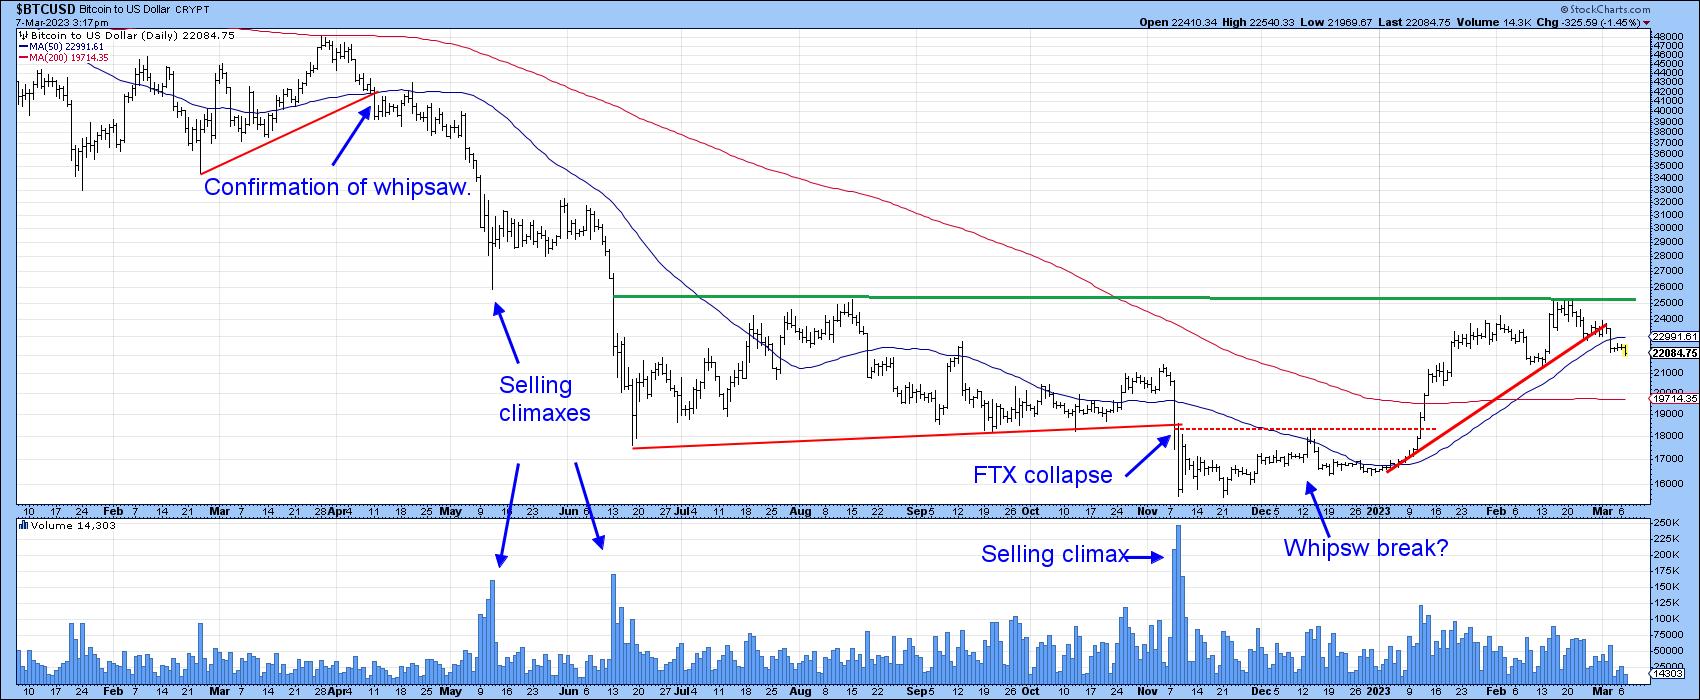
Chart 5 shows that the character of the market changed in November. Prior to that, oversold readings had trouble in generating rallies and overbought ones easily triggered selloffs. Those are primary bear market characteristics. Post-November, Bitcoin has experienced no oversold conditions and generated a persistent overbought condition earlier in the year. That's a bull market characteristic.
Conclusion
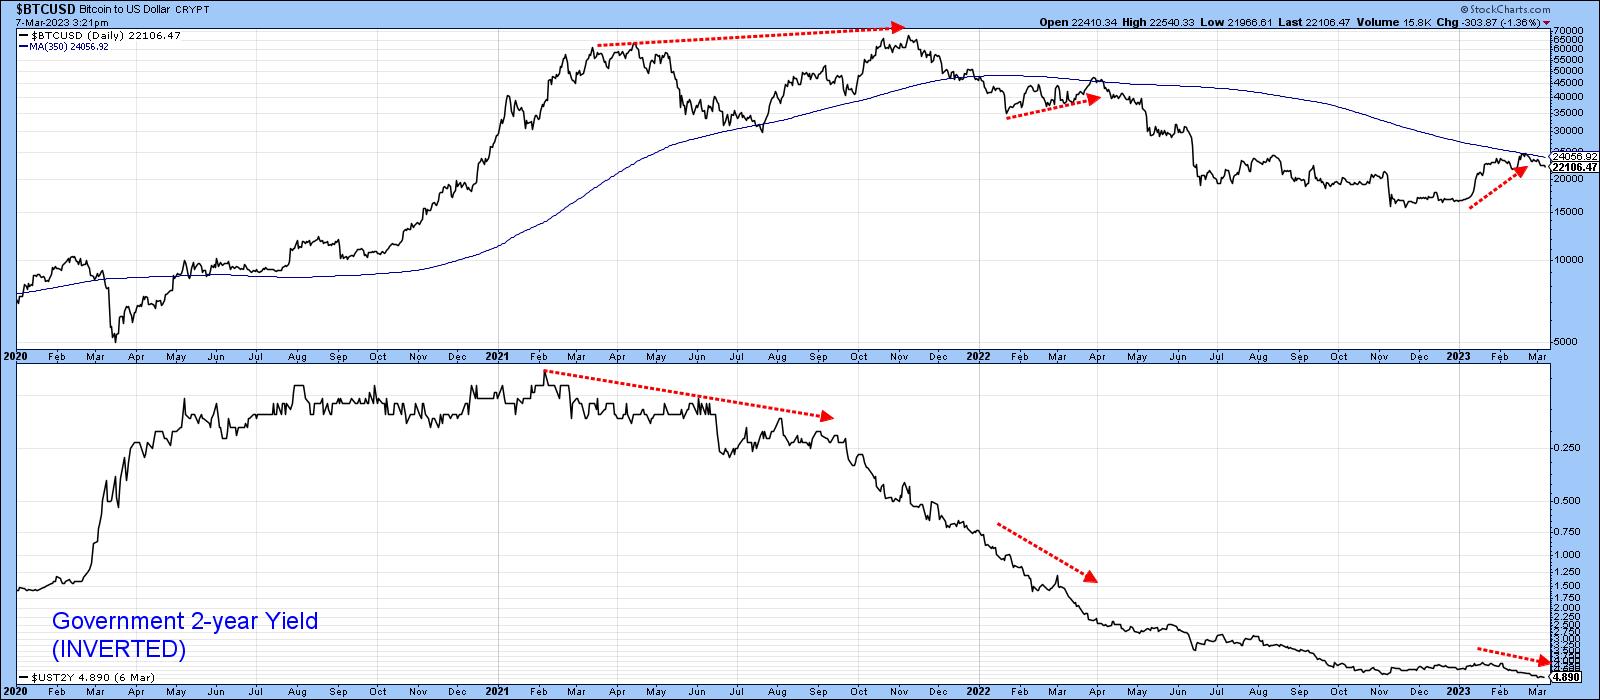
There is a good chance that a new primary bull market began with the FTX collapse last November. A decisive rally above $25,000 is all that's required by way of confirmation. In the meantime, Chart 6, which compares Bitcoin to the inversely plotted 2-year yield, tells us that, since 2020, its fate has been loosely tied to swings in interest rates. It's not a perfect relationship, but, since bubbles thrive on easy money and crashes develop when the monetary environment is more stringent, further Fed tightening has the potential to feed back into the crypto space. After all, the chart shows that the post-November advance has been accompanied by slightly higher rates, which could represent the third negative divergence between them and Bitcoin since early 2021.
So is Bitcoin ready for prime time again? Well, we are likely to find out once the current short-term correction has run its course.
Good luck and good charting,
Martin J. Pring
The views expressed in this article are those of the author and do not necessarily reflect the position or opinion of Pring Turner Capital Groupof Walnut Creek or its affiliates.


